Copyright
©2013 Baishideng Publishing Group Co.
World J Gastroenterol. Feb 14, 2013; 19(6): 846-854
Published online Feb 14, 2013. doi: 10.3748/wjg.v19.i6.846
Published online Feb 14, 2013. doi: 10.3748/wjg.v19.i6.846
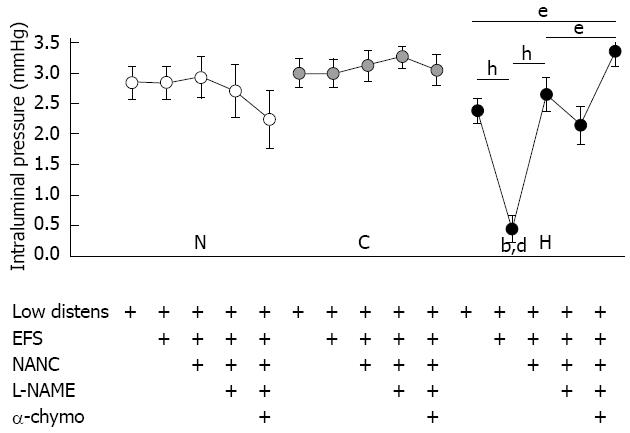
Figure 1 Basal intestinal tone.
Changes in basal intestinal tone of normal (N), control (C) and hypertrophic (H) ileal segments, expressed as values of intraluminal pressure (mmHg), exposed to different subsequent conditions: hydrostatic pressure of 5 cm H2O (Low distens), electrical field stimulation (EFS), NANC conditions (NANC), incubation with NG-nitro-L-arginine methyl ester (L-NAME) 300 μmol/L (L-NAME), incubation with α-chymotrypsin 10 IU/mL (α-chymo). Each value is the mean ± SE of 5 distinct experiments per group. bP < 0.001 vs corresponding normal values; dP < 0.001 vs corresponding control values; eP < 0.05; hP < 0.001; analysis of variance test followed by Bonferroni’s post-test.
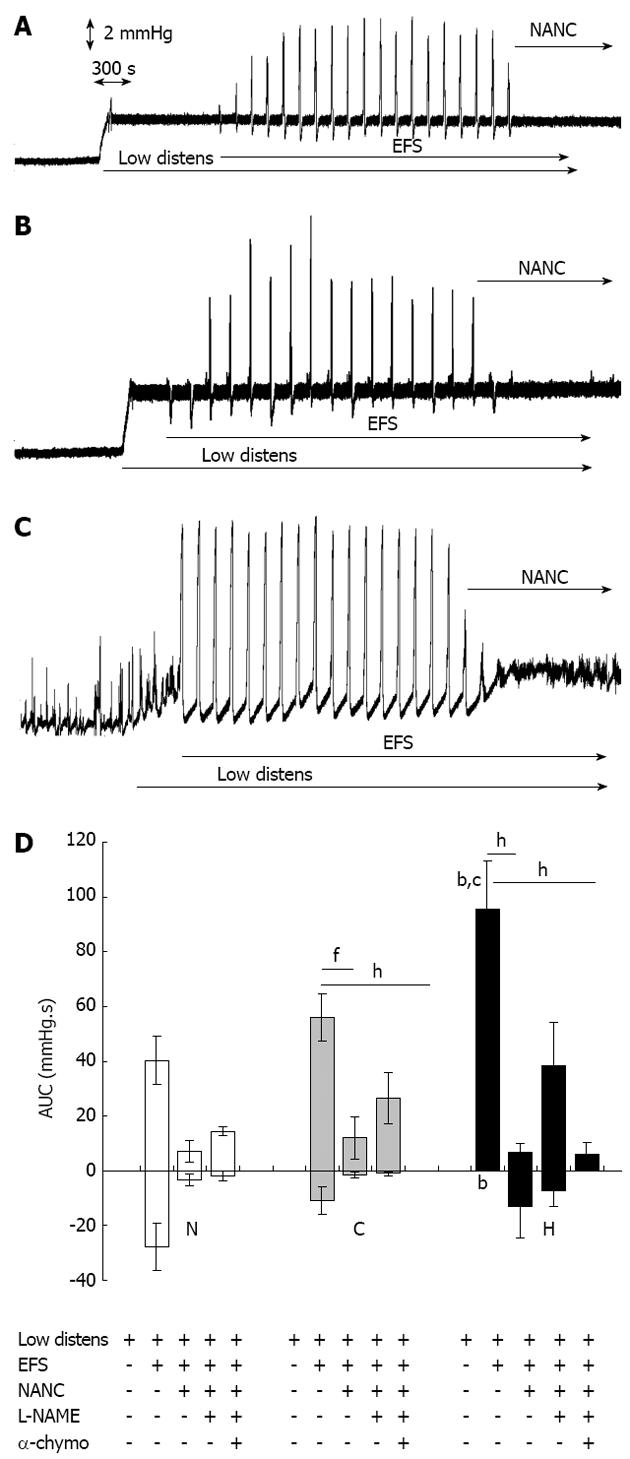
Figure 2 Motor responses to electrical field stimulation.
Original tracings representing changes of intraluminal pressure of ileal segments in basal conditions and following subsequent application of a hydrostatic pressure of 5 cm H2O (Low distens), EFS (30 V, 1 ms, 3 Hz, trains lasting 20 s every 120 s) and NANC conditions (NANC). A: Normal tissues; B: Control tissues; C: Hypertrophic tissues; D: Area under the pressure-time curve of motor responses in normal (N), control (C) and hypertrophic (H) ileal segments following subsequent application of a hydrostatic pressure of 5 cm H2O (Low distens), EFS (30 V, 1 ms, 3 Hz, trains lasting 20 s every 120 s), NANC conditions (NANC), incubation with L-NAME 300 μmol/L (L-NAME) and incubation with α-chymotrypsin 10 IU/mL (α-chymo). Each value is the mean ± SE of 5 distinct experiments per group. bP < 0.01 vs corresponding normal values; cP < 0.05 vs corresponding control values; fP < 0.01; hP < 0.001; analysis of variance test followed by Bonferroni’s post-test.
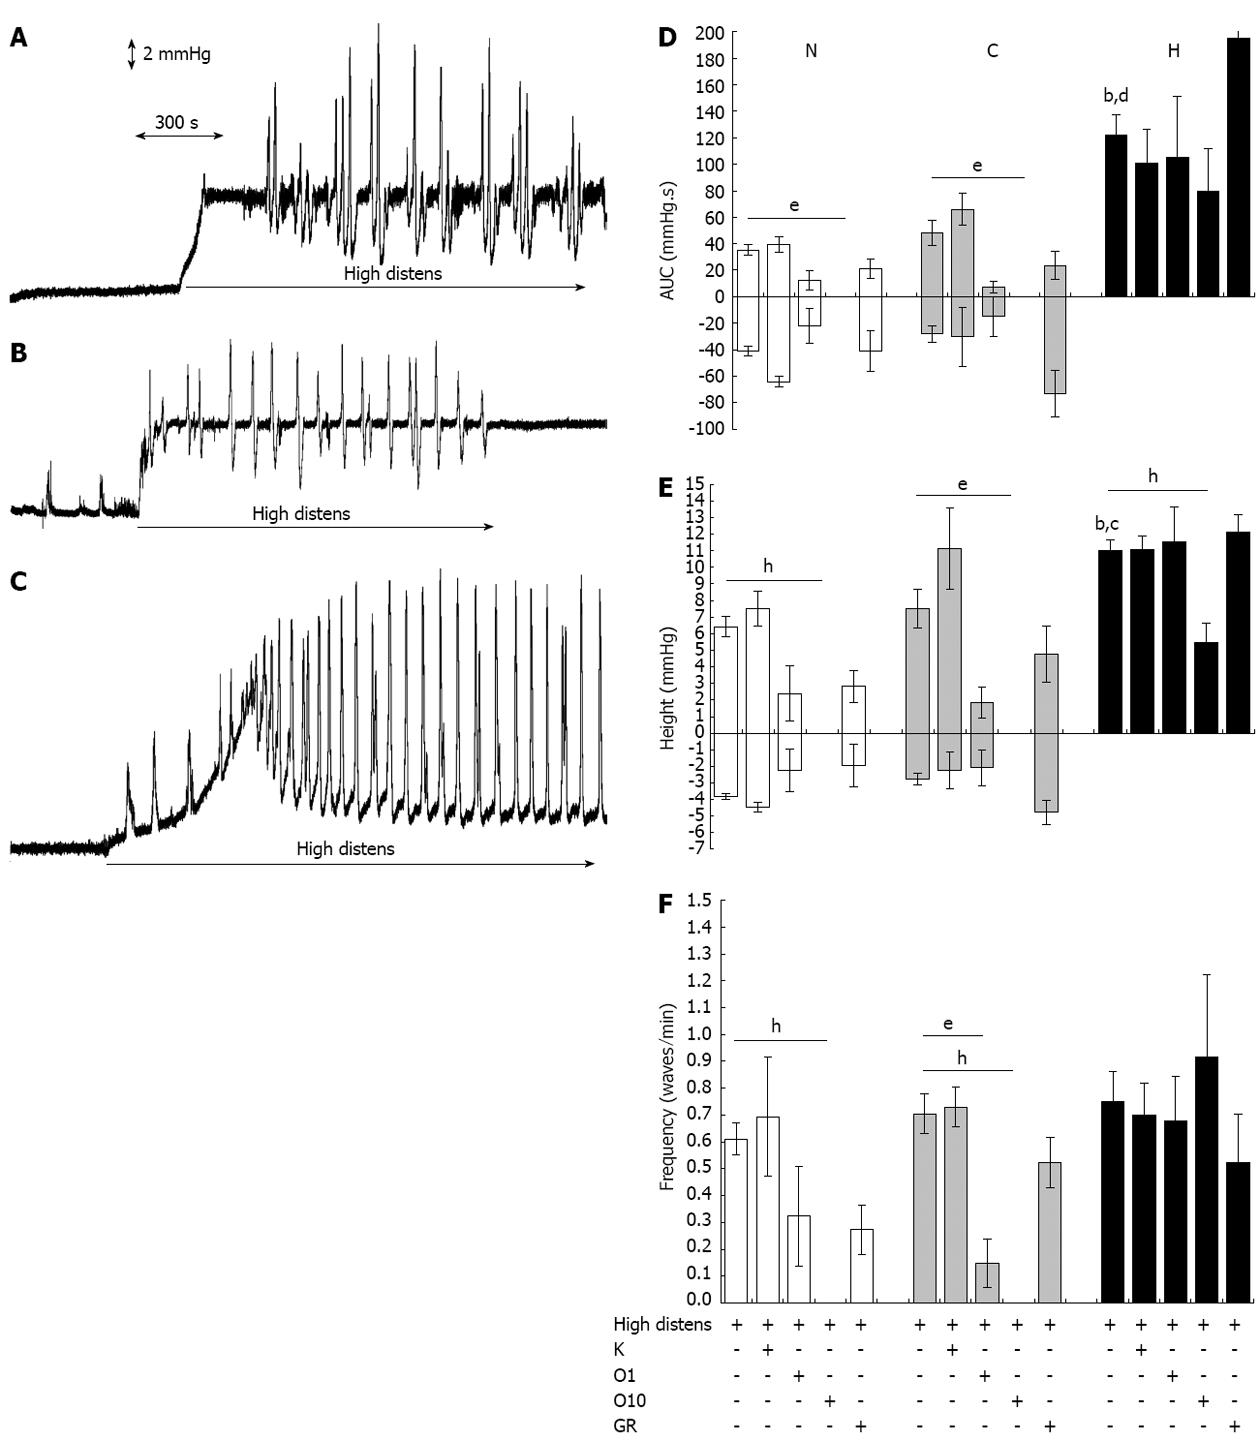
Figure 3 Distension-induced motility.
Original tracings representing changes of intraluminal pressure of ileal segments in basal conditions and following application of a hydrostatic pressure of 8 cm H2O (high distens). A: Normal tissues; B: Control tissues; C: Hypertrophic tissues; D-F: Motor responses in normal (N), control (C) and hypertrophic (H) ileal segments following application of a hydrostatic pressure of 8 cm H2O (high distens) and incubation with ketanserin 1 μmol/L (K), ondansetron 1 (O1) or 10 (O10) μmol/L or GR125487 1 μmol/L (GR). D: Amplitude (area under the pressure-time curve or AUC); E: Height; F: Frequency. Each value is the mean ± SE of 5 distinct experiments per group. bP < 0.001 vs corresponding normal values; cP < 0.05, dP < 0.001 vs corresponding control values; eP < 0.05; hP < 0.01. Analysis of variance test followed by Bonferroni’s post-test.
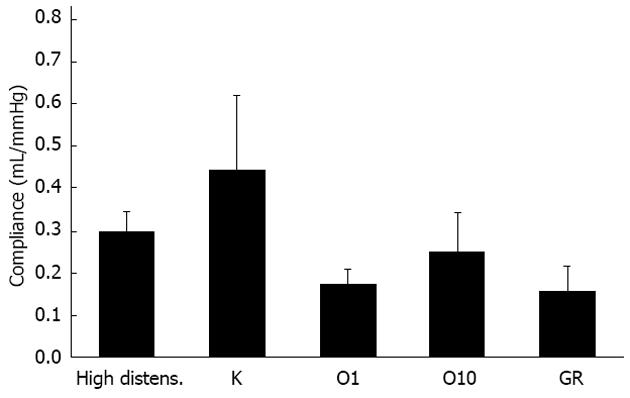
Figure 4 Average compliance of hypertrophic ileum.
Changes of the average compliance of hypertrophic intestinal wall following application of a hydrostatic pressure of 8 cm H2O (high distens.) and incubation with ketanserin 1 μmol/L (K), ondansetron 1 (O1) or 10 (O10) μmol/L or GR125487 1 μmol/L (GR). Each value is the mean ± SE of 5 distinct experiments per group.
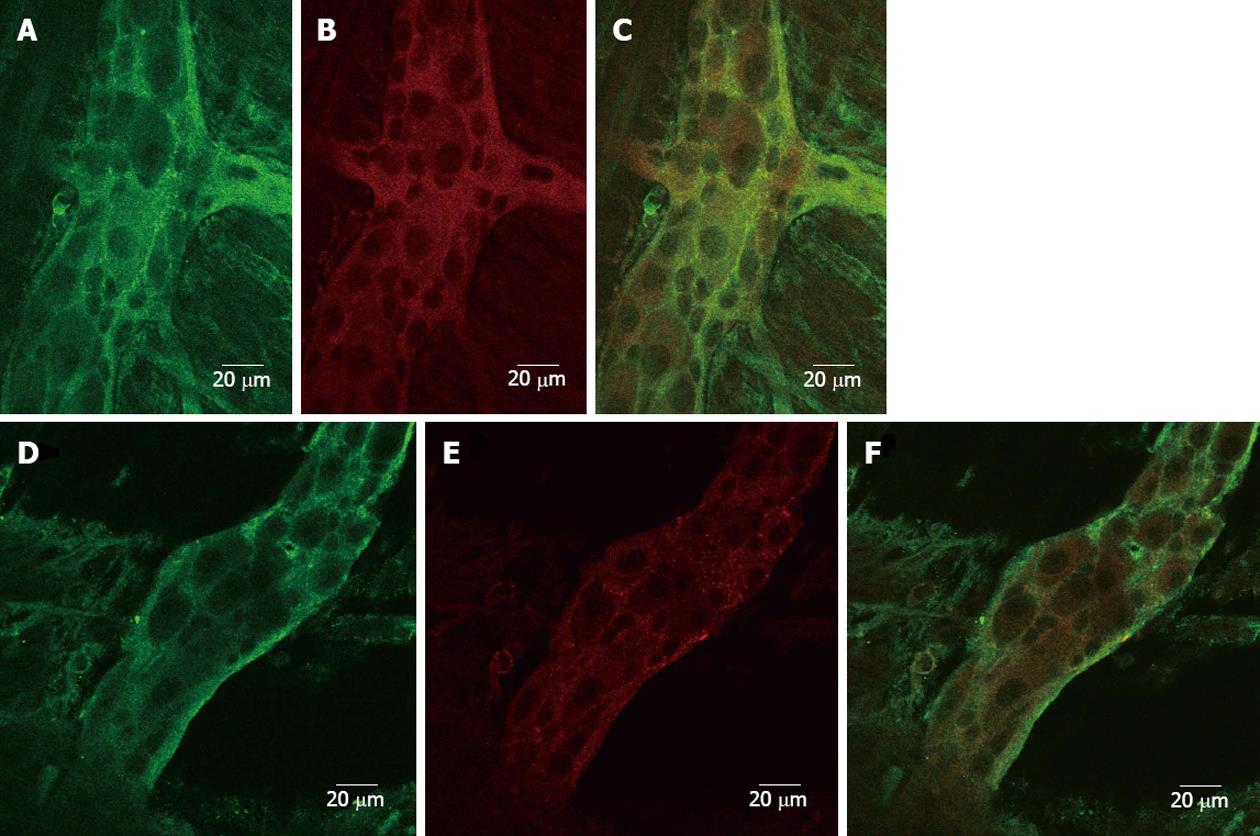
Figure 5 Cellular localization of 5-HT3 receptors in control and hypertrophic ileum.
Confocal images (0.5 μm sections; scale bar 20 μm) of myenteric plexus neurons isolated from control and hypertrophic ileal tissues. A: Image showing 5-HT3 receptor immunoreactivity visualized using donkey-anti-rabbit immunoglobulin G (IgG) conjugated with AlexaFluor 488 (green); B: Image showing clathrin immunoreactivity visualized using a donkey-anti-mouse IgG conjugated with Dylight 549 (red); C: Merged images from A and B; D: Image showing 5-HT3 receptor immunoreactivity visualized using donkey-anti-rabbit IgG conjugated with AlexaFluor 488 (green); E: Image showing clathrin immunoreactivity visualized using a donkey-anti-mouse IgG conjugated with Dylight 549 (red); F: Merged images from D and E.
- Citation: Bertoni S, Saccani F, Gatti R, Rapalli A, Flammini L, Ballabeni V, Barocelli E. Accommodation and peristalsis are functional responses to obstruction in rat hypertrophic ileum. World J Gastroenterol 2013; 19(6): 846-854
- URL: https://www.wjgnet.com/1007-9327/full/v19/i6/846.htm
- DOI: https://dx.doi.org/10.3748/wjg.v19.i6.846


