Copyright
©2013 Baishideng Publishing Group Co.
World J Gastroenterol. Dec 28, 2013; 19(48): 9318-9327
Published online Dec 28, 2013. doi: 10.3748/wjg.v19.i48.9318
Published online Dec 28, 2013. doi: 10.3748/wjg.v19.i48.9318
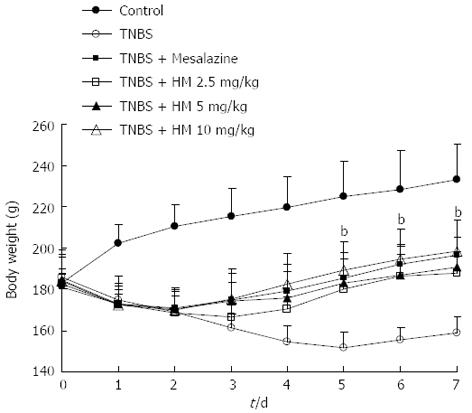
Figure 1 Treatment with hydroxynaphthoquinone mixture ameliorates body weight loss of 2,4,6-trinitrobenzene sulfonic acid-induced rats.
Colitis was induced by intracolonic administration of TNBS (80 mg/kg, dissolved in 50% ethanol). Rats were treated daily for 7 d with HM (2.5, 5, 10 mg/kg) and mesalazine 100 mg/kg 24 h after TNBS instillation. Disease progression was monitored by observation of clinical signs and body weight change. Data are represented as mean ± SD of 8 animals of each group. bP < 0.01 vs TNBS alone. HM: Hydroxynaphthoquinone mixture; TNBS: 2,4,6-trinitrobenzene sulfonic acid.
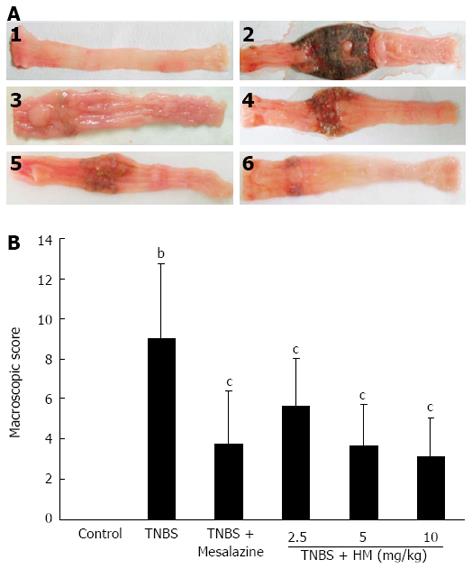
Figure 2 Hydroxynaphthoquinone mixture reduces colonic macroscopic damage in rats with 2,4,6-trinitrobenzene sulfonic acid-induced colitis.
A: Intestinal macroscopic changes; B: Macroscopic pathological scores. Colitis was induced by intracolonic administration of TNBS (80 mg/kg, dissolved in 50% ethanol). Rats were treated daily for 7 d with HM (2.5, 5, 10 mg/kg) and mesalazine 100 mg/kg 24 h after TNBS instillation. 1: Control; 2: Rat treated with TNBS alone; 3: Rat treated with TNBS and mesalazine; 4-6: Rats treated with TNBS and HM (2.5, 5, 10 mg/kg). Data are represented as mean ± SD of 8 animals of each group. bP < 0.01 vs control; cP < 0.05 vs TNBS alone. HM: Hydroxynaphthoquinone mixture; TNBS: 2,4,6-trinitrobenzene sulfonic acid.
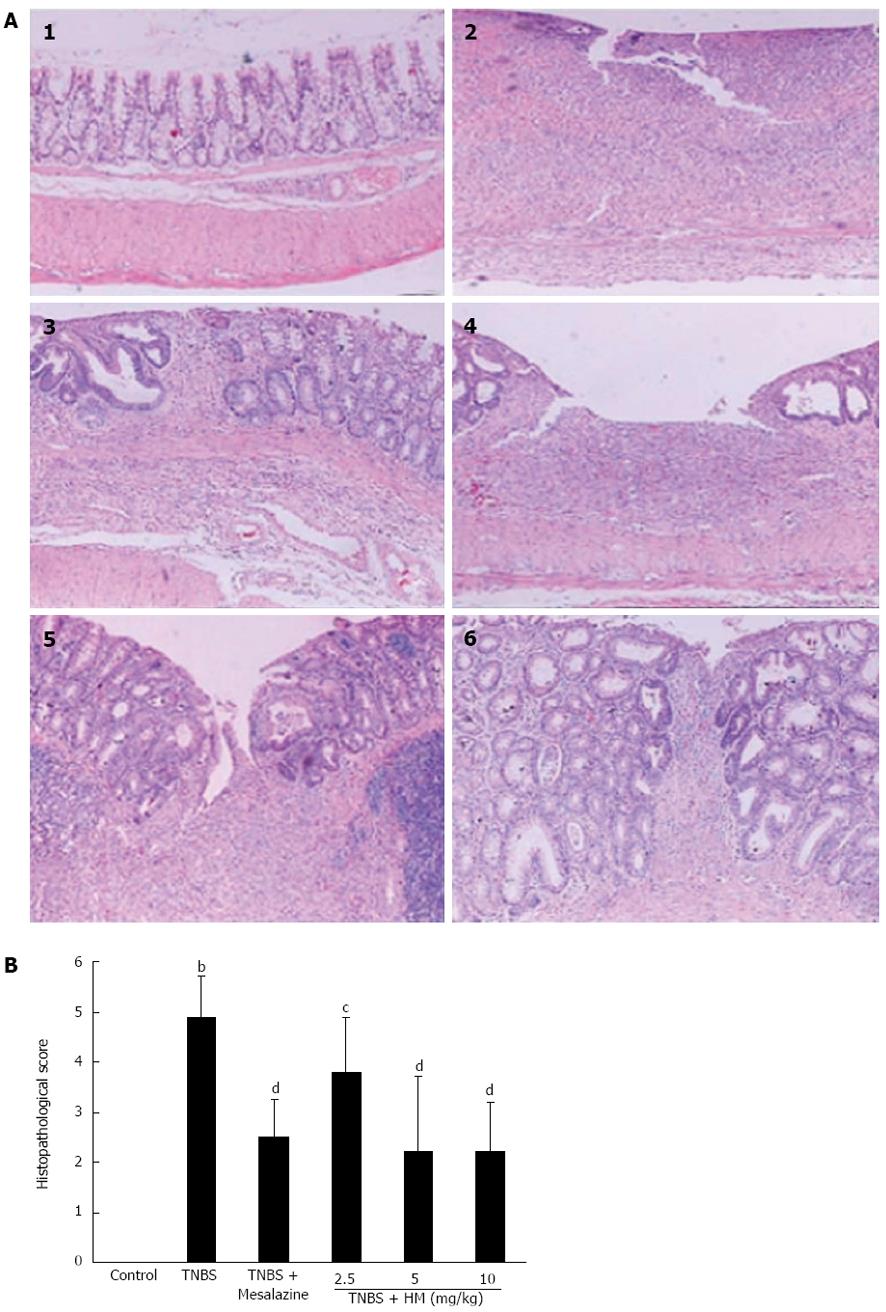
Figure 3 Hydroxynaphthoquinone mixture prevents 2,4,6-trinitrobenzene sulfonic acid-induced histopathological changes.
A: Intestinal histopathological features; B: Pathological scores of representative colonic samples of each group. Colitis was induced by intracolonic administration of TNBS (80 mg/kg, dissolved in 50% ethanol). Rats were treated daily for 7 d with HM (2.5, 5, 10 mg/kg) and mesalazine 100 mg/kg 24 h after TNBS instillation. Histopathological analysis was performed in HE-stained sections of colons. 1: Control; 2: Rat treated with TNBS alone; 3: Rat treated with TNBS and mesalazine; 4-6: Rats treated with TNBS and HM (2.5, 5, 10 mg/kg). Data are represented as mean ± SD of 5 animals of each group. bP < 0.01 vs control; cP < 0.05, dP < 0.01 vs TNBS alone. HM: Hydroxynaphthoquinone mixture (original magnification, × 100); TNBS: 2,4,6-trinitrobenzene sulfonic acid.
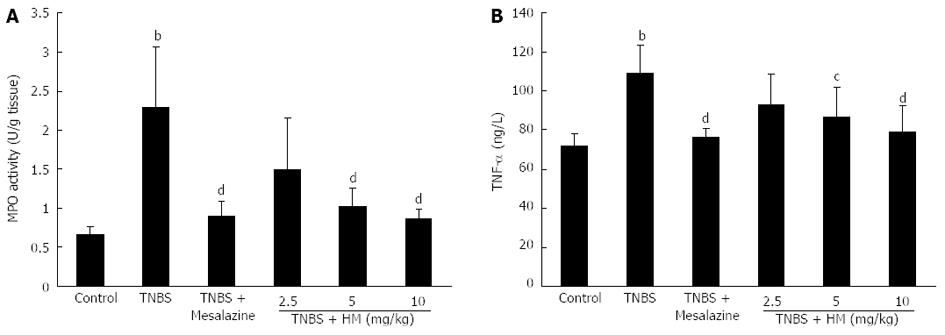
Figure 4 Hydroxynaphthoquinone mixture decreases myeloperoxidase activity (A) and serum tumor necrosis factor-α level (B) in rats with 2,4,6-trinitrobenzene sulfonic acid-induced colitis.
Colitis was induced by intracolonic administration of TNBS (80 mg/kg, dissolved in 50% ethanol). Rats were treated daily for 7 d with HM (2.5, 5, 10 mg/kg) and mesalazine 100 mg/kg 24 h after TNBS instillation. TNF-α level was determined by ELISA. Data are represented as mean ± SD of 8 animals of each group. bP < 0.01 vs control; cP < 0.05, dP < 0.01 vs TNBS alone. HM: Hydroxynaphthoquinone mixture; TNBS: 2,4,6-trinitrobenzene sulfonic acid; MPO: Myeloperoxidase; TNF-α: Tumor necrosis factor-α.
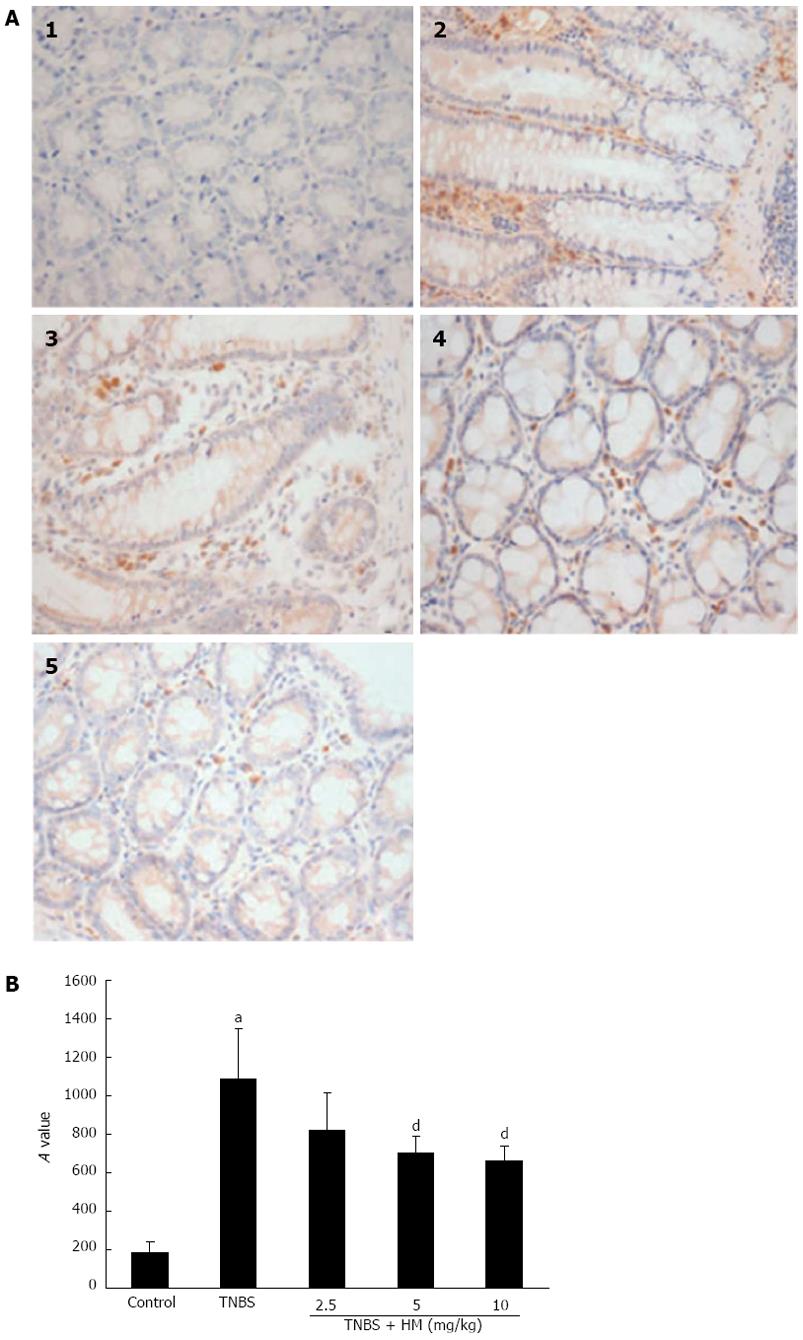
Figure 5 Immunostaining for tumor necrosis factor-α.
A: Immunostaining sections; B: Integrated optical density (A) values of representative colonic samples of each group. Colitis was induced by intracolonic administration of TNBS (80 mg/kg, dissolved in 50% ethanol). Rats were treated daily for 7 d with HM (2.5, 5, 10 mg/kg) 24 h after TNBS instillation. Colons were excised and stained with anti-TNF-α antibody. 1: Control; 2: Rat treated with TNBS alone; 3-5: Rats treated with TNBS plus HM (2.5, 5, 10 mg/kg). Data are represented as mean ± SD of 4 animals of each group. aP < 0.05 vs control; dP < 0.01 vs TNBS alone. HM: Hydroxynaphthoquinone mixture (original magnification, × 400); TNBS: 2,4,6-trinitrobenzene sulfonic acid; TNF-α: Tumor necrosis factor-α.
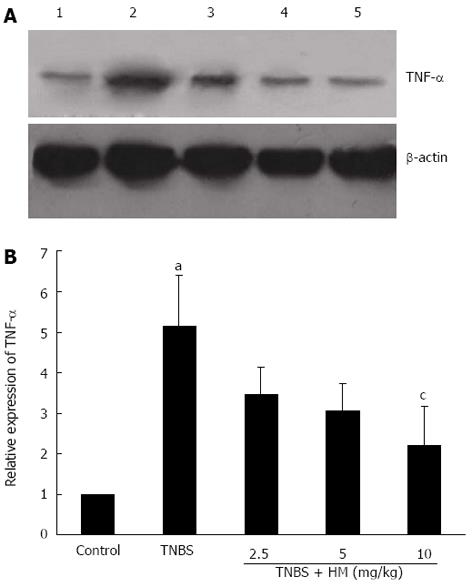
Figure 6 Hydroxynaphthoquinone mixture decreases tumor necrosis factor-α expression in colonic tissue of rats with 2,4,6-trinitrobenzene sulfonic acid-induced colitis.
A: Tumor necrosis factor (TNF)-α protein bands; B: Integrated optical density (A) values of protein bands. Colitis was induced by intracolonic administration of TNBS (80 mg/kg, dissolved in 50% ethanol). Rats were treated daily for 7 d with HM (2.5, 5, 10 mg/kg) 24 h after TNBS instillation. Protein extracts were obtained from colons and TNF-α expression level was detected by Western blotting analysis. Lane 1: Controls; lane 2: Rats treated with TNBS alone; lane 3-5: Rats treated with TNBS plus HM (2.5, 5, 10 mg/kg). Data are represented as mean ± SD of 4 animals of each group. aP < 0.05 vs control; cP < 0.05 vs TNBS alone. HM: Hydroxynaphthoquinone mixture; TNBS: 2,4,6-trinitrobenzene sulfonic acid.
-
Citation: Fan HY, Zhang ZL, Liu K, Yang MY, Lv WH, Che X, Xu H, Song WW. Effectiveness of a hydroxynaphthoquinone fraction from
Arnebia euchroma in rats with experimental colitis. World J Gastroenterol 2013; 19(48): 9318-9327 - URL: https://www.wjgnet.com/1007-9327/full/v19/i48/9318.htm
- DOI: https://dx.doi.org/10.3748/wjg.v19.i48.9318


