Copyright
©2013 Baishideng Publishing Group Co.
World J Gastroenterol. Nov 28, 2013; 19(44): 8011-8019
Published online Nov 28, 2013. doi: 10.3748/wjg.v19.i44.8011
Published online Nov 28, 2013. doi: 10.3748/wjg.v19.i44.8011
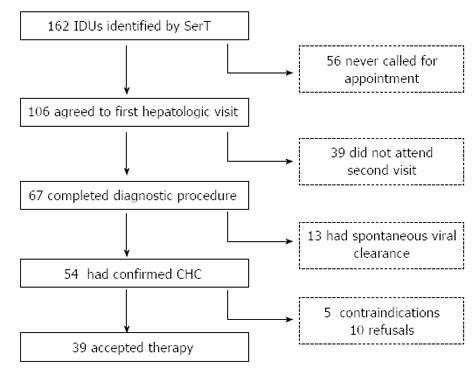
Figure 1 Patient disposition according to the study protocol.
CHC: Chronic hepatitis C; IDU: Illicit drug user; SerT: Territorial Addiction Service.
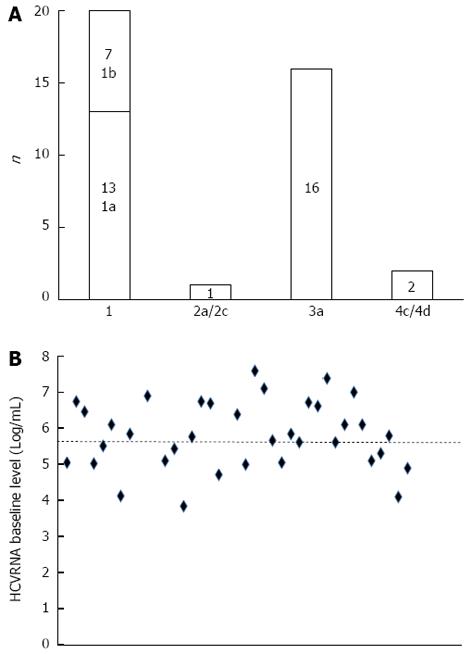
Figure 2 Hepatitis C virus genotypes (A) and baseline hepatitis C virus RNA levels (B) in 36 patients (the dotted line indicates the 5.
6 Log/mL cut-off value for high viral load).
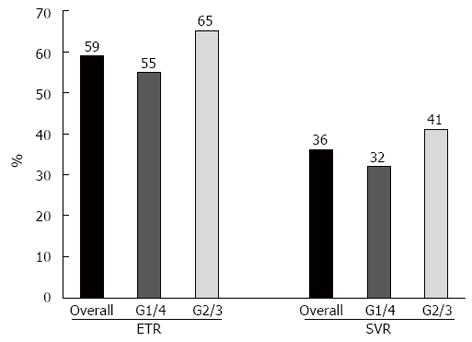
Figure 3 Percentage of end of treatment responses and sustained virologic responses in the entire cohort and according to Hepatitis C virus genotype (G).
ETR: End of treatment response; SVR: Sustained virologic response.
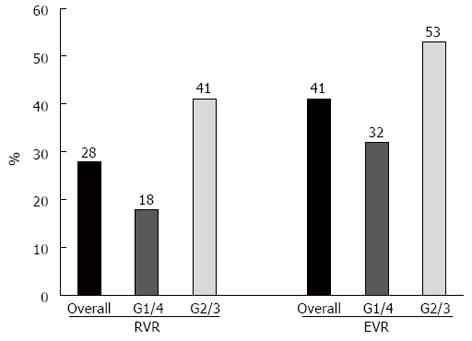
Figure 4 Percentage of rapid virologic responses and early virologic responses in the entire cohort and according to Hepatitis C virus genotype (G).
RVR: Rapid virologic response; EVR: Early virologic response.
- Citation: Zanini B, Benini F, Pigozzi MG, Furba P, Giacò E, Cinquegrana A, Fasoli M, Lanzini A. Addicts with chronic hepatitis C: Difficult to reach, manage or treat? World J Gastroenterol 2013; 19(44): 8011-8019
- URL: https://www.wjgnet.com/1007-9327/full/v19/i44/8011.htm
- DOI: https://dx.doi.org/10.3748/wjg.v19.i44.8011


