Copyright
©2013 Baishideng Publishing Group Co.
World J Gastroenterol. Nov 21, 2013; 19(43): 7795-7803
Published online Nov 21, 2013. doi: 10.3748/wjg.v19.i43.7795
Published online Nov 21, 2013. doi: 10.3748/wjg.v19.i43.7795
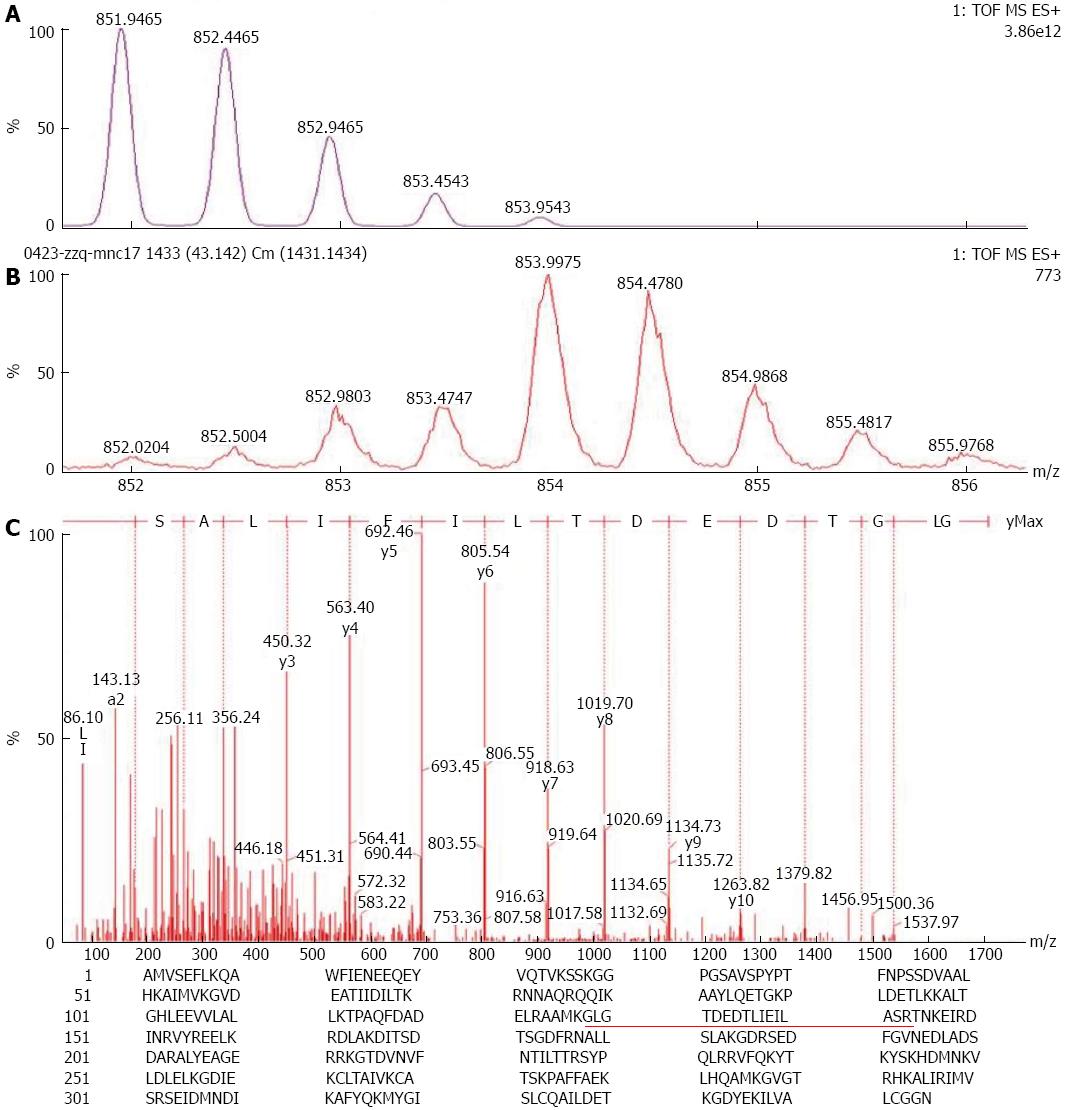
Figure 1 Mass spectrum of the isotopic distribution patterns of Annexin A1 (GLGTDEDTLIEILASR) and ESI-Q-TOF-MS analysis results.
A: Theoretical isotopic distribution patterns (M0, relative abundance of theoretical monoisotopic peaks, M2, relative abundance of theoretical 2 Da monoisotopic peaks; M4, relative abundance of theoretical 4Da-monoisotopic peaks); B: Isotopic distribution patterns after 18O labelling, I0, actual detected relative abundance of theoretical monoisotopic peaks,I2, actual detected relative abundance of theoretical 2Da-monoisotopic peaks; I4, actual detected relative abundance of theoretical 4Da-monoisotopic peaks; C: Amino acid sequence at m/z 854.00 was identified as GLGTDEDTLIEILASR; D: Protein sequence of Annexin A1 (ANXA1) showing the underlined MS/MS fragment matched the 128-143 amino acid residues of ANXA1.
Figure 2 Expression of Annexin A1 protein in gastric adenocarcinoma cells and normal gastric epithelial cells by western blot analysis.
T: Gastric adenocarcinoma cells; N: Normal gastric epithelial cells.
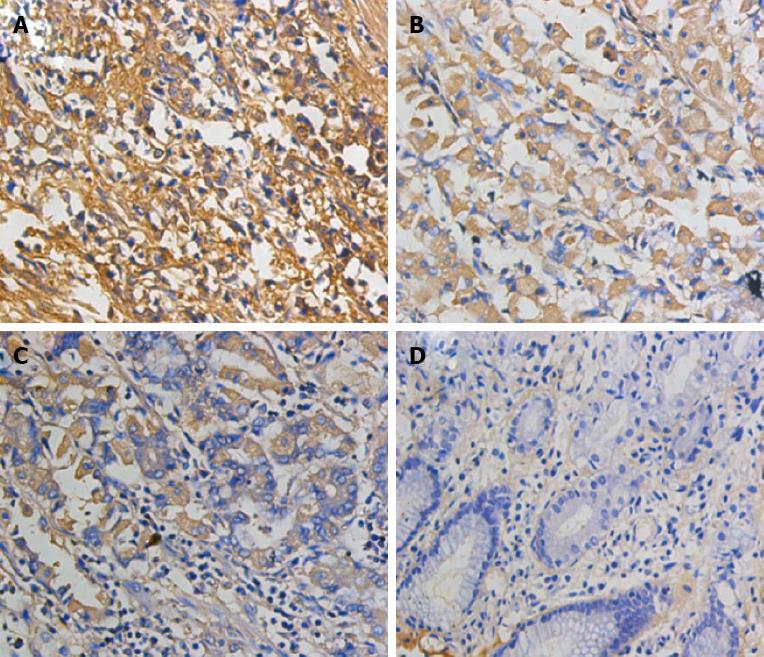
Figure 3 Representative immunohistochemical staining patterns of Annexin A1 expression in gastric carcinoma and normal gastric mucosa.
A: Strongly positive staining; B: Moderately positive staining; C: Weakly positive staining; D: Negative staining (immunohistochemical staining × 400).
- Citation: Zhang ZQ, Li XJ, Liu GT, Xia Y, Zhang XY, Wen H. Identification of Annexin A1 protein expression in human gastric adenocarcinoma using proteomics and tissue microarray. World J Gastroenterol 2013; 19(43): 7795-7803
- URL: https://www.wjgnet.com/1007-9327/full/v19/i43/7795.htm
- DOI: https://dx.doi.org/10.3748/wjg.v19.i43.7795


