Copyright
©2013 Baishideng Publishing Group Co.
World J Gastroenterol. Nov 21, 2013; 19(43): 7711-7718
Published online Nov 21, 2013. doi: 10.3748/wjg.v19.i43.7711
Published online Nov 21, 2013. doi: 10.3748/wjg.v19.i43.7711
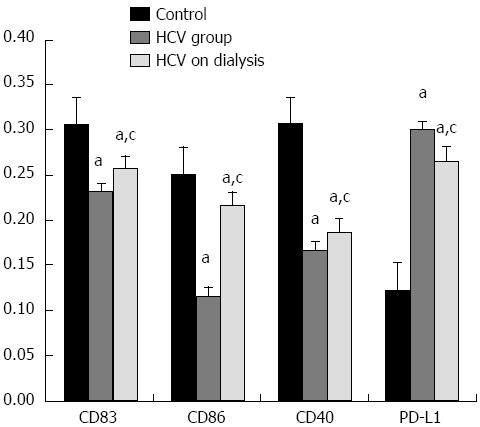
Figure 1 Relative quantitative gene expression of CD83, CD86, CD40 and PD-L1 in all study subjects expressed as mean ± SD.
aP < 0.05 in both hepatitis C virus (HCV) patient groups vs control group; cP < 0.05 in the HCV patient group vs HCV uremic patients on hemodialysis.
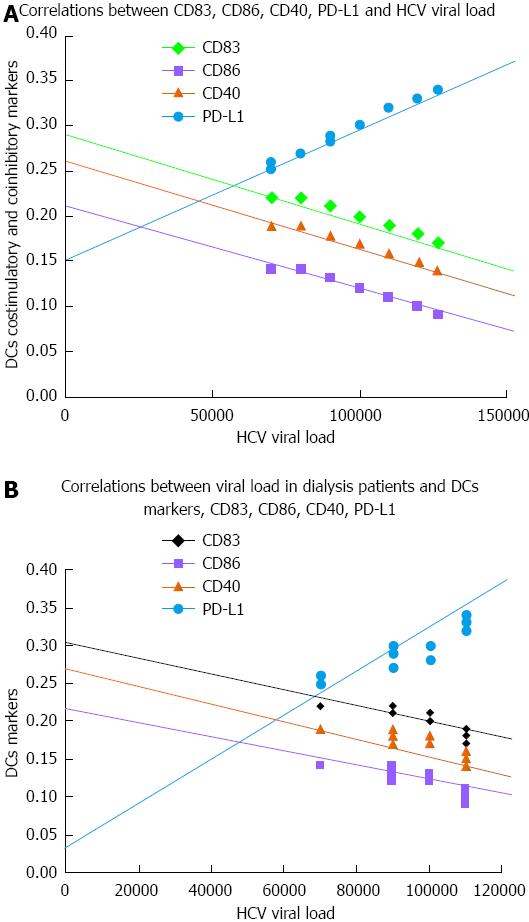
Figure 2 Correlations.
A: Between hepatitis C viremia and CD83. r = -0.98, P < 0.001, CD86: r = -0.866, P < 0.001, CD40: r = -0.98, P < 0.001, PD-L1: r = 0.889, P < 0.001; B: Between hepatitis C viremia in uremic patients on hemodialysis and CD83. r = -0.096, P > 0.05 NS, CD86: r = -0.588, P < 0.05, CD40: r = -0.946, P < 0.001, PD-L1: r = 0.663, P < 0.05. HCV: Hepatitis C virus; DC: Dendritic cell
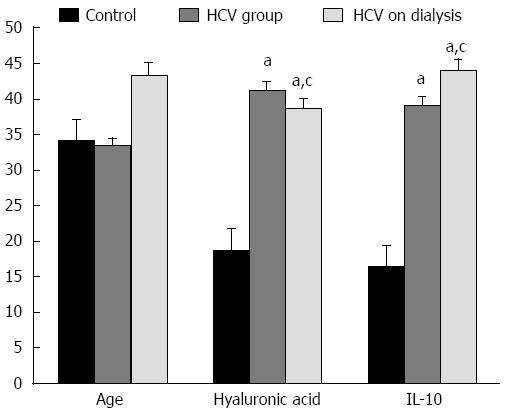
Figure 3 Serum levels of hyaluronic acid (ng/mL) and interleukin-10 (pg/mL) in all study subjects expressed as mean ± SD.
aP < 0.05 vs control group, cP < 0.05 in the hepatitis C virus (HCV) patient group vs HCV uremic patients on hemodialysis. IL-10: Interleukin-10.
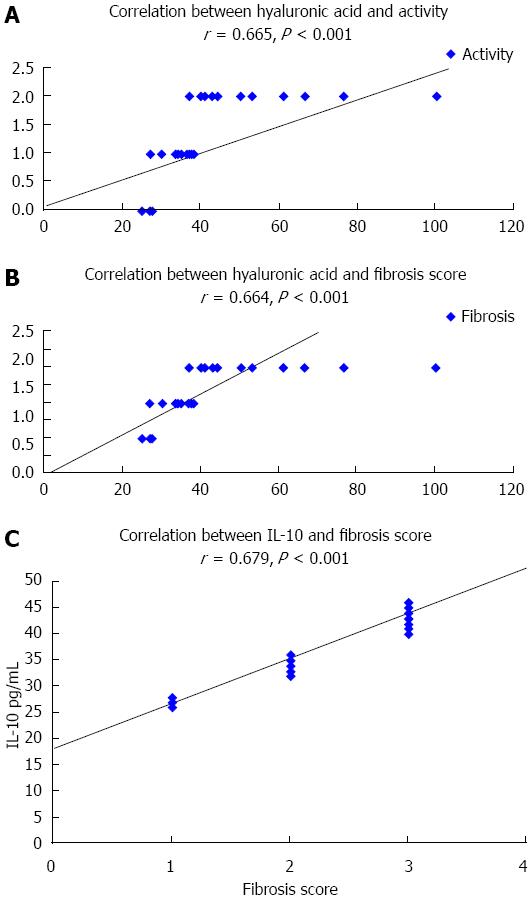
Figure 4 Correlation analysis.
A: Between hyaluronic acid levels and hepatitis activity score (P < 0.001); B: Between hyaluronic acid levels and fibrosis score (P < 0.001); C: Between interleukin-10 (IL-10) levels and fibrosis score (P < 0.001).
- Citation: Fouad H, Raziky MSE, Aziz RAA, Sabry D, Aziz GMA, Ewais M, Sayed AR. Dendritic cell co-stimulatory and co-inhibitory markers in chronic HCV: An Egyptian study. World J Gastroenterol 2013; 19(43): 7711-7718
- URL: https://www.wjgnet.com/1007-9327/full/v19/i43/7711.htm
- DOI: https://dx.doi.org/10.3748/wjg.v19.i43.7711


