Copyright
©2013 Baishideng Publishing Group Co.
World J Gastroenterol. Nov 21, 2013; 19(43): 7603-7619
Published online Nov 21, 2013. doi: 10.3748/wjg.v19.i43.7603
Published online Nov 21, 2013. doi: 10.3748/wjg.v19.i43.7603
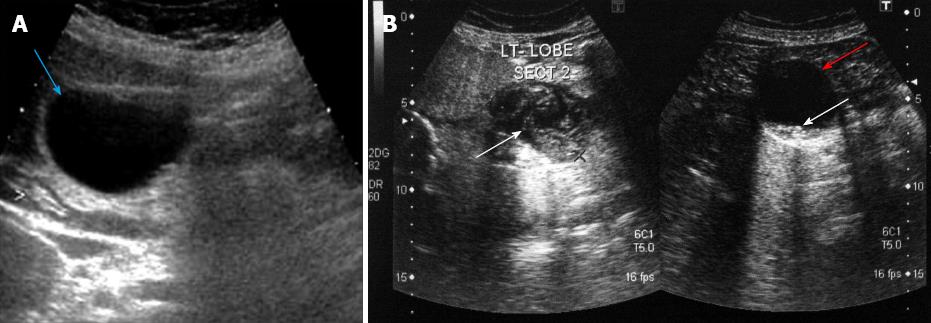
Figure 1 Ultrasound image.
A: Showing an anechoic mass in the liver (light blue arrow), with a rather thin capsule (cystadenoma); B: Showing two echinococcal cysts. The first on the right (red arrow-right image) appears as an anechoic mass with hydatid sand (type CE1) (white arrow-right image), while in the second (on the left), the detached and folded endocyst membrane is obvious (type CE3) (white arrow-left image).
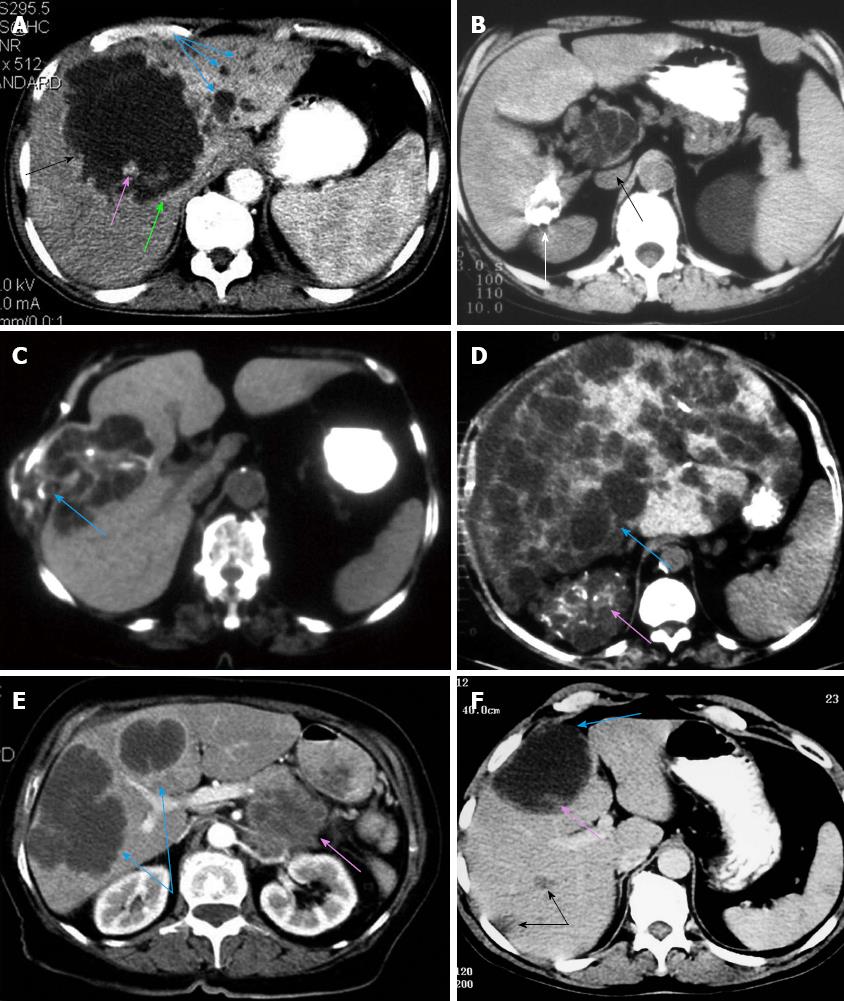
Figure 2 Computed tomography image.
A: In liver segment IV there is a large cystic lesion (black arrow) causing compression with dilatation of biliary ducts (light blue arrows) in the left liver lobe. Peripheral contrast enhancement (light green arrow) as well as a nodule (pink arrow) is evident in this case of cystadenoma; B: Echinococcal disease evaluated. Two lesions are evident. The first in liver segment I appears as a multilocular cystic lesion (black arrow) and the second in liver segment VI as a calcified mass with irregular margins (white arrow); C: Demonstrates direct infiltration of a liver hydatid cyst in the adjacent peritoneal surface and abdominal wall (light blue arrow); D: A typical case of multicystic disease with liver (light blue arrow) and kidney (pink arrow) involvement were very well depicted; E: Showing two large cystic-appearing liver lesions (light blue arrows) in a case of a metastatic pancreatic cystadenocarcinoma that is also evident (pink arrow); F: A large cystic lesion (light blue arrow) with a small solid component at the periphery (pink arrow), as well as two small hypodense liver lesions (black arrows), are seen on this image, in a case of proven gastrointestinal stromal tumors metastatic lesions.
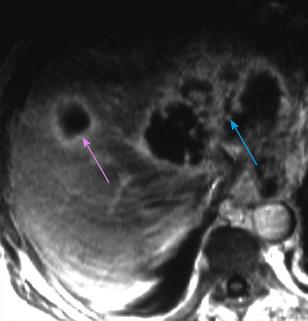
Figure 3 Magnetic resonance T1-w image shows an echinococcal cyst as a multiloculated cystic liver lesion, indicative of the presence of daughter cysts (light blue arrow).
A second smaller unilocular lesion with peripheral contrast enhancement is also seen (pink arrow).
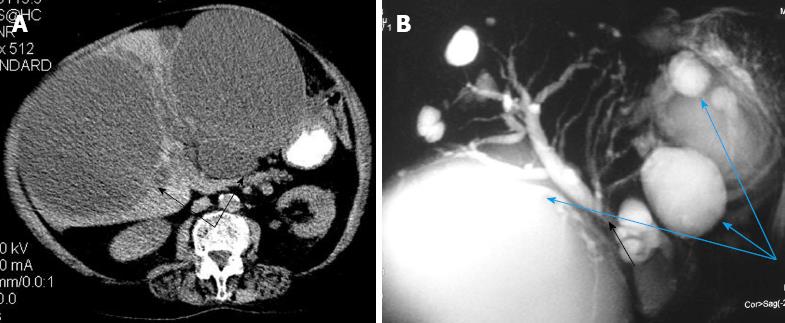
Figure 4 Image.
A: Computed tomography image in a case of multicystic disease, showing two large dominant cysts causing mild intrahepatic biliary dilatation (black arrows); B: Magnetic resonance cholangiopancreatography image shows multiple hepatic cysts (light blue arrows) while the common bile duct seems compressed between the two larger cysts (black arrow).
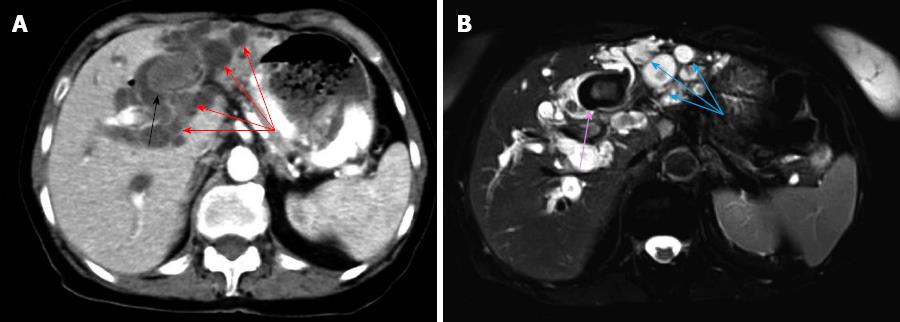
Figure 5 A case of Caroli disease.
A: On computed tomography. A large intra-biliary stone (black arrow) is evident in the dilated ducts (red arrows); B: On magnetic resonance imaging. A large intra-biliary stone (pink arrow) is evident in the dilated ducts (blue arrows).
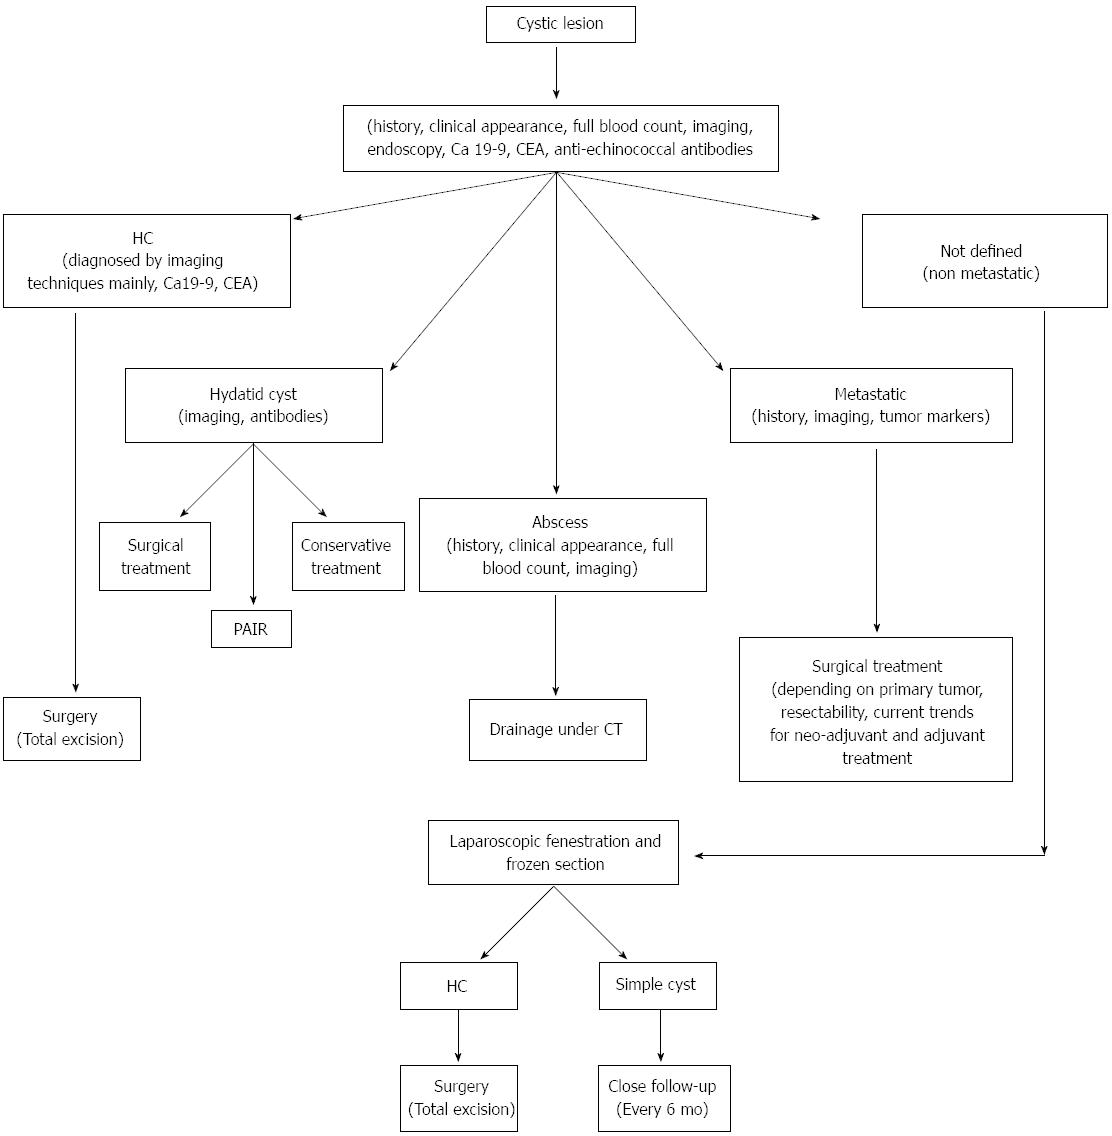
Figure 6 Liver cystic lesions management algorithm.
- Citation: Bakoyiannis A, Delis S, Triantopoulou C, Dervenis C. Rare cystic liver lesions: A diagnostic and managing challenge. World J Gastroenterol 2013; 19(43): 7603-7619
- URL: https://www.wjgnet.com/1007-9327/full/v19/i43/7603.htm
- DOI: https://dx.doi.org/10.3748/wjg.v19.i43.7603


