Copyright
©2013 Baishideng Publishing Group Co.
World J Gastroenterol. Nov 7, 2013; 19(41): 7189-7196
Published online Nov 7, 2013. doi: 10.3748/wjg.v19.i41.7189
Published online Nov 7, 2013. doi: 10.3748/wjg.v19.i41.7189
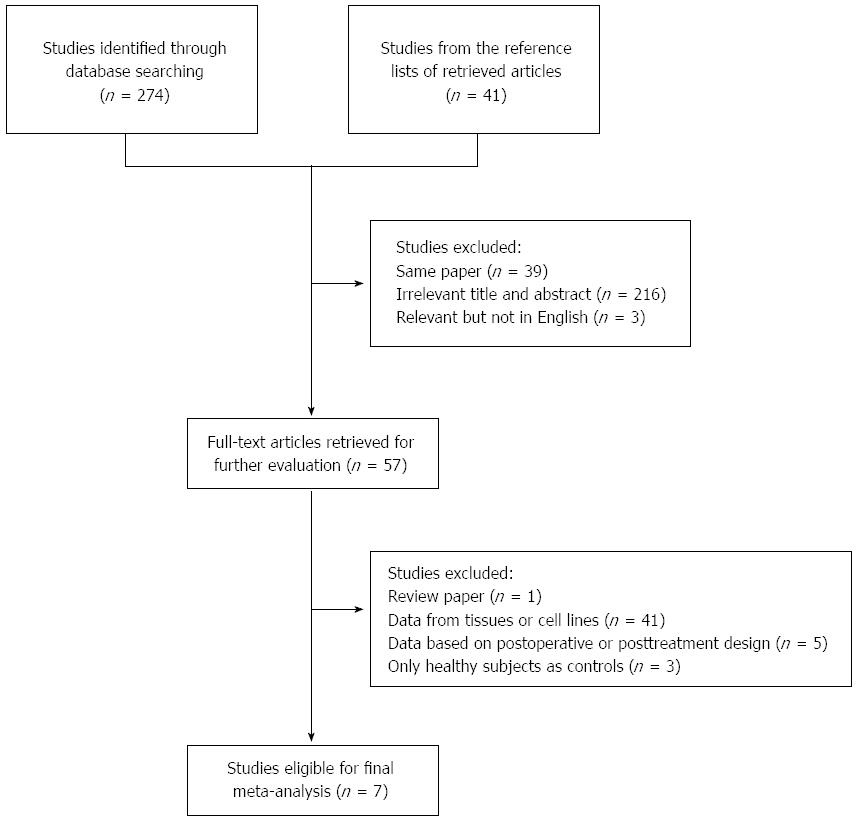
Figure 1 Flowchart of study selection.
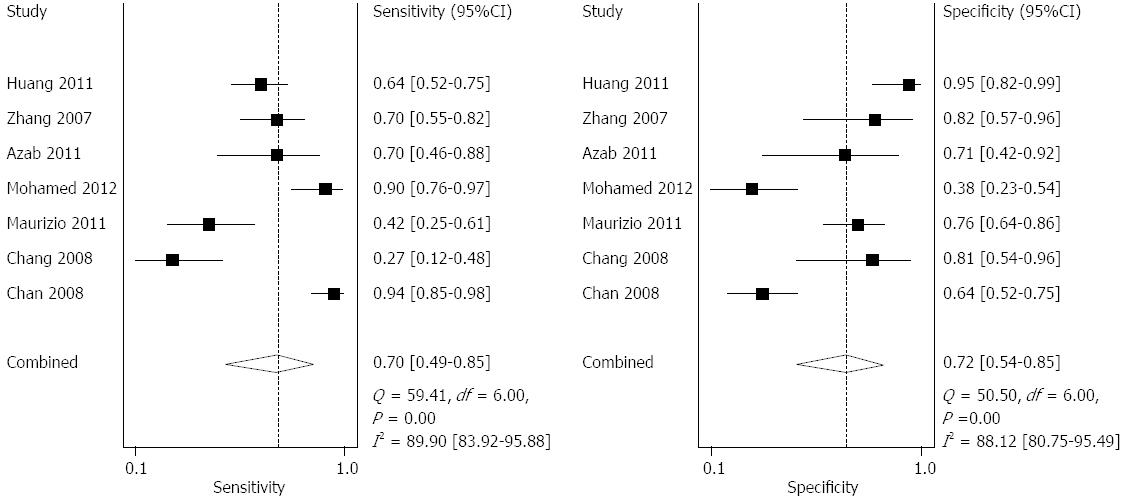
Figure 2 Coupled forest plot showing the sensitivity and specificity of Ras association domain family 1A methylation in diagnosis of hepatocellular carcinoma.
Forest plots document estimates of sensitivity and specificity for each study together with 95%CIs. The point estimates of sensitivity and specificity from each study are shown as solid squares.
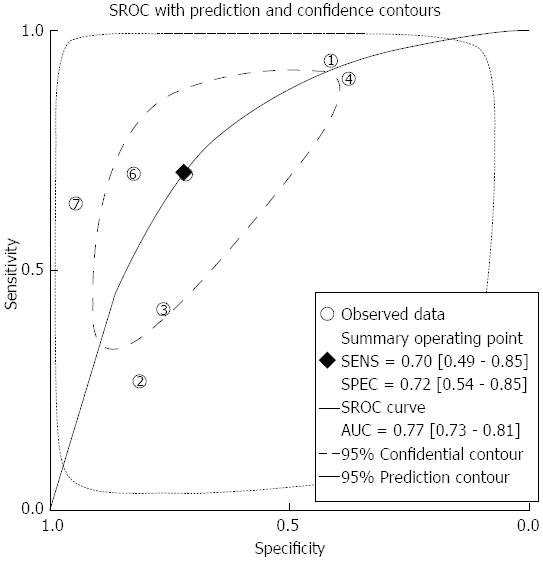
Figure 3 Summary receiver operation characteristic curve for Ras association domain family 1A methylation assays.
Hollow numbered circles represent included studies. Summary receiver operation characteristic (SROC) curve summarizes the overall diagnostic accuracy.
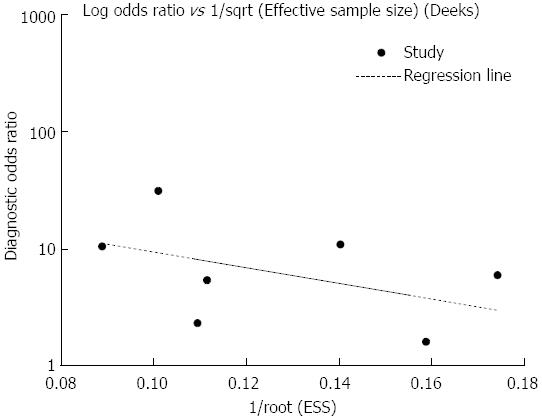
Figure 4 Assessment of the potential publication bias in Ras association domain family 1A methylation detection.
We found no significant publication bias (P > 0.05). Each spot represents one study and the regression line is shown.
- Citation: Zhao ZH, Fan YC, Yang Y, Wang K. Association between Ras association domain family 1A promoter methylation and hepatocellular carcinoma: A meta-analysis. World J Gastroenterol 2013; 19(41): 7189-7196
- URL: https://www.wjgnet.com/1007-9327/full/v19/i41/7189.htm
- DOI: https://dx.doi.org/10.3748/wjg.v19.i41.7189


