Copyright
©2013 Baishideng Publishing Group Co.
World J Gastroenterol. Sep 21, 2013; 19(35): 5775-5786
Published online Sep 21, 2013. doi: 10.3748/wjg.v19.i35.5775
Published online Sep 21, 2013. doi: 10.3748/wjg.v19.i35.5775
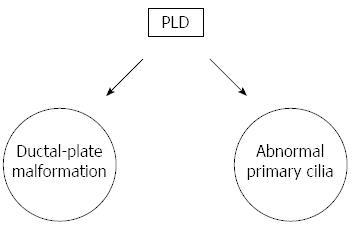
Figure 1 Pathophysiology of polycystic liver disease.
PLD: Polycystic liver disease.
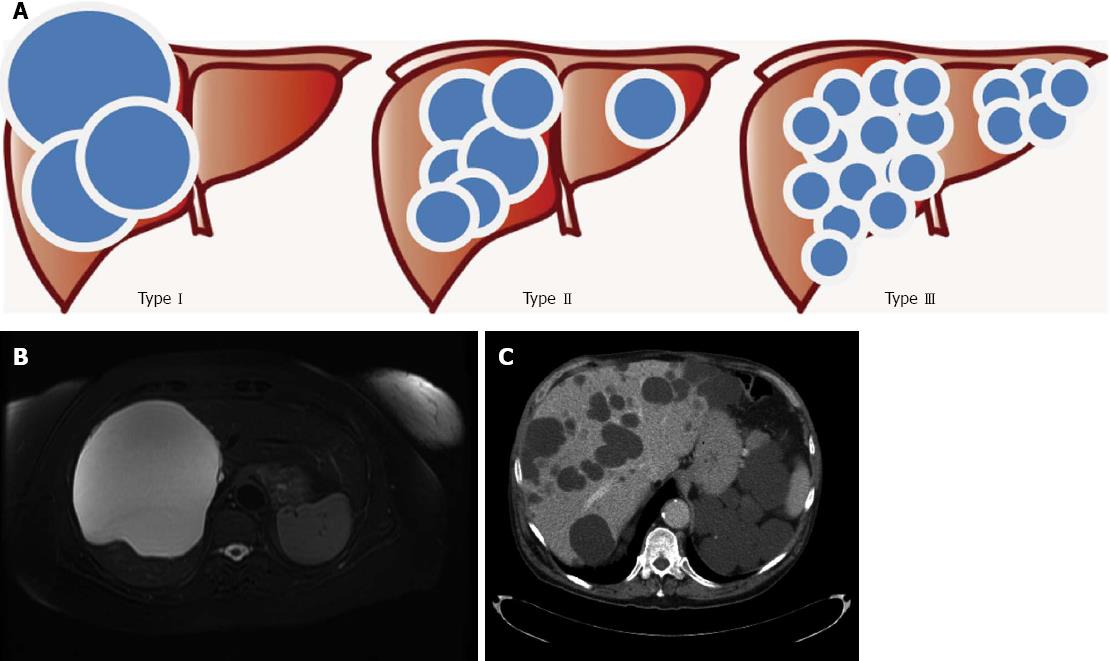
Figure 2 Gigot’s classification for polycystic liver diseases.
A: Graphical representation; B: Abdominal magnetic resonance imaging of a patient affected by Gigot I cystic liver disease; C: Abdominal computerized tomography of a patient affected by Gigot II cystic liver disease.
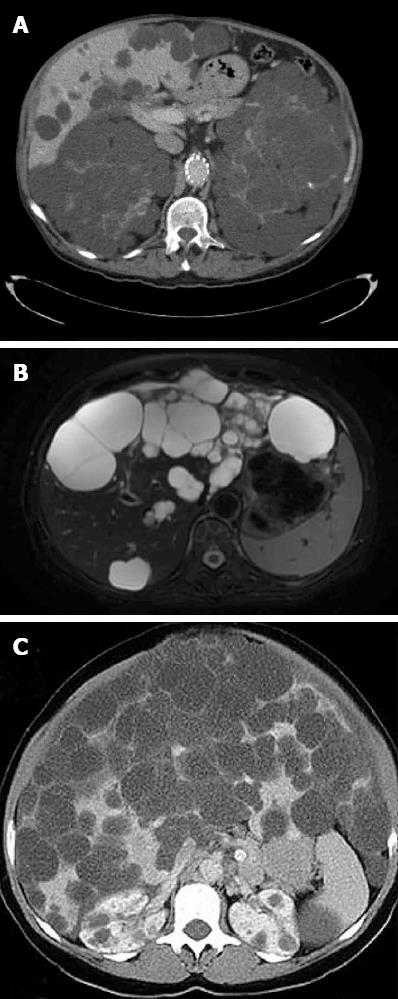
Figure 3 Gigot’s classification relies on imaging findings and was designed to identify the best candidates for fenestration of symptomatic cysts.
A: Intravenous contrast enhanced computerized tomography (CT) of a patient affected by polycystic liver and renal disease. The cysts appears hypoattenuating with smooth and regular walls; B: T2 magnetic resonance imaging of a patient with multiple hepatic cysts. The cystic fluid appears bright on T2 images; C: Abdominal CT of a patient affected by Gigot III cystic liver disease.
- Citation: Abu-Wasel B, Walsh C, Keough V, Molinari M. Pathophysiology, epidemiology, classification and treatment options for polycystic liver diseases. World J Gastroenterol 2013; 19(35): 5775-5786
- URL: https://www.wjgnet.com/1007-9327/full/v19/i35/5775.htm
- DOI: https://dx.doi.org/10.3748/wjg.v19.i35.5775


