Copyright
©2013 Baishideng Publishing Group Co.
World J Gastroenterol. Sep 14, 2013; 19(34): 5713-5719
Published online Sep 14, 2013. doi: 10.3748/wjg.v19.i34.5713
Published online Sep 14, 2013. doi: 10.3748/wjg.v19.i34.5713
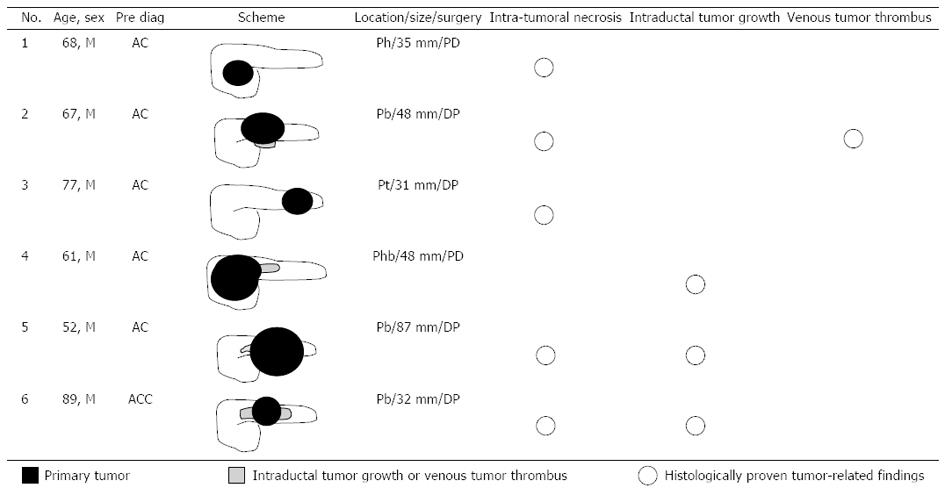
Figure 1 Clinicopathological findings of the acinar cell carcinomas.
M: Male; Pre Diag: Preoperative diagnosis; AC: Adenocarcinoma; ACC: Acinar cell carcinoma; Ph/b/t: Pancreatic head/body/tail; PD: Pancreaticoduodenectomy; DP: Distal pancreatectomy.
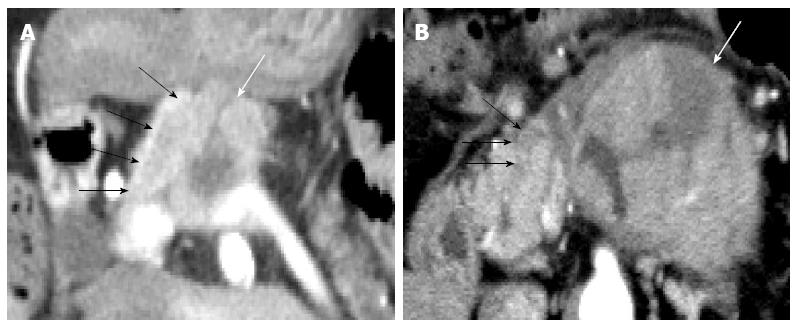
Figure 2 Acinar cell carcinomas with intraductal tumor growth.
A: Case 6, computed tomography (CT) showed the primary acinar cell carcinoma (ACC) in the pancreatic body (white arrow) and the easily recognizable widespread intraductal tumor growth (ITG) (black arrows); B: Case 5, CT shows the primary ACC in the pancreatic body (white arrow) and the small almost-unrecognizable ITG (black arrows).
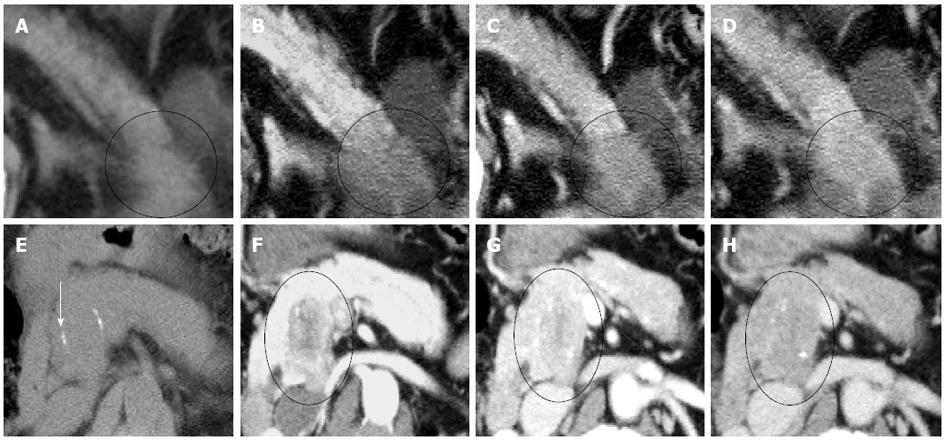
Figure 3 Visual patterns of the adenocarcinoma and the acinar cell carcinoma in the 4 phases.
A-D: Adenocarcinoma in the pancreatic tail (circle); The tumor was hypodense in all 4 phases (A: Non-contrast phase; B: Arterial phase; C: Portal venous phase; D: delayed phase). It showed a gradual enhancement pattern across the phases; E-H: Case 1, Acinar cell carcinoma in the pancreatic head (circle); The tumor was isodense and undetectable in the non-contrast phase, although calcification was identified (arrow) (E); It was hypodense in all 3 contrast-enhanced phases (F: Arterial phase; G: Portal venous phase; H: Delayed phase); Contrast enhancement was the strongest in the portal venous phase (G).
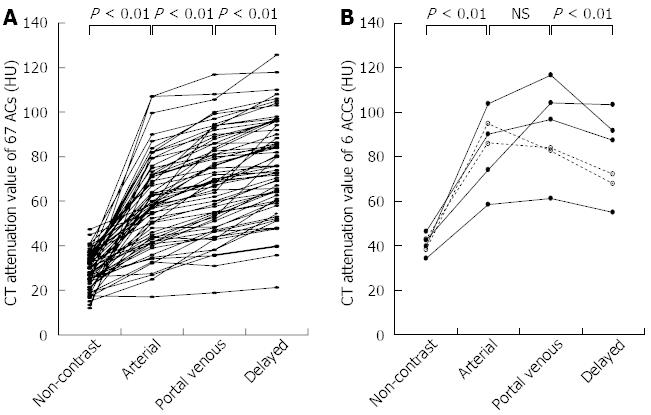
Figure 4 Time attenuation curve of the 67 adenocarcinomas (A) and 6 acinar cell carcinomas (B).
Peak enhancement is seen during the delayed phase for all 67 acinar cell carcinomas. Meanwhile, peak enhancement is seen during the portal venous phase for 4 acinar cell carcinomas (ACCs) and during the arterial phase for 2 ACCs. None of the 6 ACCs show peak enhancement during the delayed phase. AC: Adenocarcinomas; CT: Computed tomography; NS: Not significant.
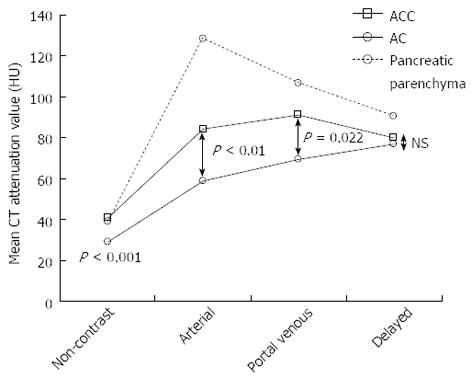
Figure 5 Mean computed tomography attenuation values of the tumors and the surrounding pancreatic parenchyma in the 4 phases.
In 3 phases (non-contrast, arterial, and portal venous phase), the computed tomography (CT) attenuation values of the acinar cell carcinomas (ACCs) were significantly higher than those of the adenocarcinomas (ACs). NS: Not significant.
- Citation: Sumiyoshi T, Shima Y, Okabayashi T, Kozuki A, Nakamura T. Comparison of pancreatic acinar cell carcinoma and adenocarcinoma using multidetector-row computed tomography. World J Gastroenterol 2013; 19(34): 5713-5719
- URL: https://www.wjgnet.com/1007-9327/full/v19/i34/5713.htm
- DOI: https://dx.doi.org/10.3748/wjg.v19.i34.5713


