©2013 Baishideng Publishing Group Co.
World J Gastroenterol. Aug 28, 2013; 19(32): 5365-5376
Published online Aug 28, 2013. doi: 10.3748/wjg.v19.i32.5365
Published online Aug 28, 2013. doi: 10.3748/wjg.v19.i32.5365
Figure 1 Flow chart of literature search strategies.
Figure 2 Meta-analysis.
A: The pooled data: operating time; B: The pooled data: intraoperative blood loss; C The pooled data: number of retrieved lymph nodes; D: The pooled data: duration of hospital stay; E: The pooled data: mortality; F: The pooled data: overall postoperative complications; G: The pooled data: surgical complications; H: The pooled data: medical complications; I: The pooled data: recurrences.
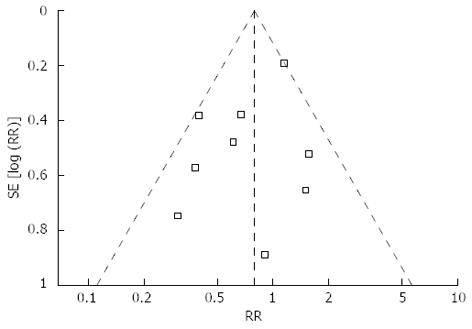
Figure 3 Funnel plot of the overall postoperative complications.
- Citation: Chen K, Xu XW, Zhang RC, Pan Y, Wu D, Mou YP. Systematic review and meta-analysis of laparoscopy-assisted and open total gastrectomy for gastric cancer. World J Gastroenterol 2013; 19(32): 5365-5376
- URL: https://www.wjgnet.com/1007-9327/full/v19/i32/5365.htm
- DOI: https://dx.doi.org/10.3748/wjg.v19.i32.5365


