©2013 Baishideng Publishing Group Co.
World J Gastroenterol. Jul 14, 2013; 19(26): 4234-4241
Published online Jul 14, 2013. doi: 10.3748/wjg.v19.i26.4234
Published online Jul 14, 2013. doi: 10.3748/wjg.v19.i26.4234
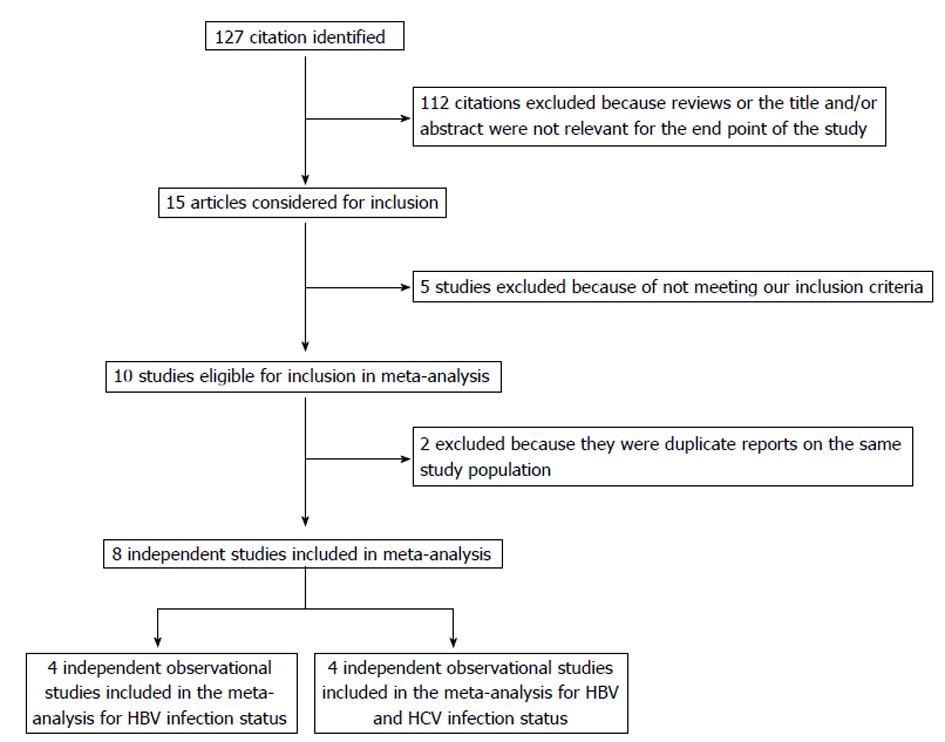
Figure 1 Flowchart of selection of studies for inclusion in meta-analysis.
HBV: Hepatitis B virus; HCV: Hepatitis C virus.
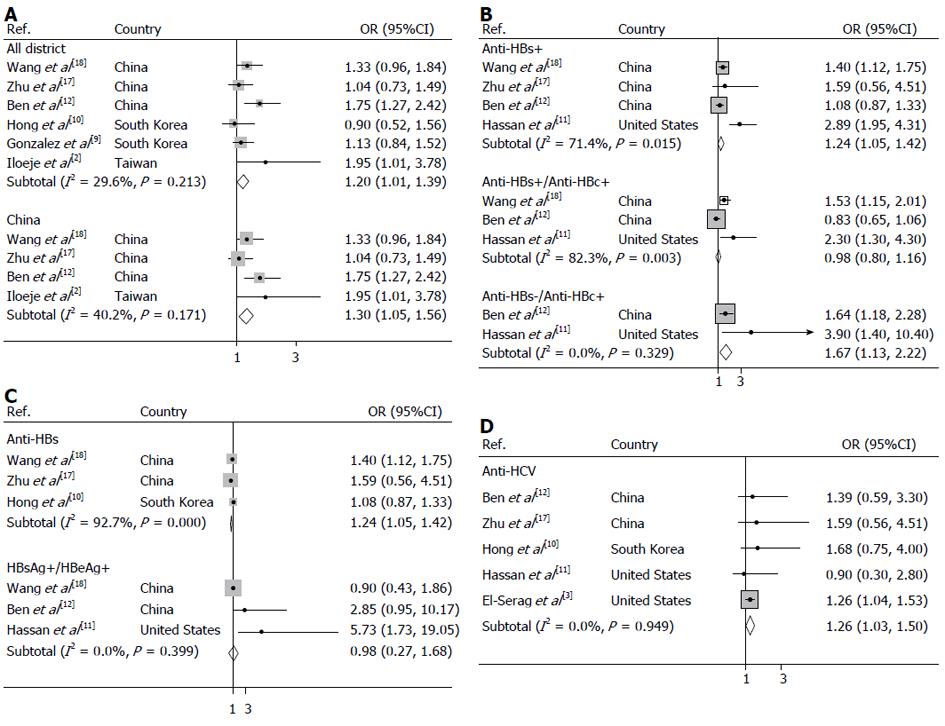
Figure 2 Forest plots of risk of pancreatic cancer.
A: Associated with chronic hepatitis B (HBsAg carrier state) around the world and Chinese population; B: Associated with anti-HBc status; C: Associated with active hepatitis B virus viral replication and anti-HBs status; D: Associated with hepatitis C virus infection.
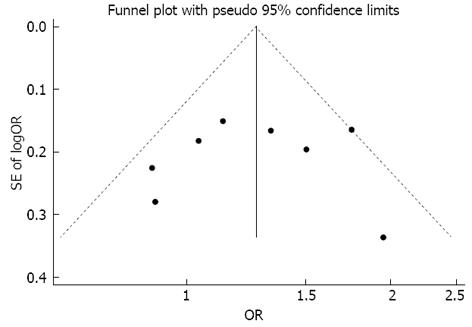
Figure 3 Begg’s funnel plot with 95% confidence limits to detect publication bias.
Each point represents a separate study for the indicated association.
- Citation: Xu JH, Fu JJ, Wang XL, Zhu JY, Ye XH, Chen SD. Hepatitis B or C viral infection and risk of pancreatic cancer: A meta-analysis of observational studies. World J Gastroenterol 2013; 19(26): 4234-4241
- URL: https://www.wjgnet.com/1007-9327/full/v19/i26/4234.htm
- DOI: https://dx.doi.org/10.3748/wjg.v19.i26.4234


