©2013 Baishideng Publishing Group Co.
World J Gastroenterol. Jul 14, 2013; 19(26): 4155-4165
Published online Jul 14, 2013. doi: 10.3748/wjg.v19.i26.4155
Published online Jul 14, 2013. doi: 10.3748/wjg.v19.i26.4155
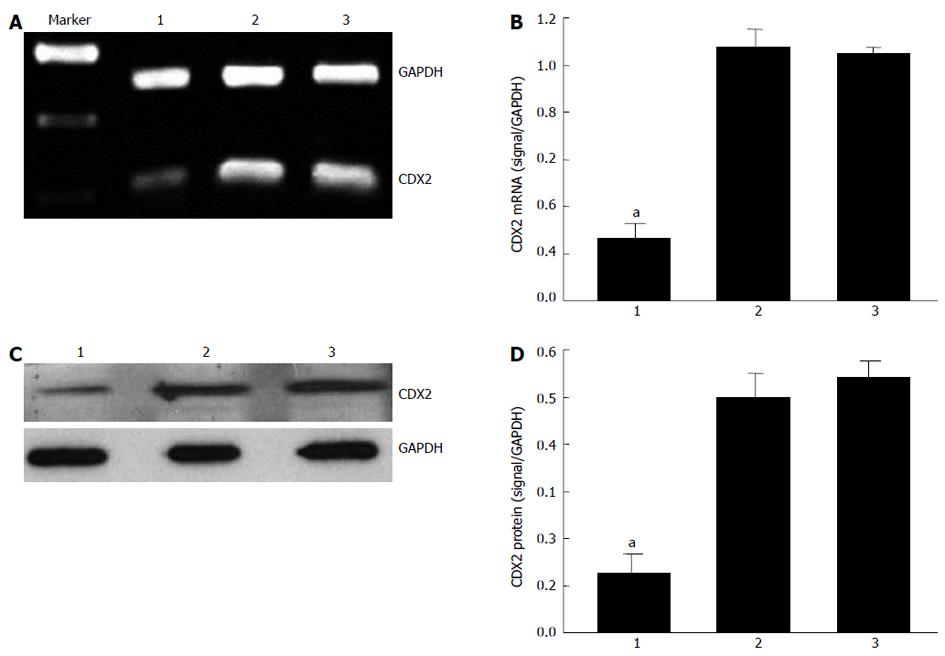
Figure 1 mRNA and protein expressions of CDX2 after RNA interference.
A, B: Expression level of CDX2 mRNA was determined by semiquantitative reverse-transcriptase polymerase chain reaction; C, D: Expression level of CDX2 protein was determined by Western blotting. mRNA results were expressed as the ratio of CDX2 to glyceraldehyde 3-phosphate dehydrogenase (GAPDH). Western blotting results were expressed as the ratio of optical density of CDX2 bands to GAPDH bands. All values are mean ± SE. aP < 0.05 for SGC7901/DDP + small interfering RNA (siRNA)-CDX2 cells vs SGC7901/DDP + siRNA-NC cells and SGC7901/DDP cells. Lane 1: SGC7901/DDP + siRNA-CDX2 cells; Lane 2: SGC7901/DDP + siRNA-NC cells; Lane 3: SGC7901/DDP cells.
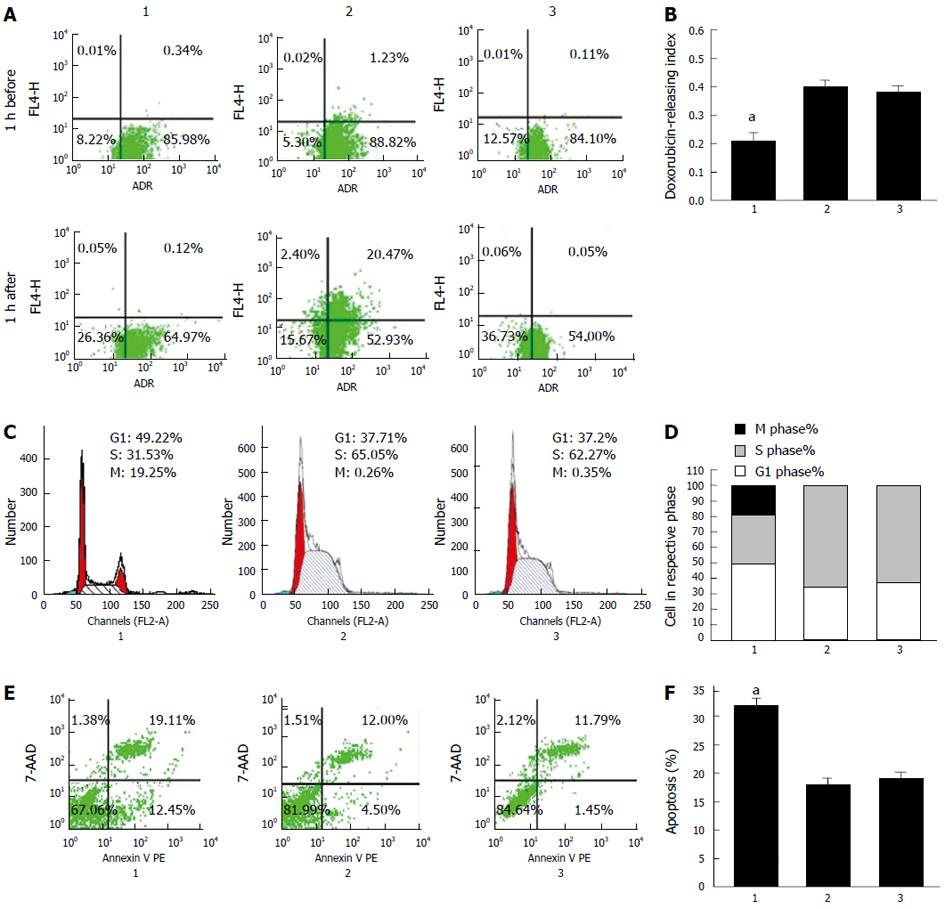
Figure 2 Effect of downregulation of CDX2 on cell pump rate of doxorubicin, cell cycle, and apoptotic rate in SGC7901/DDP cells after RNA interference.
A, B: Pump rate of doxorubicin in SGC7901/DDP cells after RNAi was analyzed by flow cytometry; C, D: Cell cycle in SGC7901/DDP cells after RNAi was analyzed by flow cytometry; E, F: Apoptotic rate in SGC7901/DDP cells after RNAi was analyzed by flow cytometry. aP < 0.05 for SGC7901/DDP + small interfering RNA (siRNA)-CDX2 cells vs SGC7901/DDP + siRNA-NC cells and SGC7901/DDP cells. Lane 1: SGC7901/DDP + siRNA-CDX2 cells; Lane 2: SGC7901/DDP + siRNA-NC cells; Lane 3: SGC7901/DDP cells.
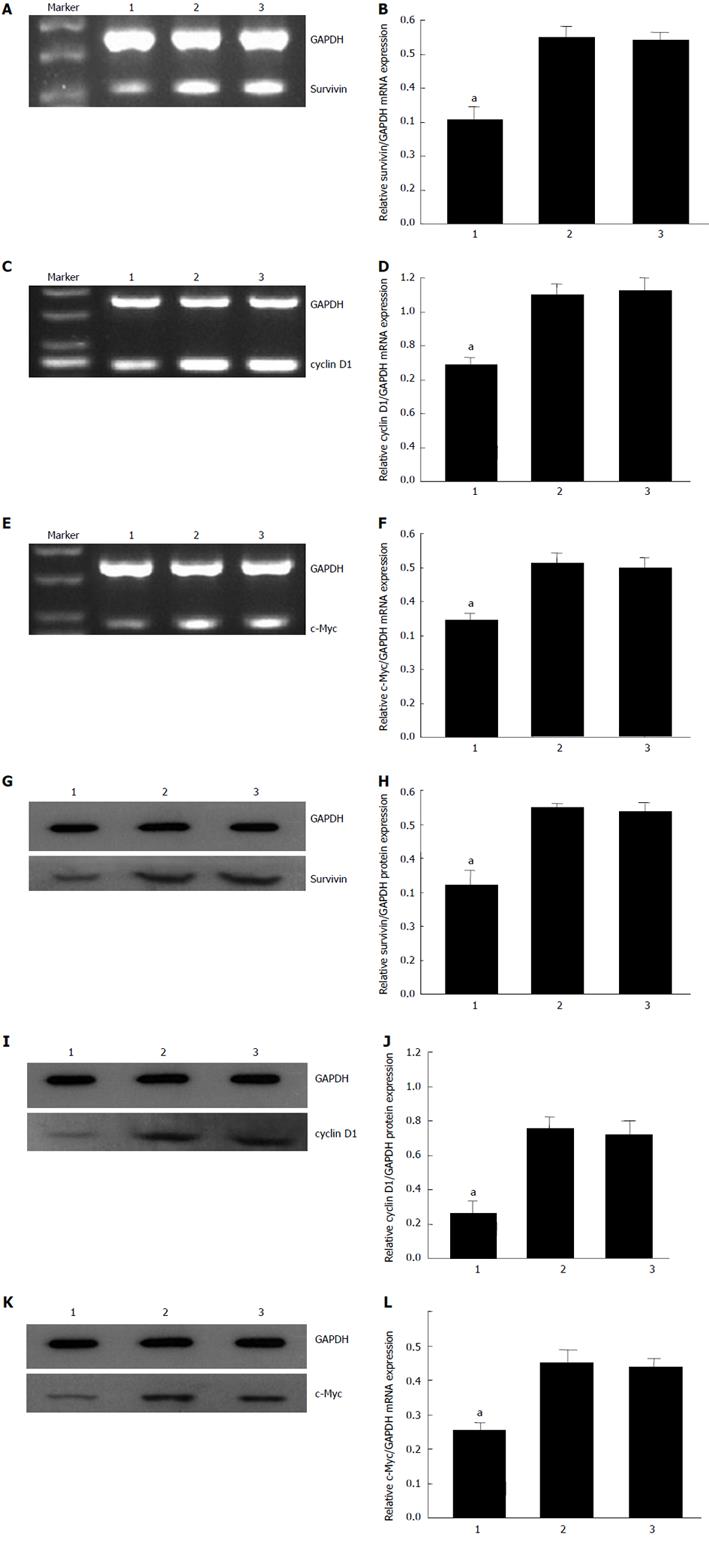
Figure 3 RNA interference-mediated inhibition of CDX2 decreased survivin, cyclin D1 and c-Myc mRNA and protein expression.
mRNA expression levels of survivin (A), cyclin D1 (C), and c-Myc (E) were determined by semiquantitative reverse-transcriptase polymerase chain reaction. Protein expression levels of survivin (G), cyclin D1 (I), and c-Myc (K) were determined by western blotting. mRNA results were expressed as the ratio of survivin (B), cyclin D1 (D), and c-Myc (F) to glyceraldehyde 3-phosphate dehydrogenase (GAPDH). Western blotting results are expressed as the ratio of optical density of survivin (H), cyclin D1 (J) and c-Myc (L) bands to GAPDH bands. All values are mean ± SE. aP < 0.05 for SGC7901/DDP + small interfering RNA (siRNA)-CDX2 cells vs SGC7901/DDP + siRNA-NC cells and SGC7901/DDP cells. Lane 1: SGC7901/DDP + siRNA-CDX2 cells; Lane 2: SGC7901/DDP + siRNA-NC cells; Lane 3: SGC7901/DDP cells.
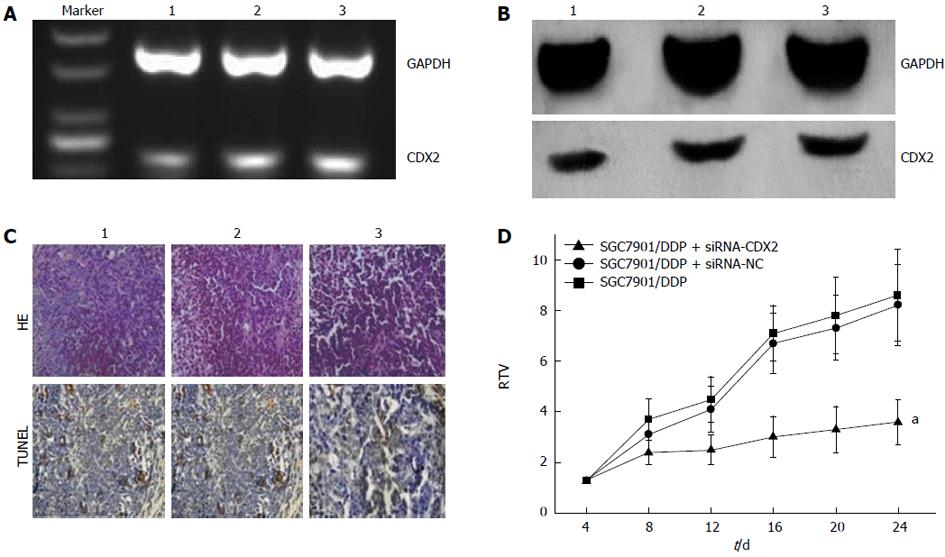
Figure 4 Effect of RNA interference-mediated inhibition of CDX2 mRNA and protein expression and downregulation of CDX2 on apoptosis in vivo.
A: mRNA expression level of CDX2 was determined by semiquantitative reverse-transcriptase polymerase chain reaction; B: Protein expression level of CDX2 was determined by western blotting; C: Tumor cell apoptosis was assessed by HE staining and TUNEL assay. CDX2 siRNA induced more apoptosis of tumor cells (× 400); D: Relative tumor volume (RTV) of nude mice in each group is presented. Each time point represents the mean RTV for each group. RTV in the SGC7901/DDP + small interfering RNA (siRNA)-CDX2 group was smaller than that in control animals. aP < 0.05 for SGC7901/DDP + siRNA-CDX2 cells vs SGC7901/DDP + siRNA-NC cells and SGC7901/DDP cells. Lane 1: SGC7901/DDP + siRNA-CDX2 cells; Lane 2: SGC7901/DDP + siRNA-NC cells; Lane 3: SGC7901/DDP cells. GAPDH: Glyceraldehyde 3-phosphate dehydrogenase.
- Citation: Yan LH, Wang XT, Yang J, Lian C, Kong FB, Wei WY, Luo W, Xiao Q, Xie YB. Reversal of multidrug resistance in gastric cancer cells by CDX2 downregulation. World J Gastroenterol 2013; 19(26): 4155-4165
- URL: https://www.wjgnet.com/1007-9327/full/v19/i26/4155.htm
- DOI: https://dx.doi.org/10.3748/wjg.v19.i26.4155


