Copyright
©2013 Baishideng Publishing Group Co.
World J Gastroenterol. Jun 28, 2013; 19(24): 3770-3780
Published online Jun 28, 2013. doi: 10.3748/wjg.v19.i24.3770
Published online Jun 28, 2013. doi: 10.3748/wjg.v19.i24.3770
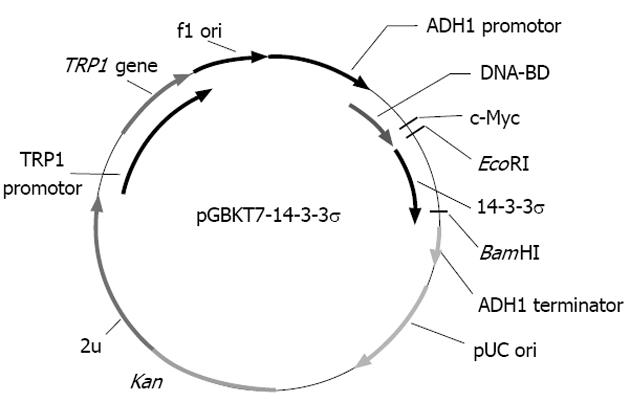
Figure 1 Map of bait plasmid pGBKT7-14-3-3.
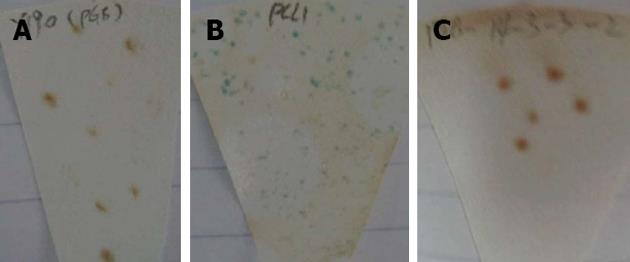
Figure 2 X-Gal filter assay analysis result.
A: Negative control plasmid pGBKT7; B: Positive control plasmid pCL1; C: pGBKT7-14-3-3σ plasmid.
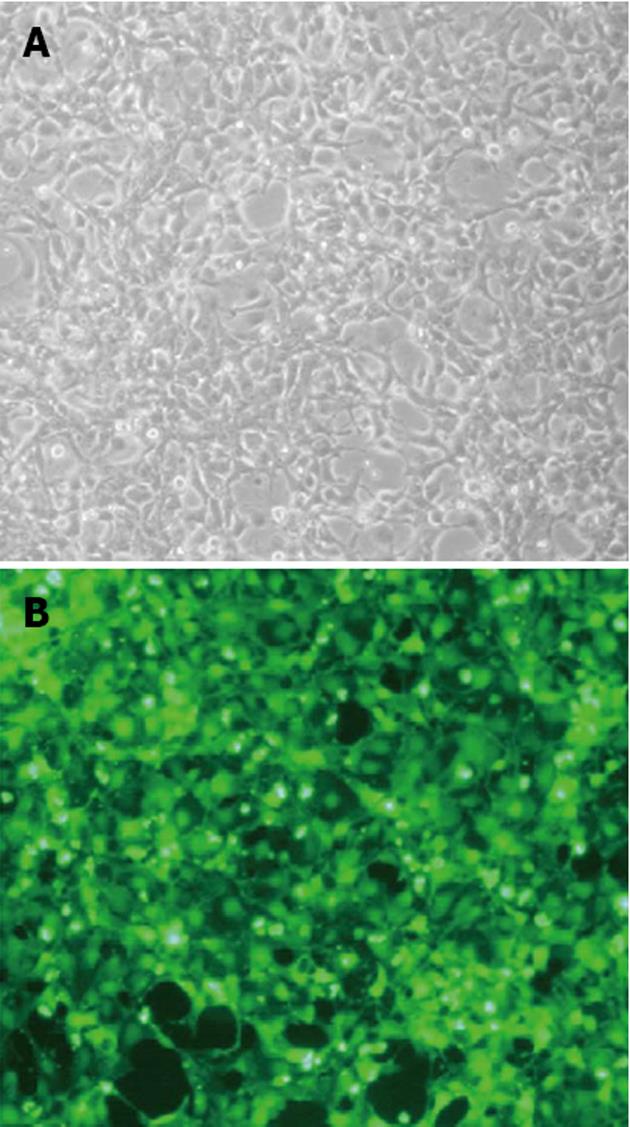
Figure 3 Plasmids transfected with the Fugene 6 transfection reagent.
A: HEK 293FT cells in light phase 48 h after transfection with plasmids; B: HEK 293FT cells in fluorescent phase 48 h after transfection with plasmids.
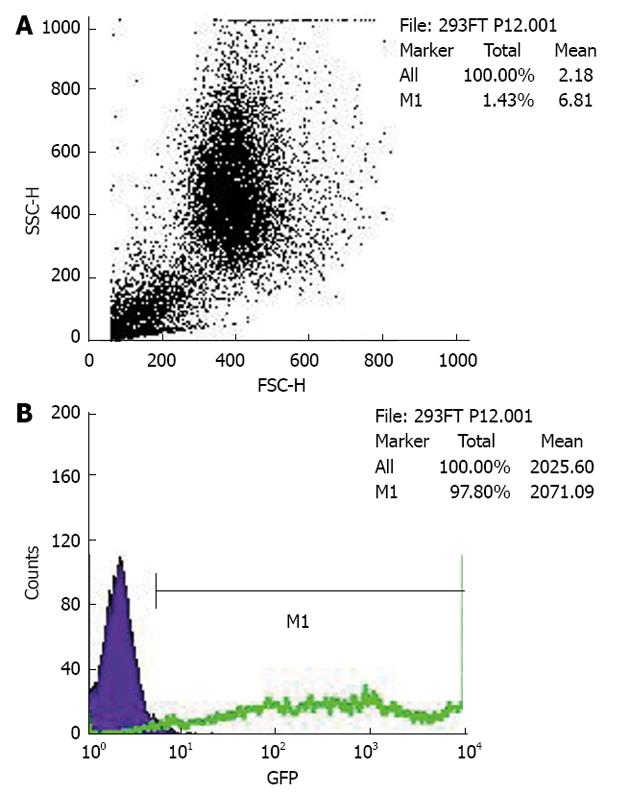
Figure 4 Fluorescence-activated cell sorting assay.
It demonstrates the method for calculating green fluorescent protein (GFP)-positive cells with fluorescence-activated cell sorting. The debris is gated out, and the target populations are identified and positively or negatively selected. The dot plots represent 10000 events, with the side scatter and forward scatter plots (A) and the fluorescence intensity of GFP (B). B shows a histogram demonstrating the GFP-positive cell populations. The histogram plots the fluorescence of GFP-positive cells on region M1 against counts on the Y-axis.
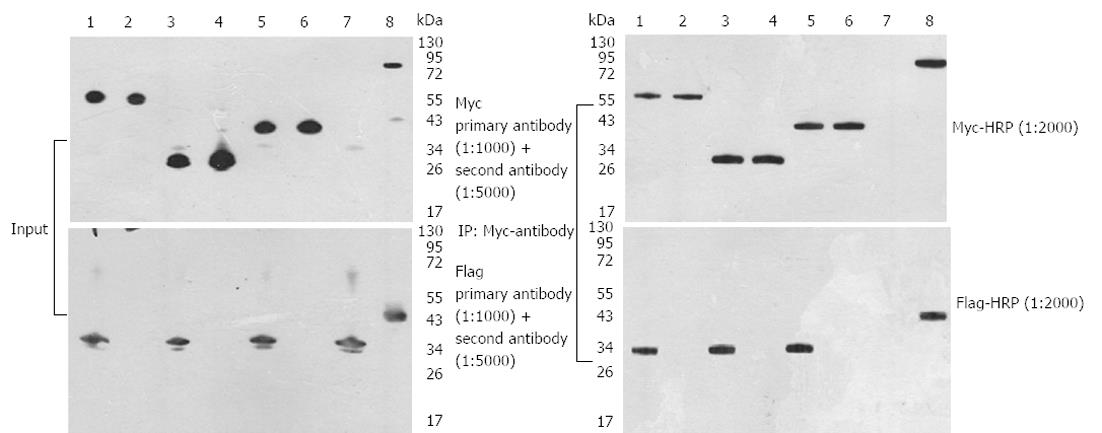
Figure 5 Expression and interaction of 14-3-3, potassium channel modulatory factor 1, quinone oxidoreductase, hydroxyisobutyrate dehydrogenase and 14-3-3plasmids in HEK 293FT cells.
A: Expression of the 14-3-3σ, potassium channel modulatory factor 1 (KCMF1), quinone oxidoreductase (NQO2), hydroxyisobutyrate dehydrogenase (HIBADH) plasmids. HEK 293FT cells were transfected with different plasmids. Forty-eight hours post-transfection, the cells were lysed, and Western blotting analysis was performed with an anti-Myc or anti-Flag antibody (1:1000); B: Interaction of 14-3-3σ and KCMF1, NQO2 or HIBADH. HEK 293FT cells were transfected with different plasmids. Forty-eight hours post-transfection, the cells were lysed and immunoprecipitations were performed with an anti-Myc antibody (1:2000). After the proteins were resolved by SDS-PAGE, immunoblot analysis was performed with antibodies against Flag protein (1:2000). 1: Sample 1 KCMF1; 2: Negative Control-1; 3: Sample 2 NQO2; 4: Negative Control-2; 5: Sample 3 HIBADH; 6: Negative Control-3; 7: Negative Control-4; 8: Positive.
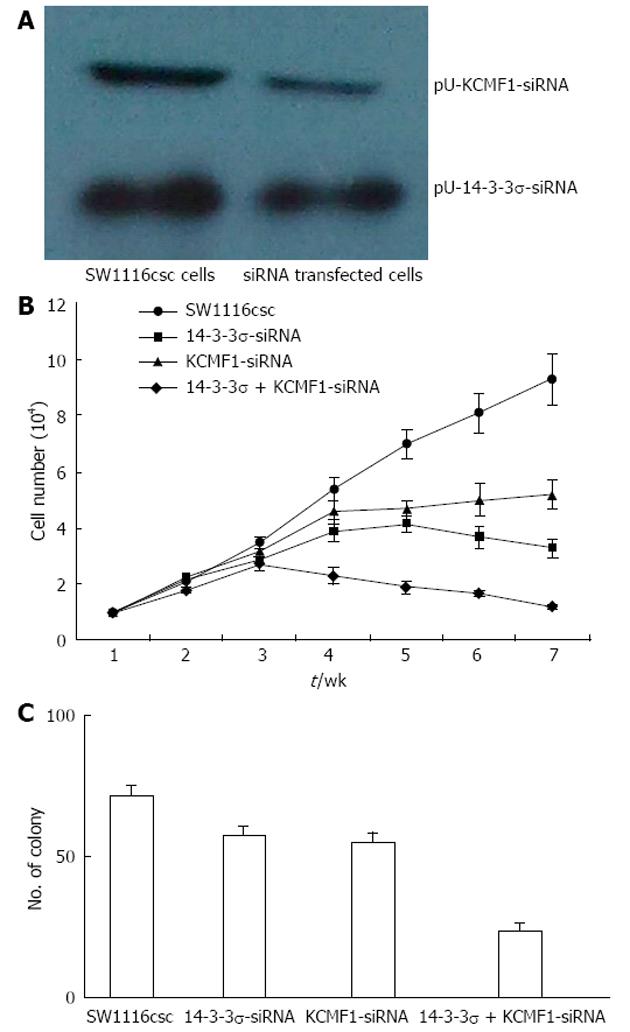
Figure 6 Effects of 14-3-3and potassium channel modulatory factor 1 protein expression on cell proliferation and colony formation of colon cancer stem cells.
A: Expression of 14-3-3σ and potassium channel modulatory factor 1 (KCMF1) proteins in SW1116csc and siRNA transfected cells; B: Growth curves of SW1116csc, 14-3-3σ siRNA transfected, KCMF1 siRNA transfected and 14-3-3σ + KCMF1 siRNA transfected cells. The mean ± SD are shown; C: Colony formation after the incubation of 100 separate cells for 14 d. The mean ± SD are shown.
- Citation: Zou J, Mi L, Yu XF, Dong J. Interaction of 14-3-3σ with KCMF1 suppresses the proliferation and colony formation of human colon cancer stem cells. World J Gastroenterol 2013; 19(24): 3770-3780
- URL: https://www.wjgnet.com/1007-9327/full/v19/i24/3770.htm
- DOI: https://dx.doi.org/10.3748/wjg.v19.i24.3770


