Copyright
©2013 Baishideng Publishing Group Co.
World J Gastroenterol. Jun 21, 2013; 19(23): 3634-3641
Published online Jun 21, 2013. doi: 10.3748/wjg.v19.i23.3634
Published online Jun 21, 2013. doi: 10.3748/wjg.v19.i23.3634
Figure 1 A 55-year-old woman with focal autoimmune pancreatitis of the pancreatic head.
A, B: Contrast-enhanced computed tomography images obtained during enhanced phases showing enhanced thickening of the common bile duct (CBD) wall (A, black arrow), narrowing of the main pancreatic duct (MPD) and distal CBD (B, black arrows); C: Bile duct dilation and irregular narrowing of the MPD in the pancreatic head can be observed on the magnetic resonance cholangiopancreatography image (white arrows).
Figure 2 A 59-year-old man with focal autoimmune pancreatitis of the pancreatic tail.
Contrast-enhanced computed tomography image obtained during the arterial phase (A, white arrow) showing that a hypoattenuating capsule-like rim can be observed around the pancreatic tail, which manifested delayed enhancement during the pancreatic phase (B, white arrow) and hepatic phase (C, white arrow). Attenuation values of the autoimmune pancreatitis lesion were 36, 51, 76 and 89 HU during the pre-contrast and enhanced phases, respectively.
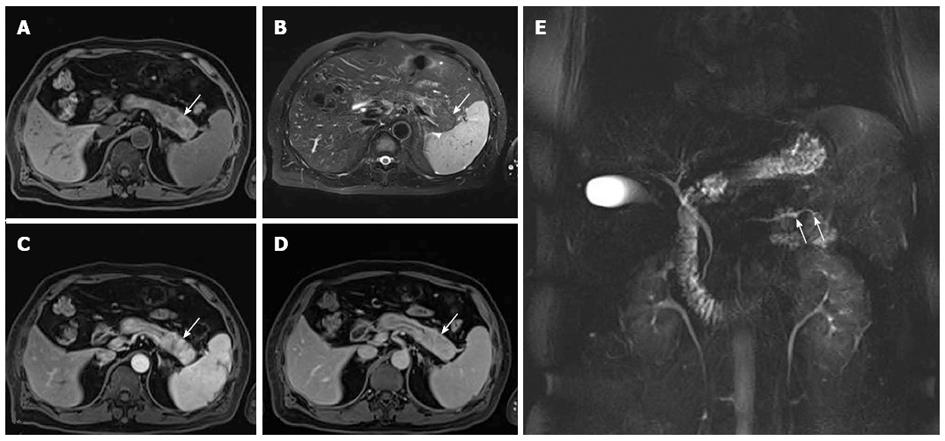
Figure 3 A 53-year-old man with focal autoimmune pancreatitis of the pancreatic tail.
A-D: The lesion showed heterogenous T1WI hypointensity and heterogenous T2WI hyperintensity, which was delayed enhanced. The capsule-like rim appearing as a T1WI iso- or slight hyperintensity and a T2WI hypointensity area surrounding the pancreas (white arrow), which were delayed and moderately enhanced; E: Magnetic resonance cholangiopancreatography image shows the irregular narrowing main pancreatic duct in the pancreatic tail (white arrows).
Figure 4 A 54-year-old man with pancreatic cancer of the pancreatic tail.
Triple-phase computed tomography images show irregular enlargement of the pancreatic tail. Enhancement of the lesion is decreased (A, 39 HU) during arterial phase, and slightly increased enhancement during pancreatic phase (B, 48 HU) and hepatic phase (C, 62 HU), respectively (white arrows).
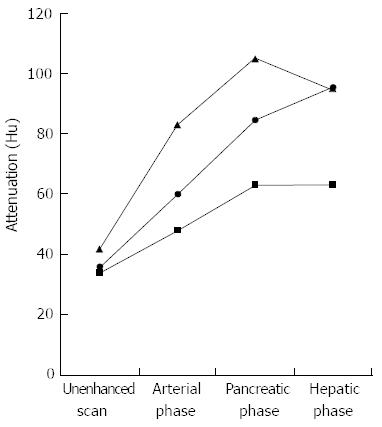
Figure 5 Graph shows mean computed tomography attenuation values of normal pancreatic parenchyma (triangle) and lesions in patients with focal autoimmune pancreatitis (circle) and pancreatic cancer (square) in relation to phase of contrast enhancement.
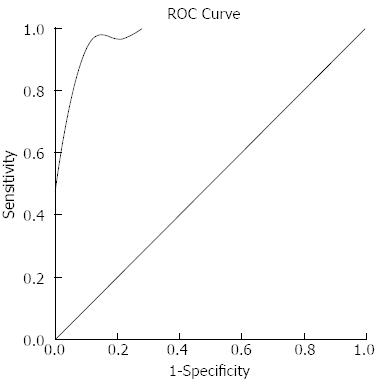
Figure 6 Receiver operating characteristic curve analysis result.
Receiver operating characteristic (ROC) curve analysis revealed that when values were more than or equal 28 HU they were considered diagnostic for focal autoimmune pancreatitis, and a sensitivity of 87.5%, a specificity of 100%, and an area under the ROC curve of 0.974 (95%CI: 0.928-1.021) were achieved.
- Citation: Sun GF, Zuo CJ, Shao CW, Wang JH, Zhang J. Focal autoimmune pancreatitis: Radiological characteristics help to distinguish from pancreatic cancer. World J Gastroenterol 2013; 19(23): 3634-3641
- URL: https://www.wjgnet.com/1007-9327/full/v19/i23/3634.htm
- DOI: https://dx.doi.org/10.3748/wjg.v19.i23.3634


