Copyright
©2013 Baishideng Publishing Group Co.
World J Gastroenterol. May 14, 2013; 19(18): 2761-2771
Published online May 14, 2013. doi: 10.3748/wjg.v19.i18.2761
Published online May 14, 2013. doi: 10.3748/wjg.v19.i18.2761
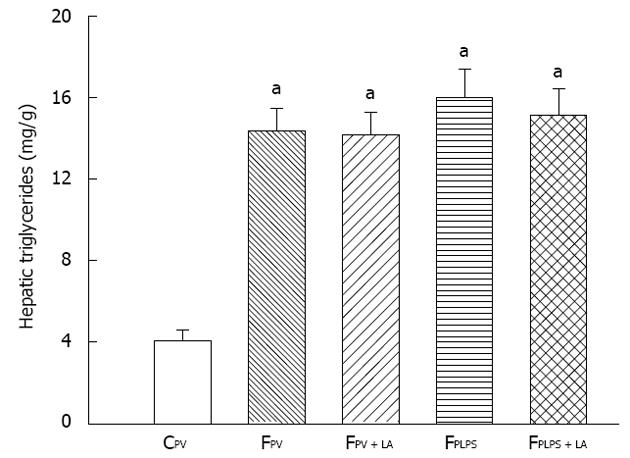
Figure 1 Effects of α-lipoic acid on hepatic triglyceride contents.
Hepatic triglyceride levels were measured from the blood of each group of fructose-fed rats and the control group. Values are expressed as mean ± SE, n = 6 per group, aP < 0.05 vs CPV. C: Regular diet; F: High-fructose enriched diet; LA: Lipoic acid; LPS: Lipopolysaccharides.
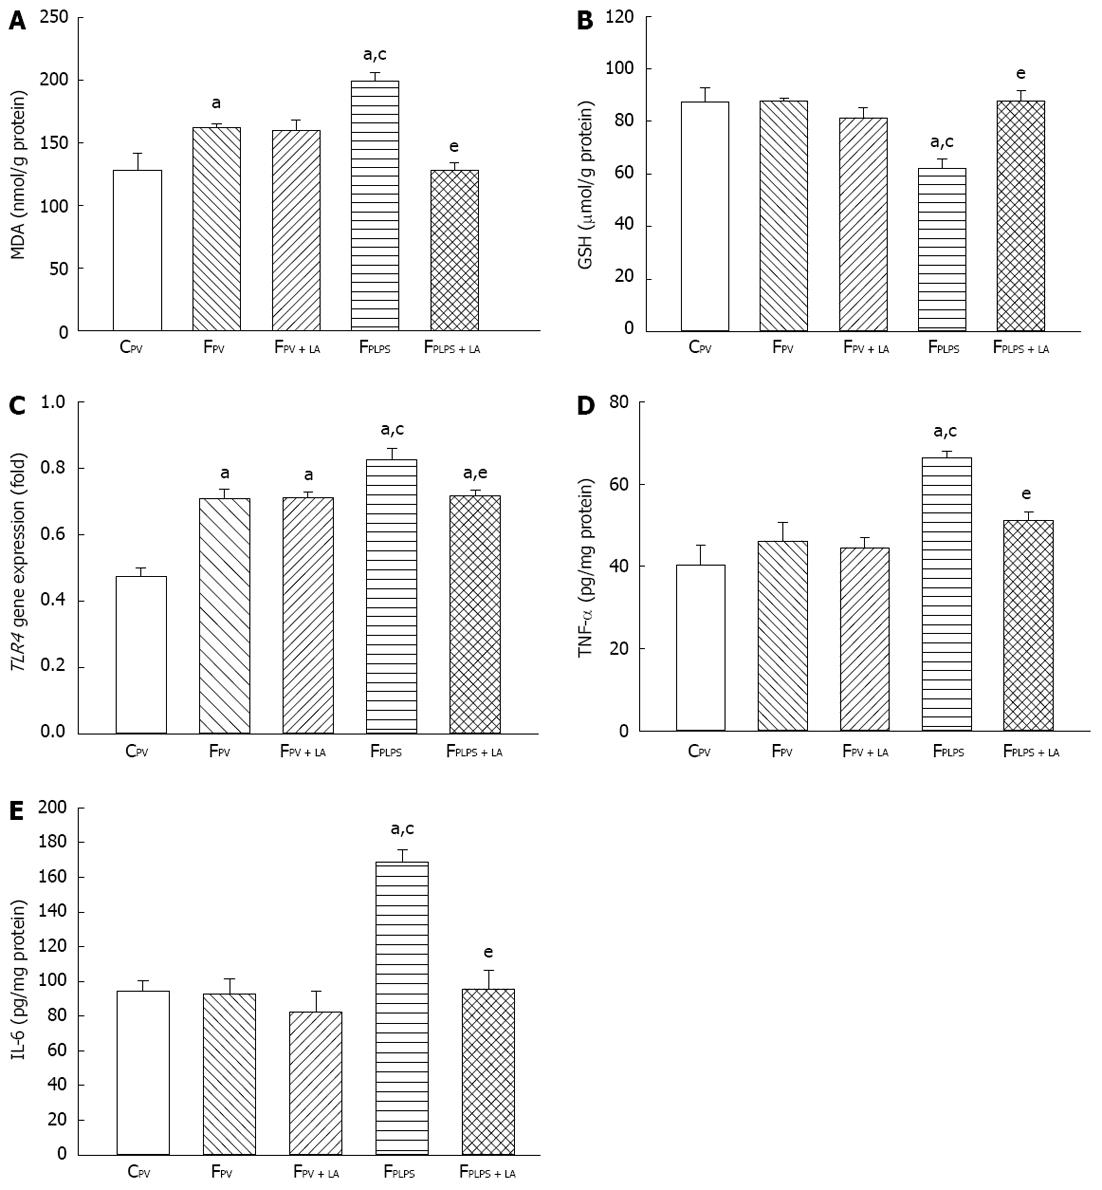
Figure 2 Effect of α-lipoic acid on portal endotoxemia-induced changes in hepatic oxidative and inflammatory markers.
The following parameters were measured from liver of each group of fructose-fed rats and the control group: (A) Malondialdehyde (MDA) content; (B) Glutathione (GSH) content; (C) Toll-like receptor 4 (TLR4) gene expression; (D) Tumor necrosis factor alpha (TNF-α) protein; and (E) Interleukin-6 (IL-6) protein. Values are expressed as mean ± SE, n = 6 per group. aP < 0.05 vs CPV; cP < 0.05 vs FPV; eP < 0.05 vs FPLPS. C: Regular diet; F: High-fructose enriched diet; LA: Lipoic acid; LPS: Lipopolysaccharides.
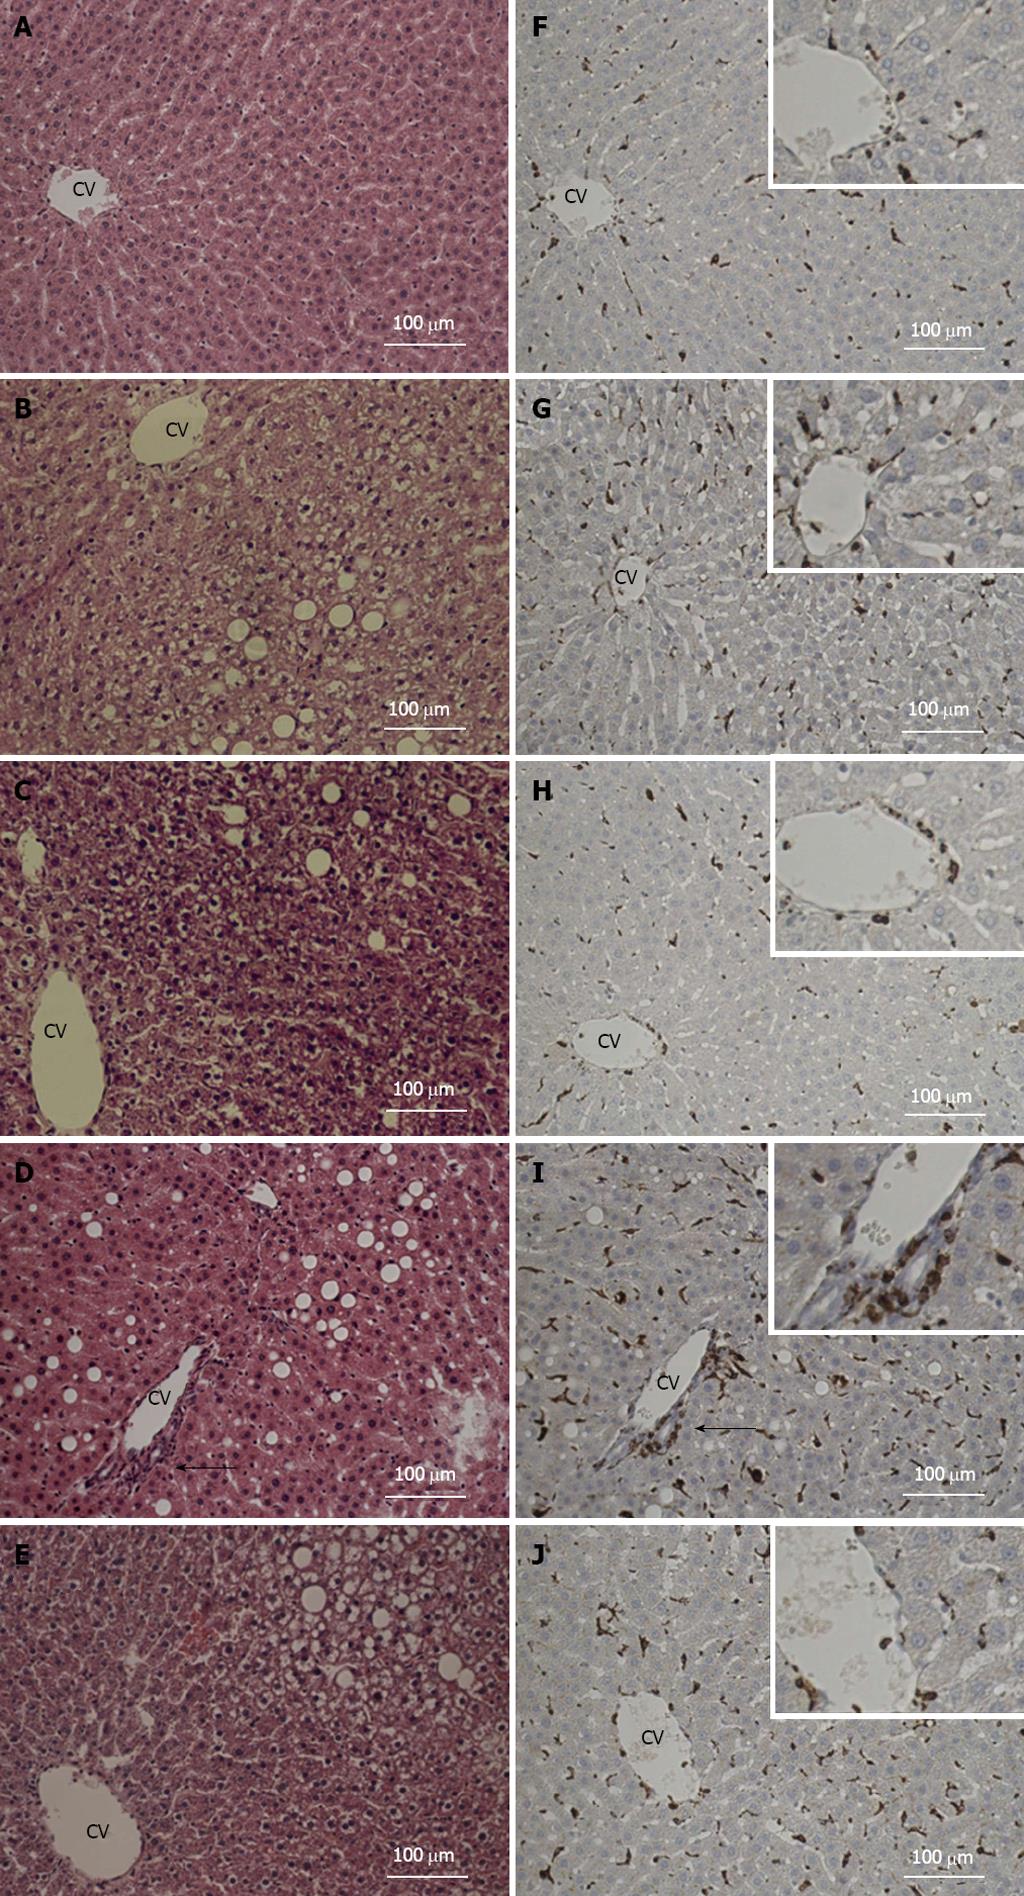
Figure 3 Histopathological examination of liver in rats with regular or high-fructose feeding.
Lipid accumulation in: (A) CPV rats; (B) FPV rats; (C)FPV + LA; (D) FPLPS; and (E) FPLPS + LA rats. CD-68 positive cell infiltration in: (F) CPV rats; (G) FPV rats; (H) FPV + LA; (I) FPLPS; and (J) FPLPS + LA rats. Slides were stained with hematoxylin and eosin (A-E) and immunostained with an anti-CD68 antibody (F-J). Arrows indicate CD68 positive cells. C: Regular diet; F: High-fructose enriched diet; LA: Lipoic acid; LPS: Lipopolysaccharides; CV: Central vein.
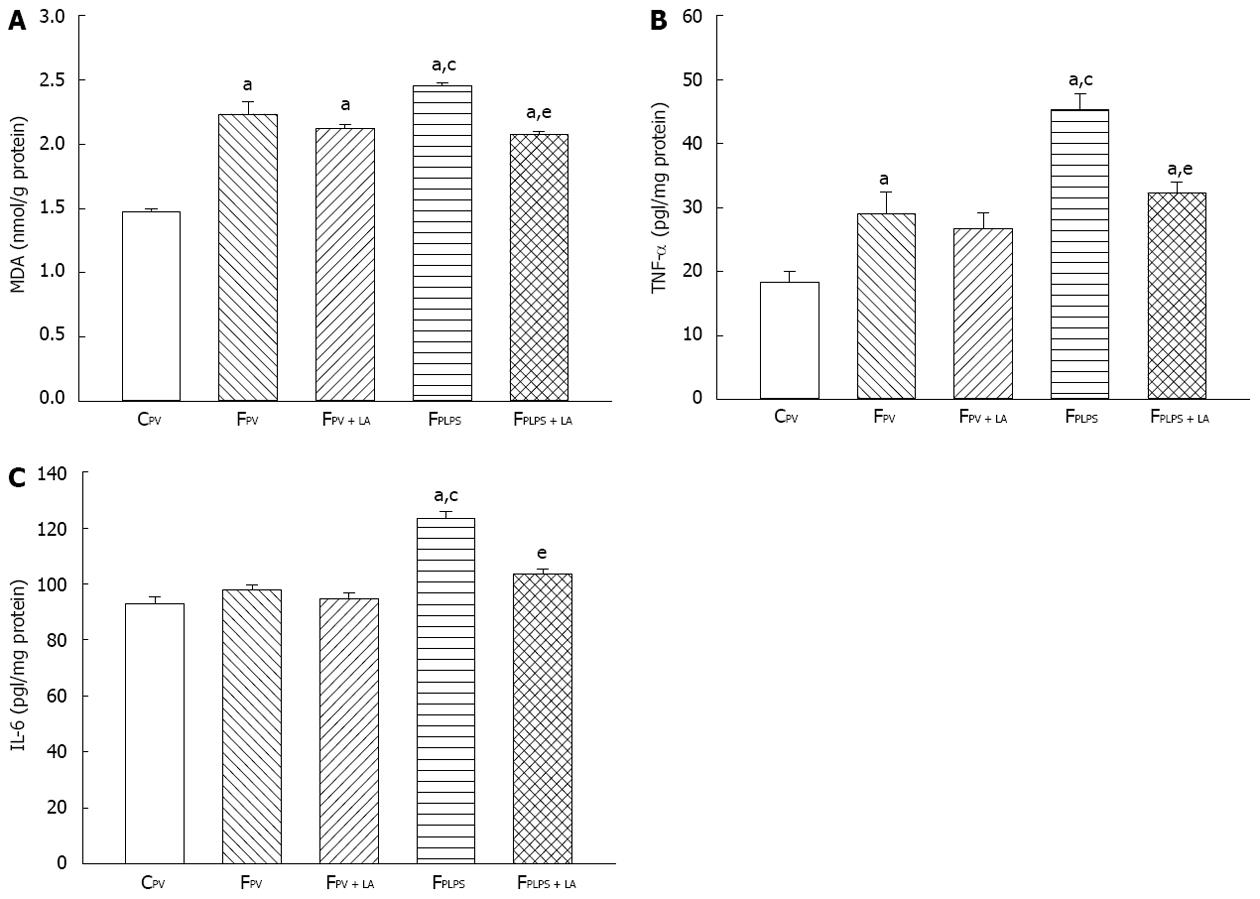
Figure 4 Effect of α-lipoic acid on portal endotoxemia-induced changes in the pancreas.
The pancreata from experimental animals were harvested and tested for: (A) Malondialdehyde (MDA) content; (B) Tumor necrosis factor alpha (TNF-α) protein level; and (C) Interleukin-6 (IL-6) protein level. Values are expressed as mean ± SE, n = 6 per group. aP < 0.05 vs CPV; cP < 0.05 vs FPV; eP < 0.05 vs FPLPS. C: Regular diet; F: High-fructose enriched diet; LA: Lipoic acid; LPS: Lipopolysaccharides.
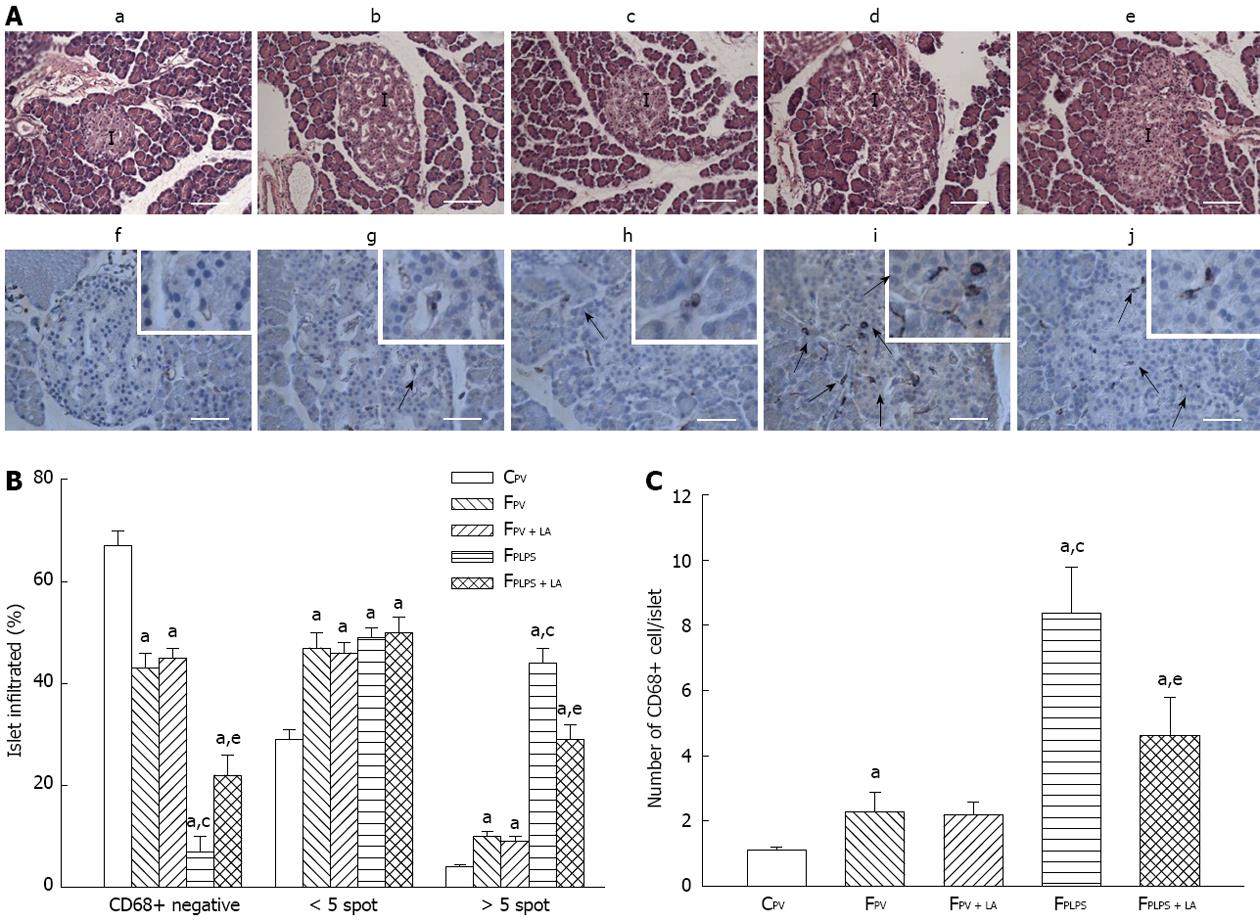
Figure 5 Histopathologicalexamination of pancreatic islets.
A: Tissue samples from each subset of animals were analyzed by hematoxylin and eosin (HE) staining (a-CPV, b-FPV, c-FPV + LA, d-FPLPS, e-FPLPS + LA) and immunostaining with an antibody against CD68 (f-CPV, g-FPV, h-FPV + LA, i-FPLPS, j-FPLPS + LA); This data was then quantitated as (B) percentage of islets infiltrated and (C) number of CD68+ cells per islet. Arrows indicated CD68-positive cells. I: Islet. A total of 100 ± 25 islets per experimental group were blindly scored for CD68-positive cells around the periphery and/or within islets from 5 to 6 different animals. Islet area was measured by the area of islet capsule in pancreatic section with HE stain and computed using AxioVision LE 4.8.2.0 software. Values are expressed as mean ± SE, n = 6 per group. Line bar: 50 μm. aP < 0.05 vs CPV; cP < 0.05 vs FPV; eP < 0.05 vs FPLPS. C: Regular diet; F: High-fructose enriched diet; LA: Lipoic acid; LPS: Lipopolysaccharides.
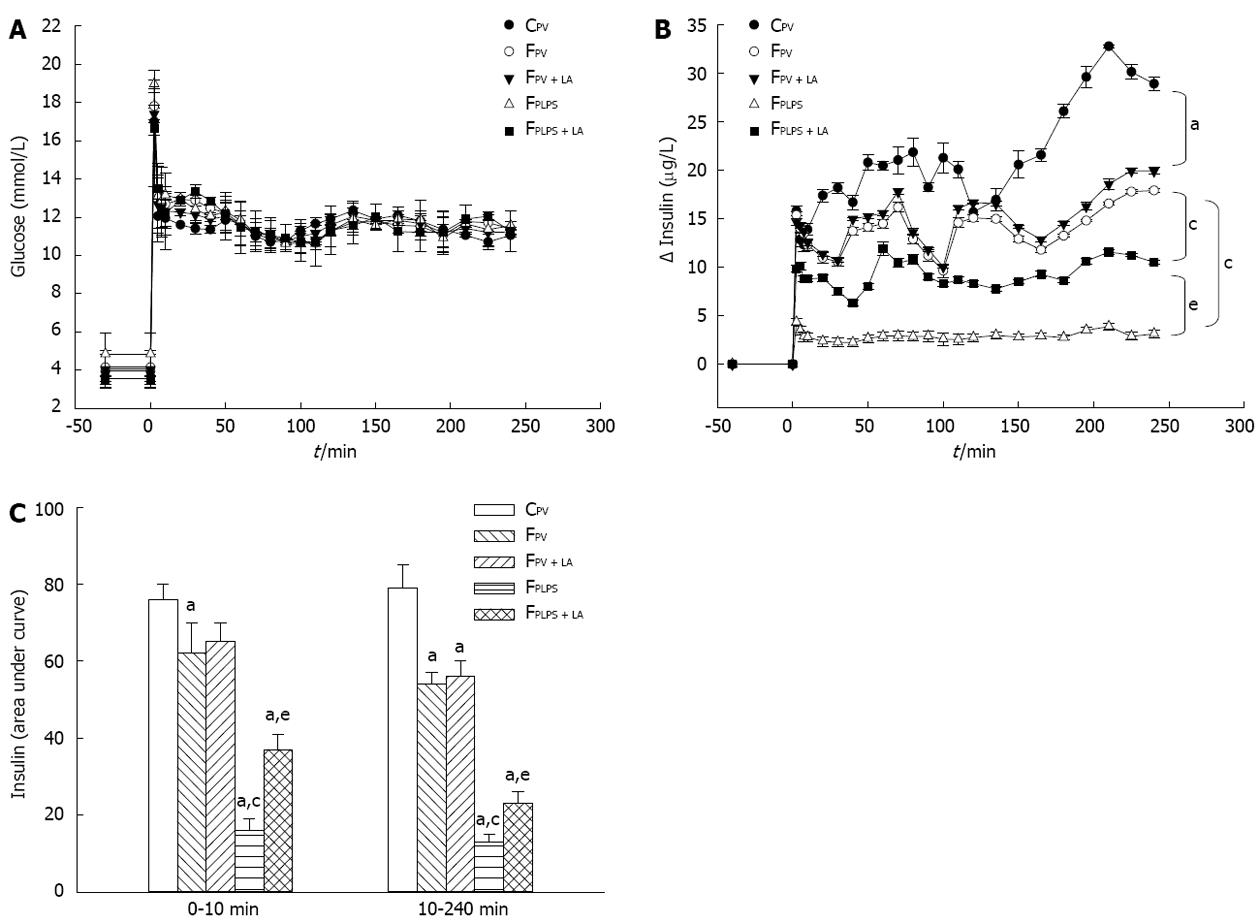
Figure 6 Effect of α-lipoic acid on plasma glucose and insulin levels.
A hyperglycemic clamp technique was used to evaluate glucose-stimulated insulin secretion. A: Plasma glucose levels during the clamp period; B: Change in insulin levels during clamp period; C: The insulin level averages during the first phase (0-10 min) and the second phase (10-240 min) of the clamp period. Values are expressed as mean ± SE, n = 6 per group. aP < 0.05 vs CPV; cP < 0.05 vs FPV; eP < 0.05 vs FPLPS. C: Regular diet; F: High-fructose enriched diet; LA: Lipoic acid; LPS: Lipopolysaccharides.
- Citation: Tian YF, He CT, Chen YT, Hsieh PS. Lipoic acid suppresses portal endotoxemia-induced steatohepatitis and pancreatic inflammation in rats. World J Gastroenterol 2013; 19(18): 2761-2771
- URL: https://www.wjgnet.com/1007-9327/full/v19/i18/2761.htm
- DOI: https://dx.doi.org/10.3748/wjg.v19.i18.2761


