Copyright
©2013 Baishideng Publishing Group Co.
World J Gastroenterol. Mar 21, 2013; 19(11): 1749-1759
Published online Mar 21, 2013. doi: 10.3748/wjg.v19.i11.1749
Published online Mar 21, 2013. doi: 10.3748/wjg.v19.i11.1749
Figure 1 Viability of hepatoma cells under hypoxia was measured using methyl thiazolyl tetrazolium cell proliferation assay.
A: Histograms; B: Polygon.
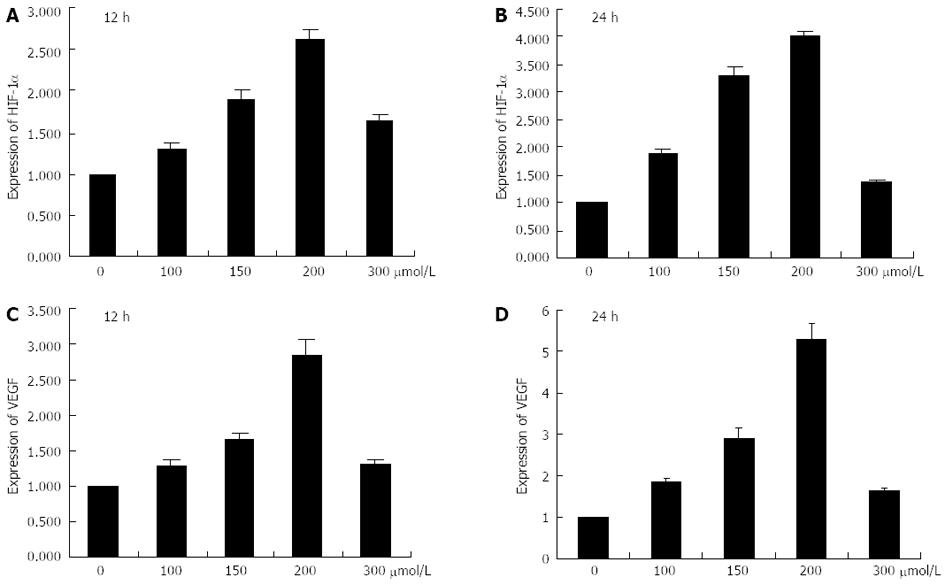
Figure 2 mRNA expression levels of hypoxia-inducible factor-1α and vascular endothelial growth factor.
A, B: Histograms illustrating hypoxia-inducible factor-1α (HIF-1α) mRNA expression after exposure to various concentrations of CoCl2 for 12 h and 24 h; C, D: Histograms illustrating vascular endothelial growth factor (VEGF) mRNA expression after exposure to various concentrations of CoCl2 for 12 h and 24 h.
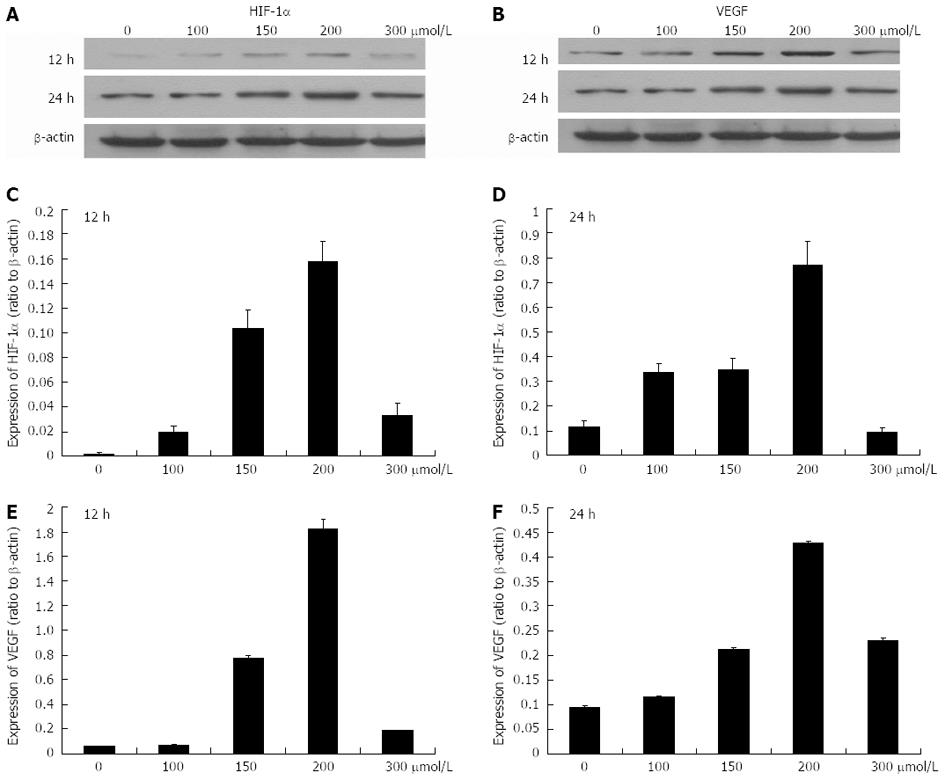
Figure 3 Protein expression levels of hypoxia-inducible factor-1α and vascular endothelial growth factor after exposure to 0-300 μmol/L CoCl2 for 12 and 24 h.
A, B: The Western blotting analysis of protein expression levels of hypoxia-inducible factor-1α (HIF-1α) and vascular endothelial growth factor (VEGF); C, D: Histograms illustrating HIF-1α protein expression after exposure to various concentrations of CoCl2 for 12 h and 24 h; E, F: Histograms illustrating VEGF protein expression after exposure to various concentrations of CoCl2 for 12 h and 24 h.
Figure 4 Histograms illustrating hypoxia-inducible factor-1α (A) and vascular endothelial growth factor (B) mRNA expression after small interfering RNAs transfection (24 h processing time).
siRNA: Small interfering RNA.
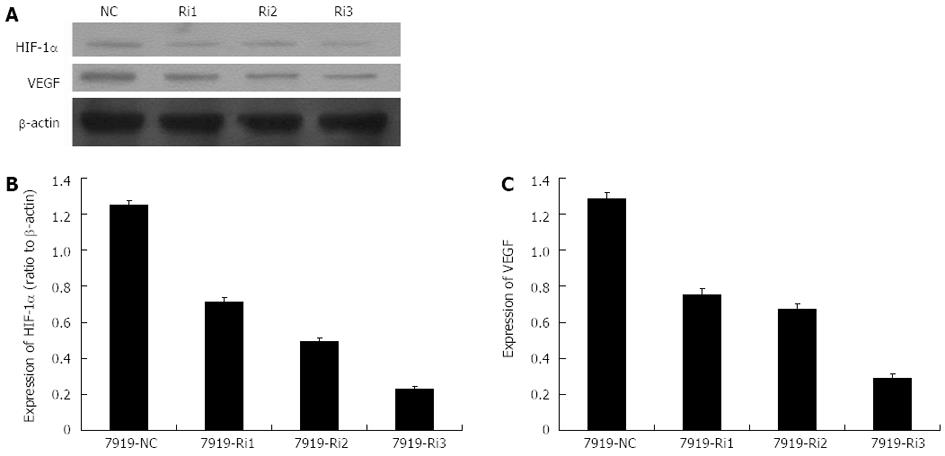
Figure 5 Protein expression levels of hypoxia-inducible factor-1α and vascular endothelial growth factor after small interfering RNAs transfection (24 h processing time).
A: The Western blotting analysis of protein expression levels of hypoxia-inducible factor-1α (HIF-1α) and vascular endothelial growth factor (VEGF) after small interfering RNA (siRNA) transfection; B, C: Histograms illustrating HIF-1α (B) and VEGF (C) protein expression after siRNA transfection. NC: Control group without siRNA transfection; Ri1, Ri2, Ri3: Three different specific siRNA sequences.
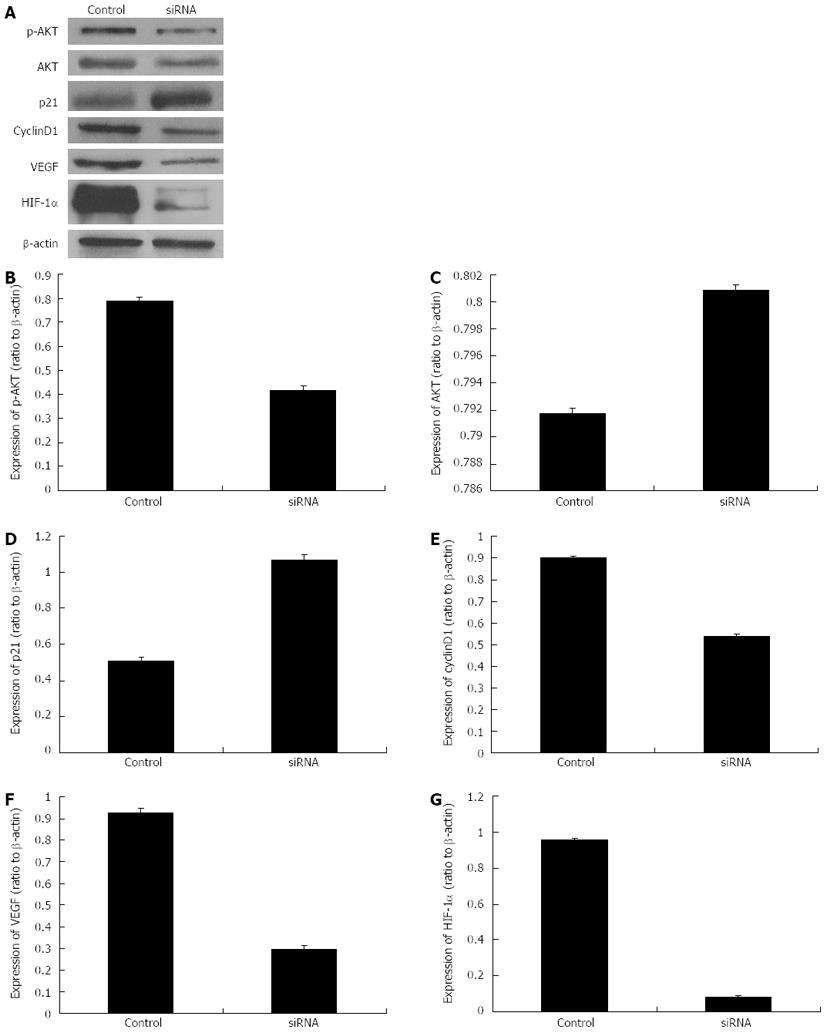
Figure 6 Protein expression levels of p-AKT, AKT, p21, cyclinD1, vascular endothelial growth factor and hypoxia-inducible factor-1α after the transfection with specific small interfering RNAs (processing time of 24 h).
A: The Western blotting analysis of protein expression levels of p-AKT, AKT, p21, cyclinD1, vascular endothelial growth factor (VEGF) and hypoxia-inducible factor-1α (HIF-1α) after specific small interfering RNA (siRNA) transfection; B-G: Histograms illustrating p-AKT (B), AKT (C), p21 (D), cyclinD1(E), VEGF (F) and HIF-1α (G) protein expression after specific siRNA transfection.
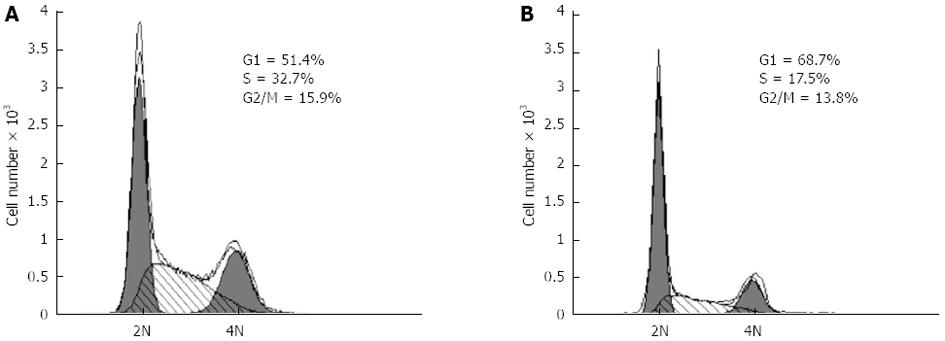
Figure 7 Methyl thiazolyl tetrazolium cell proliferation assay indicated that the hypoxia-inducible factor-1α silencing via specific small interfering RNAs significantly inhibited the proliferation of CBRH-7919 hepatoma cells.
A: Contro group; B: Processing time of 24 h.
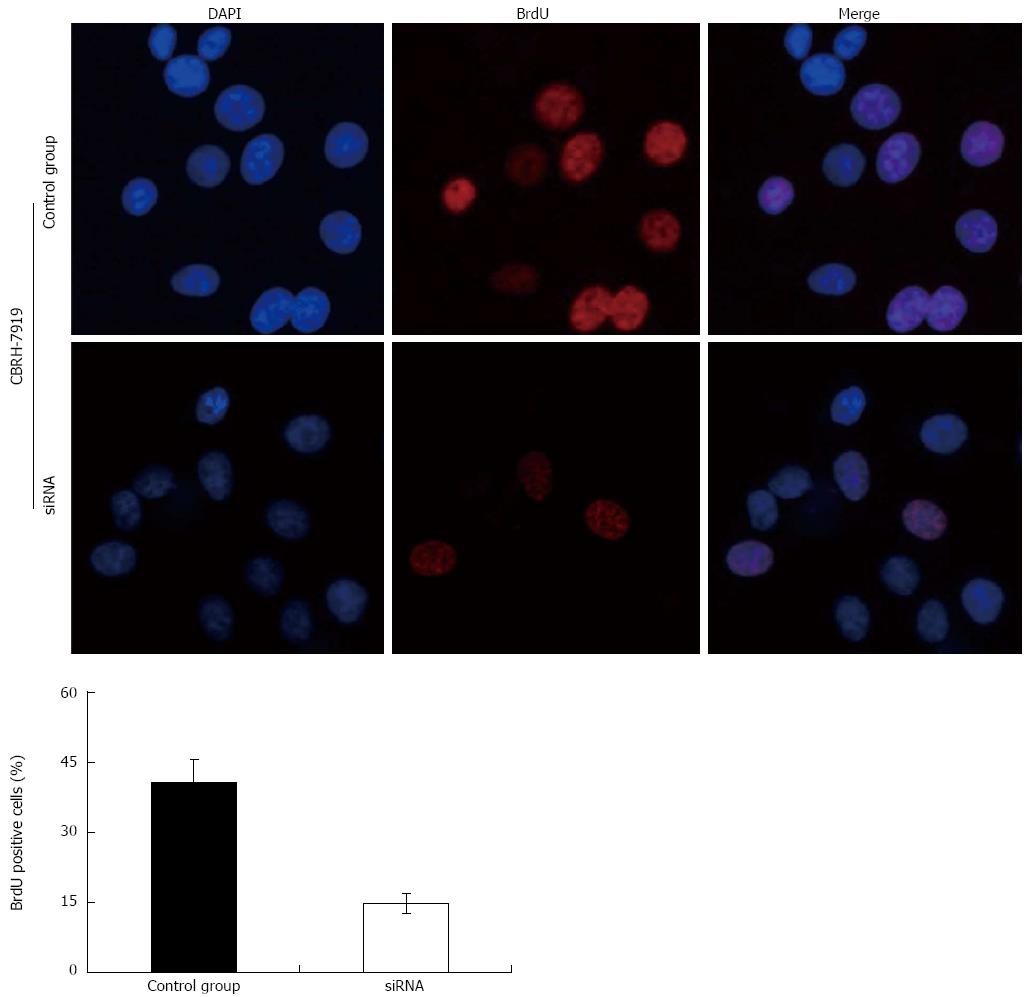
Figure 8 Proliferation of hepatoma cells detected by bromodeoxyuridine incorporation illustrates that hypoxia-inducible factor-1α silencing via specific small interfering RNAs significantly inhibited the proliferation of CBRH-7919 hepatoma cells.
DAPI: 4',6'-diamidino-2-phenylindole hydrochloride; BrdU: Bromodeoxyuridine.
- Citation: Xu LF, Ni JY, Sun HL, Chen YT, Wu YD. Effects of hypoxia-inducible factor-1α silencing on the proliferation of CBRH-7919 hepatoma cells. World J Gastroenterol 2013; 19(11): 1749-1759
- URL: https://www.wjgnet.com/1007-9327/full/v19/i11/1749.htm
- DOI: https://dx.doi.org/10.3748/wjg.v19.i11.1749


