Copyright
©2013 Baishideng Publishing Group Co.
World J Gastroenterol. Mar 21, 2013; 19(11): 1736-1748
Published online Mar 21, 2013. doi: 10.3748/wjg.v19.i11.1736
Published online Mar 21, 2013. doi: 10.3748/wjg.v19.i11.1736
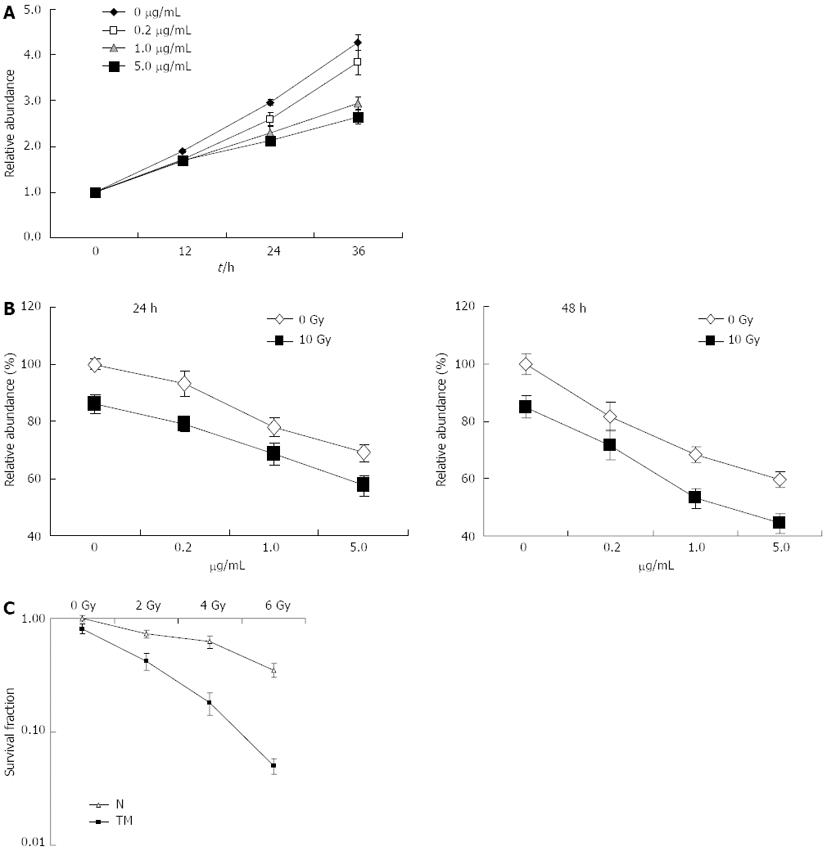
Figure 1 Radiosensitization effect of tunicamycin in EC109 cells.
A: Exponentially growing EC109 cells were treated with tunicamycin (TM) at the indicated concentrations. Cell growth was determined using cell counting kit-8 (CCK-8) and relative growth rate was calculated using the absorption at 0 h as a baseline; B: EC109 cells were pretreated with or without TM (5 μg/mL), followed by a single dose of 10 Gy. 24 h (left panel) or 48 h (right panel) later, relative cell viability was measured using CCK-8; C: EC109 cells were pretreated with or without TM (5 μg/mL) for 24 h. After irradiation with 2, 4 and 6 Gy, cells were further cultivated for 10-14 d. The number of colonies with > 50 cells was counted under a dissecting microscope. N: Untreated with TM.
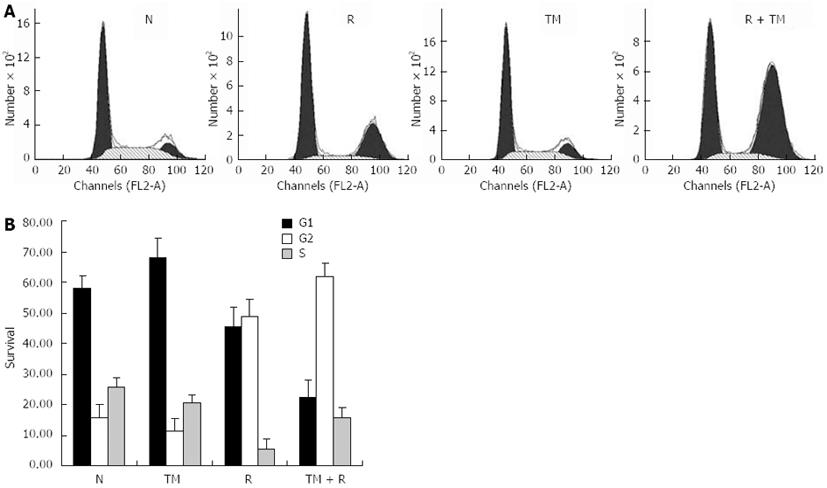
Figure 2 Cell cycle arrest induced by tunicamycin.
A: EC109 cells were pretreated with or without tunicamycin (TM) (0.5 μg/mL), followed by a single dose of 10 Gy. 24 h later, cells were harvested, fixed, and labeled with propidium iodide. Cell cycle distributions were analyzed on a FACSort; B: Data are the mean ± SD of three independent experiments. N: Sham-treated with TM; R: 10 Gy irradiation.
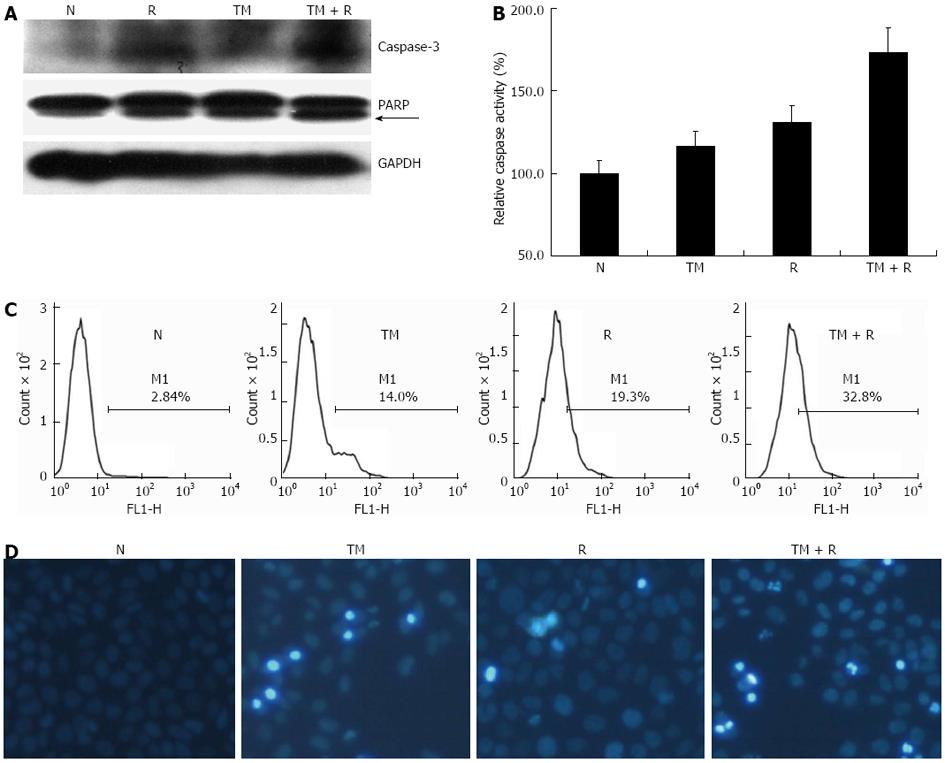
Figure 3 Apoptosis is enhanced by tunicamycin in irradiated cells.
EC109 cells were pretreated with or without tunicamycin (TM) (5 μg/mL), followed by a single dose of 10 Gy. A: Western blotting analysis for poly ADP-ribose polymerase (PARP), Caspase-3, and glyceraldehyde-3-phosphate dehydrogenase (GAPDH); B: Caspase-8 activity of treated cells; C: Apoptosis was determined by annexin V labeling; D: Representative images of cells stained with Hoechst 33343. N: Sham-treated with TM; R: 10 Gy irradiation.
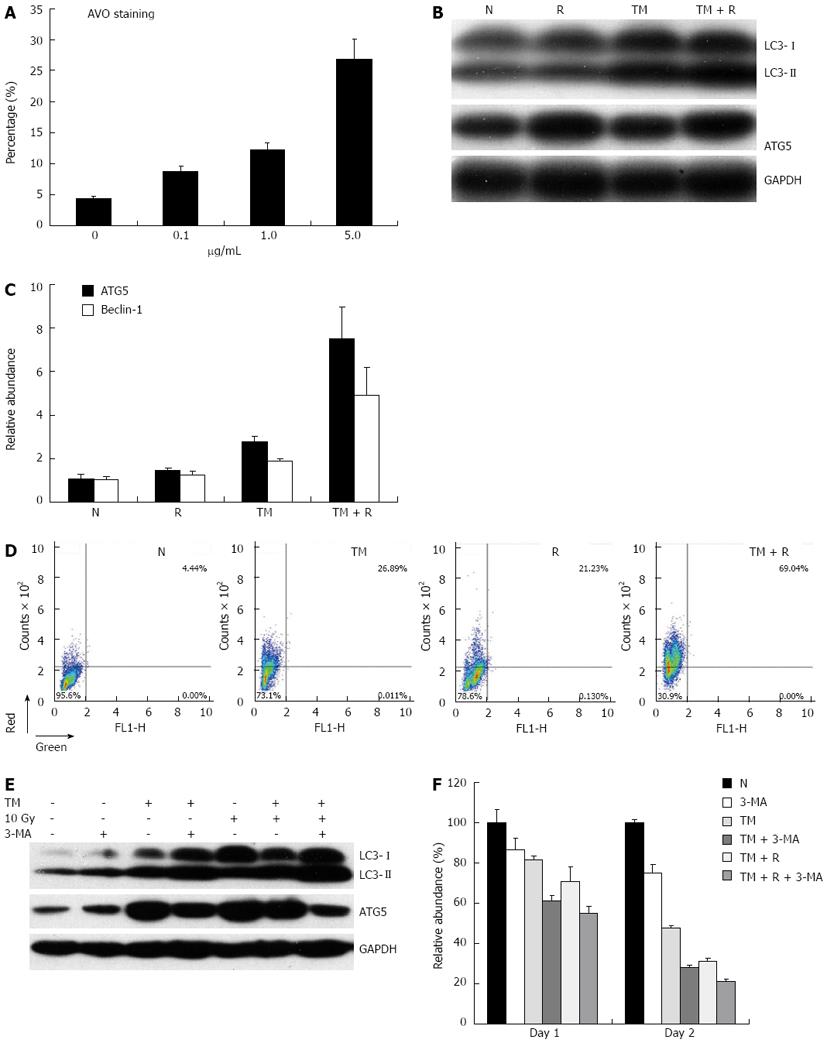
Figure 4 Autophagy response induced by tunicamycin.
A: EC109 cells were exposed to increasing concentrations of tunicamycin (TM), and stained with acridine orange (AO); B: EC109 cells were pretreated with or without TM (5 μg/mL), followed by a single dose of 10 Gy and analyzed by Western blotting for LC3 and ATG5; C: Relative mRNA expression of Beclin-1 and ATG5 was assessed by quantitative polymerase chain reaction; D: After AO staining, cells were quantitatively analyzed on a FACSort; E: Cells were treated as indicated, and protein levels of LC3 and ATG5 were assessed by Western blotting; F: Relative cell viability of cells treated with TM, radiation and autophagy inhibitor 3-MA for 24 or 48 h. N: Sham-treated with TM; R: 10 Gy irradiation. GAPDH: Glyceraldehyde-3-phosphate dehydrogenase.
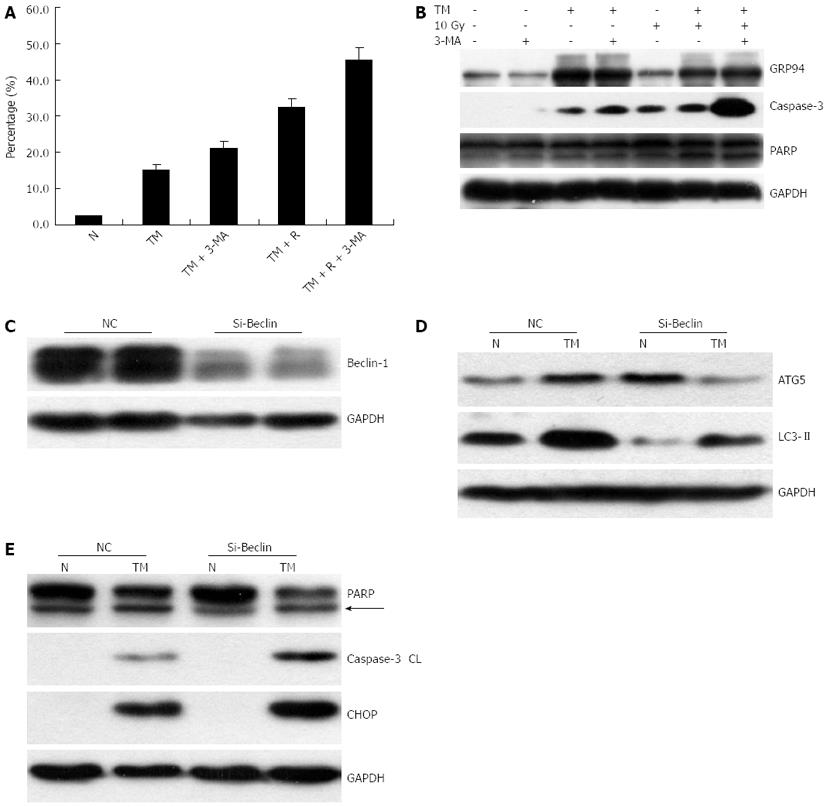
Figure 5 The effect of autophagy inhibition on cell apoptosis.
EC109 cells were treated with tunicamycin (TM), radiation, and 3-MA for 24 h. A: The proportion of annexin V positive cells was measured and analyzed on a FACSort; B: Protein levels of GRP94, cleaved Caspase-3, and its substrate poly ADP-ribose polymerase (PARP) were assessed by Western blotting; C: EC109 cells were transfected with Beclin-1 siRNA. Two days after transfection, protein levels of Beclin-1 and ATG5 were determined by Western blotting; D, E: Western blotting of cells transfected with siRNA and treated with TM. Levels of LC3, ATG5, C/EBP homologous protein (CHOP), cleaved Caspase-3, and PARP were shown. N: Sham-treated with TM; R: 10 Gy irradiation; GAPDH: Glyceraldehyde-3-phosphate dehydrogenase.
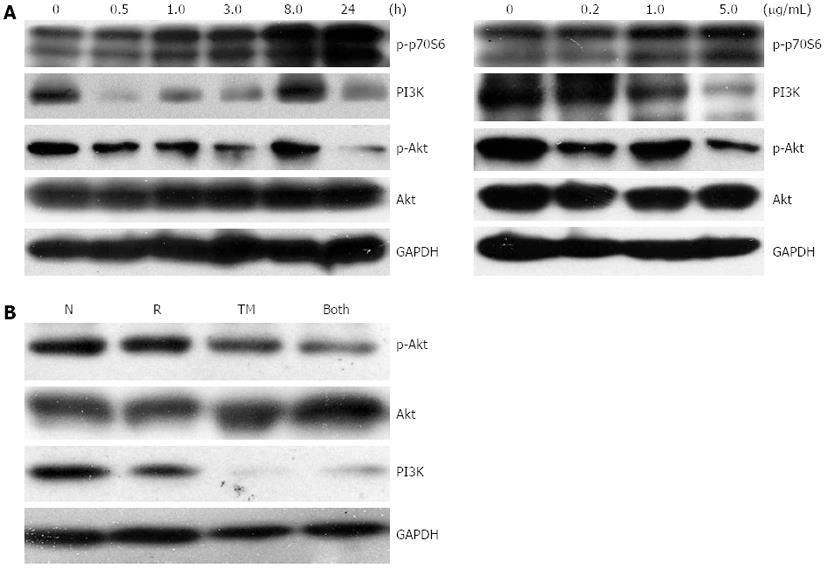
Figure 6 Cell signaling pathways associated with tunicamycin.
A: EC109 cells were exposed to tunicamycin (TM) (5 μg/mL) for the indicated time periods, subjected to Western blotting analysis (left panel) or treated with TM at the indicated concentrations for 24 h, and subjected to Western blotting analysis (right panel); B: Western blotting analysis of cells pretreated with or without TM (5 μg/mL), followed by a single dose of 10 Gy. N: Sham-treated with TM; R: 10 Gy irradiation; GAPDH: Glyceraldehyde-3-phosphate dehydrogenase.
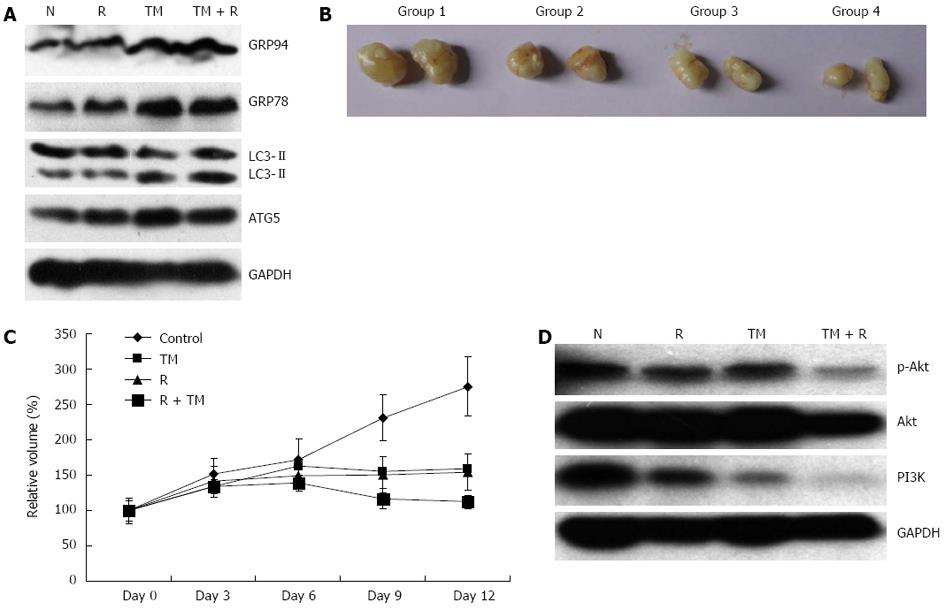
Figure 7 Radiosensitization by tunicamycin in vivo.
A: Tumor xenografts removed from each group were subjected to Western blotting analysis for GRP78, GRP94, LC3, and ATG5; B: Examples of tumor xenografts removed from each group; C: Growth curves of tumor xenografts; D: Samples of tumor xenografts were subjected to Western blotting analysis for Akt, p-Akt, and PI3K. N: Sham-treated with tunicamycin (TM); R: 10 Gy irradiation; GAPDH: Glyceraldehyde-3-phosphate dehydrogenase.
- Citation: Pang XL, He G, Liu YB, Wang Y, Zhang B. Endoplasmic reticulum stress sensitizes human esophageal cancer cell to radiation. World J Gastroenterol 2013; 19(11): 1736-1748
- URL: https://www.wjgnet.com/1007-9327/full/v19/i11/1736.htm
- DOI: https://dx.doi.org/10.3748/wjg.v19.i11.1736


