Copyright
©2013 Baishideng Publishing Group Co.
World J Gastroenterol. Mar 14, 2013; 19(10): 1572-1581
Published online Mar 14, 2013. doi: 10.3748/wjg.v19.i10.1572
Published online Mar 14, 2013. doi: 10.3748/wjg.v19.i10.1572
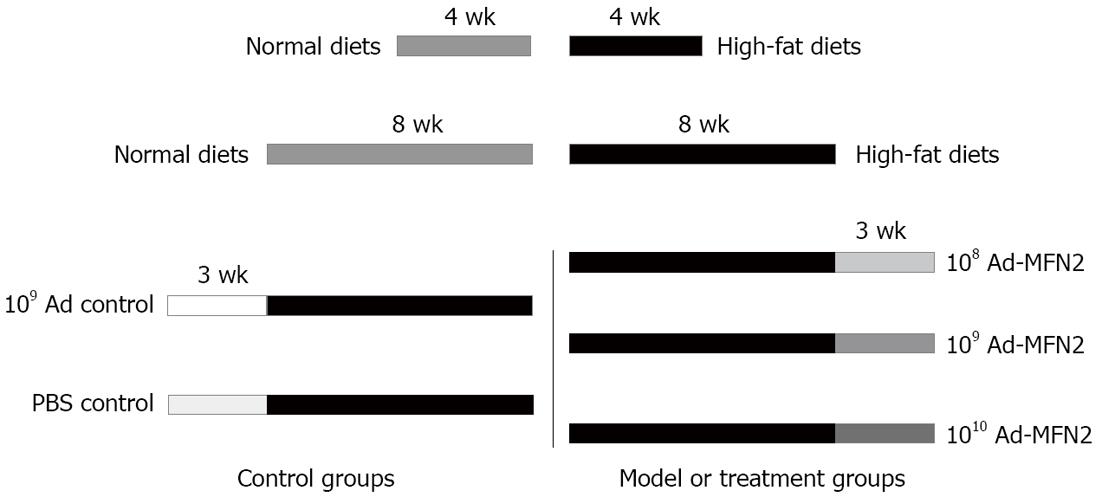
Figure 1 Schematic presentation of rat groups.
Rats were fed with control or high-fat diets for 4 or 8 wk, and then some groups were infected with Ad-mitofusin 2 (MFN2) or empty Ad adenovirus or phosphate-buffered saline (PBS) control once a week for 3 wk.
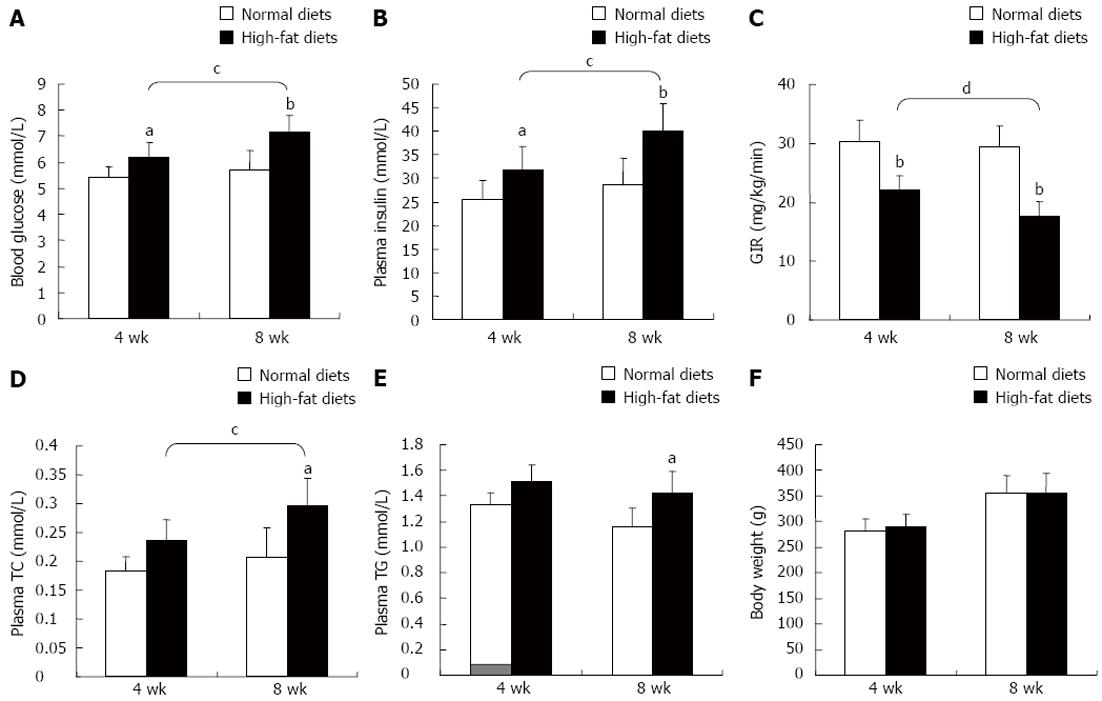
Figure 2 High-fat diets resulted in insulin resistance in rats (n = 6).
Rats were fed with high-fat diets or normal control diets for 4 wk or 8 wk. A: The level of blood glucose; B: The level of plasma insulin. C: The values of glucose infusion rate (GIR) were used to assess insulin sensitivity of rats assayed by hyperinsulinemic euglycemic clamping; D: The level of plasma total cholesterol (TC); E: The level of plasma triglyceride (TG); F: The body weight. aP < 0.05, bP < 0.01 vs normal diets; cP < 0.05, dP < 0.01 vs 4 wk.
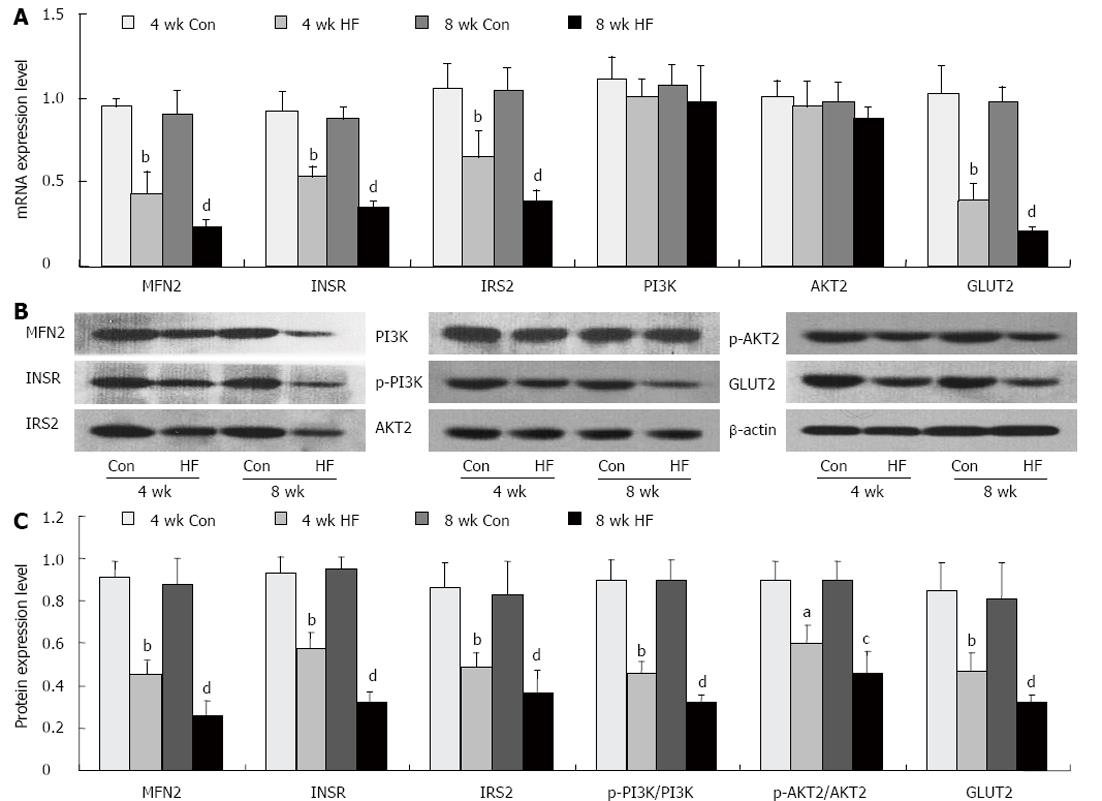
Figure 3 High-fat diets inhibited insulin pathway in liver of rats.
Rats were fed with high-fat diets (HF) or normal control diets (Con) for 4 or 8 wk. A: The mRNA expression levels of mitofusin 2 (MFN2), insulin receptor (INSR), insulin receptor substrate 2 (IRS2), phosphoinositide-3-kinase (PI3K), AKT2 and glucose transporter type 2 (GLUT2) were examined by quantitative real-time-polymerase chain reaction; B and C: The protein levels were detected by Western-blotting. bP < 0.01 vs normal diets for 4 wk; dP < 0.01 vs normal diets for 8 wk.
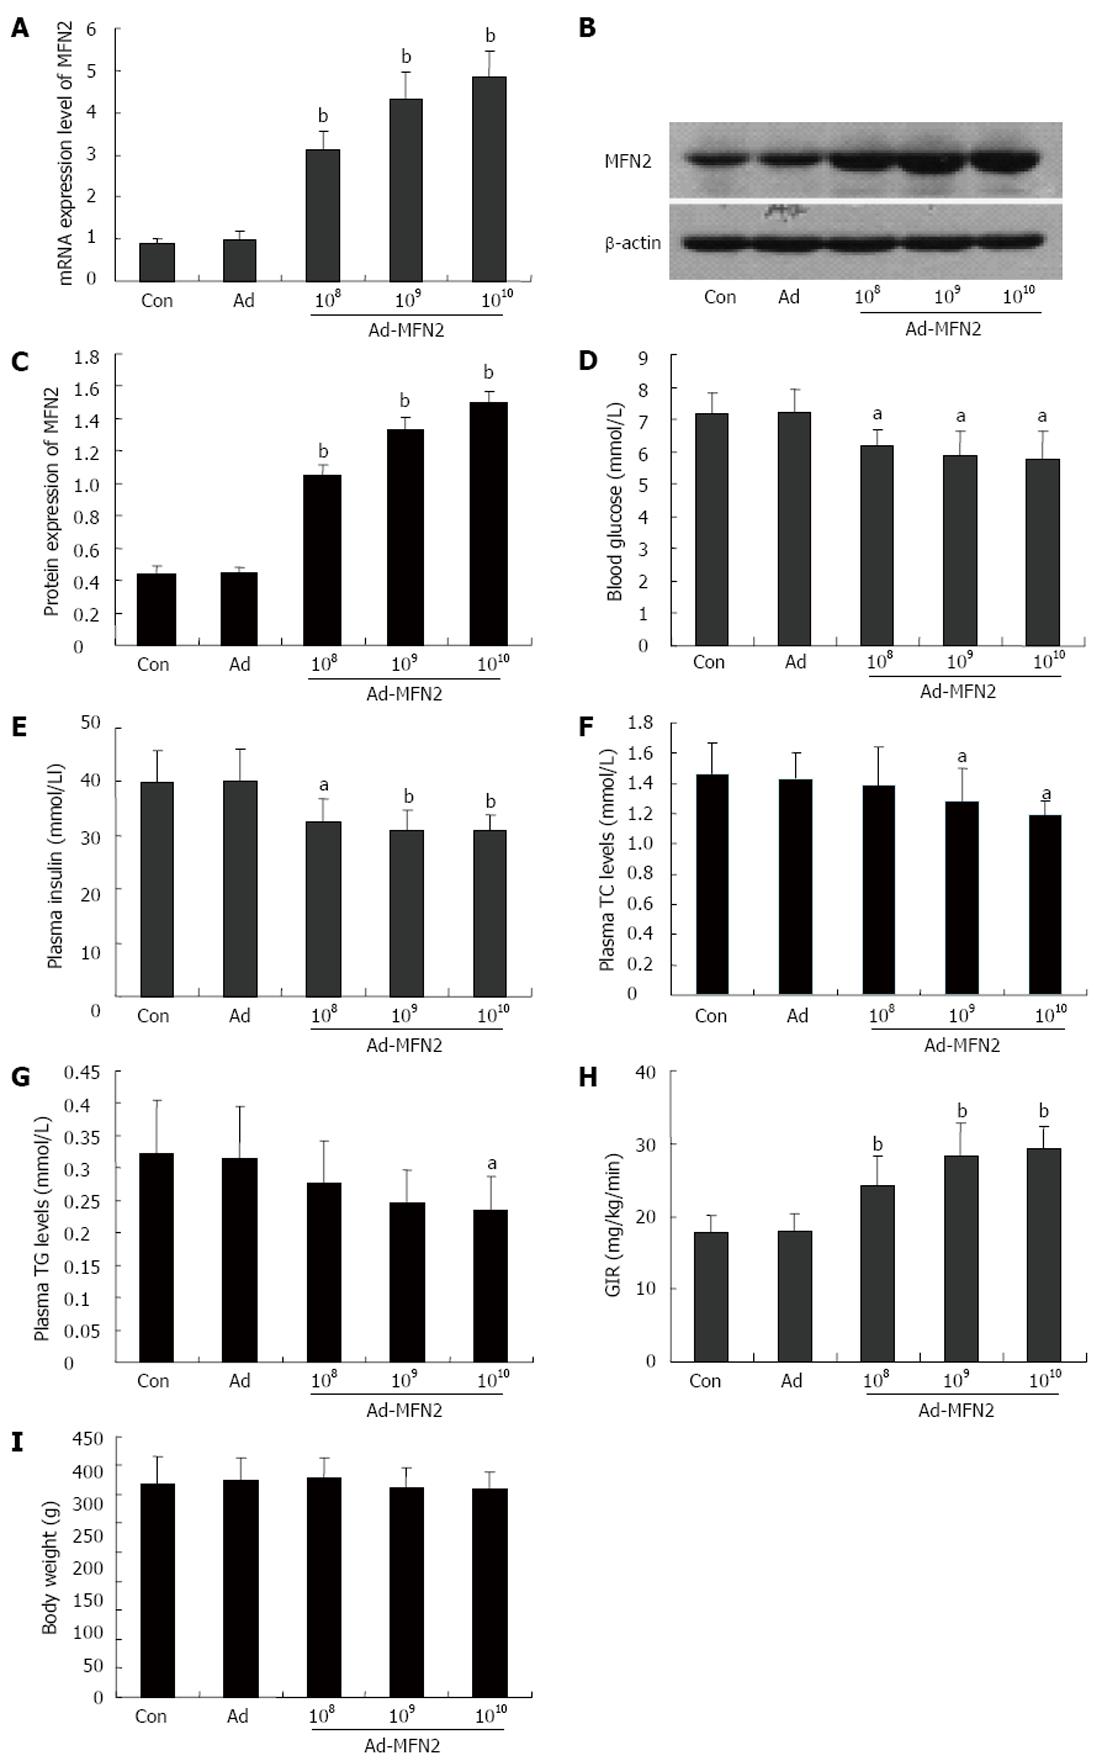
Figure 4 Mitofusin-2 over-expression improved insulin sensitivity of rats (n = 6).
Rats were fed with high-fat diets for 8 wk, and then were infected with different amount of Ad-mitofusin-2 (MFN2) (108, 109 or 1010 vp/kg body weight) or empty Ad adenovirus or phosphate-buffered saline (PBS) control for 3 wk. MFN2 over-expression in liver of rats was confirmed by quantitative real-time-polymerase chain reaction (A) and Western-blotting (B and C). The levels of blood glucose (D), plasma insulin (E), triglycerides (TG) (G) plasma total cholesterol (TC) (F) and insulin sensitivity (H) levels were examined, respectively. The body weight of rats was measured (I). aP < 0.05, bP < 0.01 vs Ad. GIR: Glucose infusion rate.
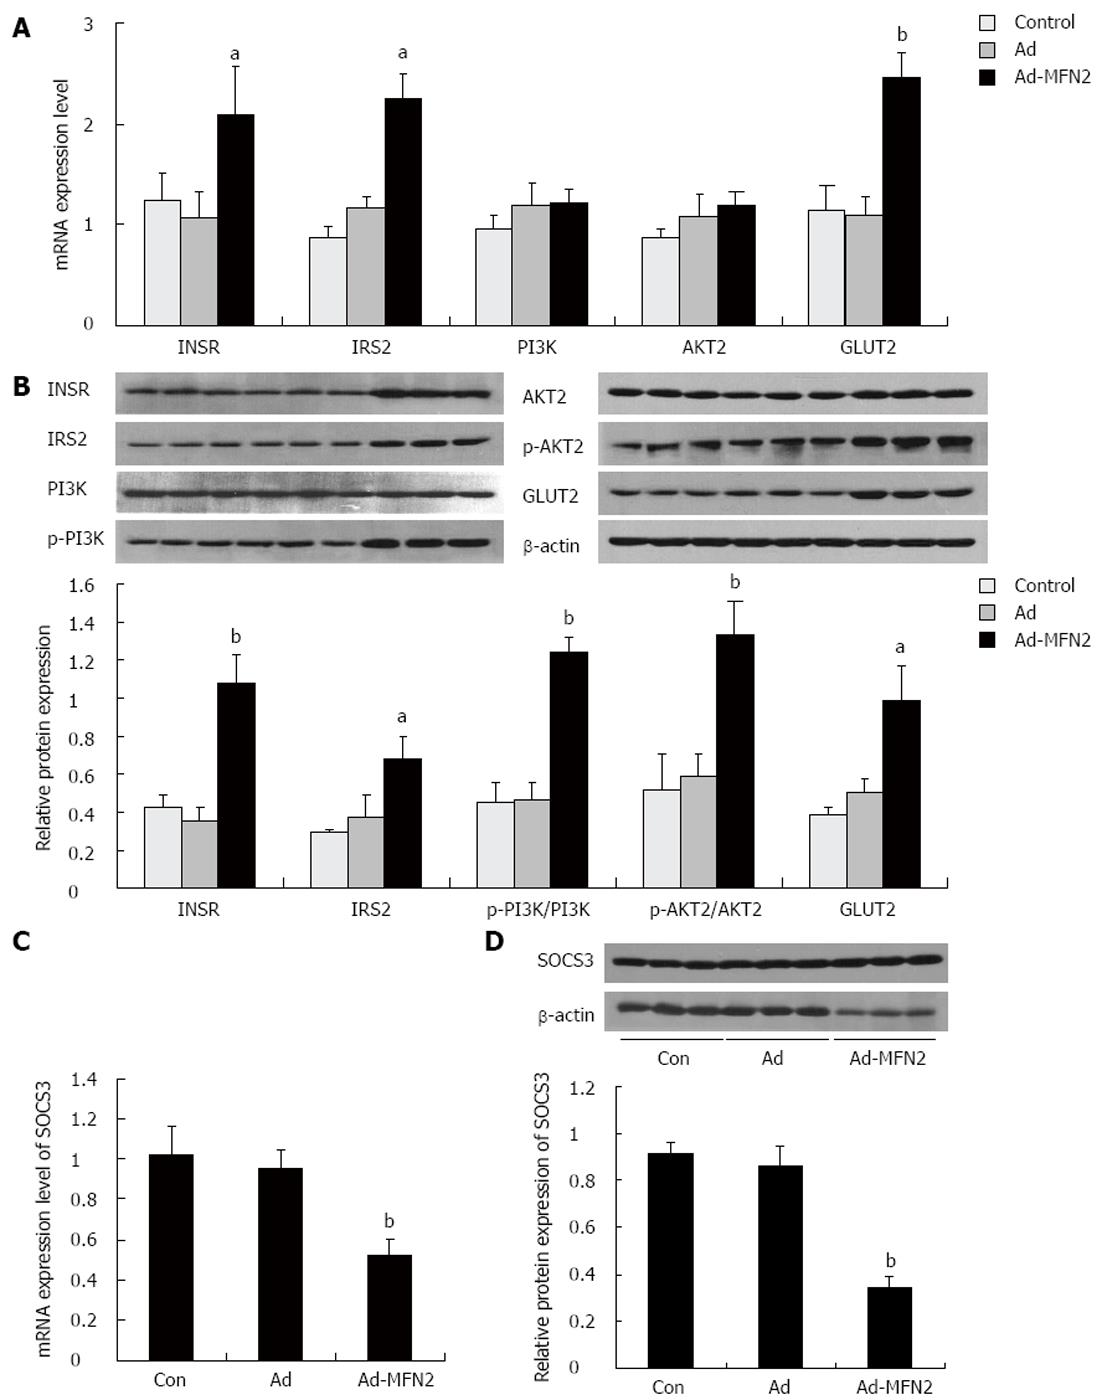
Figure 5 Mitofusin-2 over-expression up-regulated the expression of insulin pathway related genes in liver of rats.
Rats were fed with high-fat diets for 8 wk, and then were infected with Ad-mitofusin-2 (MFN2) or empty Ad adenovirus or phosphate-buffered saline (PBS) control for 3 wk. The expression levels of insulin receptor (INSR), insulin receptor substrate 2 (IRS2), phosphoinositide-3-kinase (PI3K), AKT2 and glucose transporter type 2 (GLUT2) were determined by quantitative real-time-polymerase chain reaction (RT-PCR) (A) and Western-blot (B). The phosphorylation levels of PI3K and AKT2 were assayed by Western-blotting (B). The expression level of suppressor of cytokine signaling 3 (SOCS3) was determined by quantitative RT-PCR (C) and Western-blot (D). aP < 0.05, bP < 0.01 vs Ad.
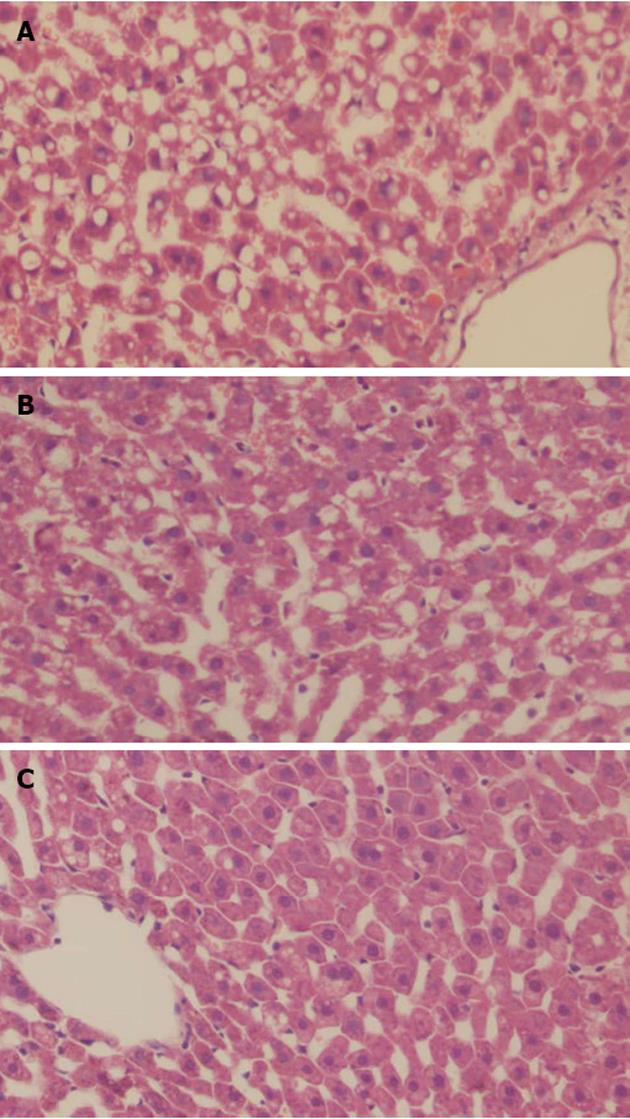
Figure 6 Over-expression of mitofusin-2 improves high-fat diets induced hepatic steatosis.
Histological analysis of liver sections from rats fed with high-fat diets infected with phosphate-buffered saline control (A), empty Ad adenovirus (B) or Ad-mitofusin 2 (C) for 3 wk (HE, × 200).
- Citation: Gan KX, Wang C, Chen JH, Zhu CJ, Song GY. Mitofusin-2 ameliorates high-fat diet-induced insulin resistance in liver of rats. World J Gastroenterol 2013; 19(10): 1572-1581
- URL: https://www.wjgnet.com/1007-9327/full/v19/i10/1572.htm
- DOI: https://dx.doi.org/10.3748/wjg.v19.i10.1572


