©2012 Baishideng Publishing Group Co.
World J Gastroenterol. Mar 7, 2012; 18(9): 923-929
Published online Mar 7, 2012. doi: 10.3748/wjg.v18.i9.923
Published online Mar 7, 2012. doi: 10.3748/wjg.v18.i9.923
Figure 1 Effect of high-fat-feeding on intestinal permeability.
Intestinal permeability in duodenum (A), jejunum (B), ileum (C), and colon (D) of high-fat-fed vs control mice. Permeability was measured in an Ussing chamber. Results are shown as per mille translocated dextran. Box plots show median, upper and lower quartiles, and Tukey’s whiskers (highest and lowest values, outliers shown as black dots). aP < 0.05 between high-fat and control.
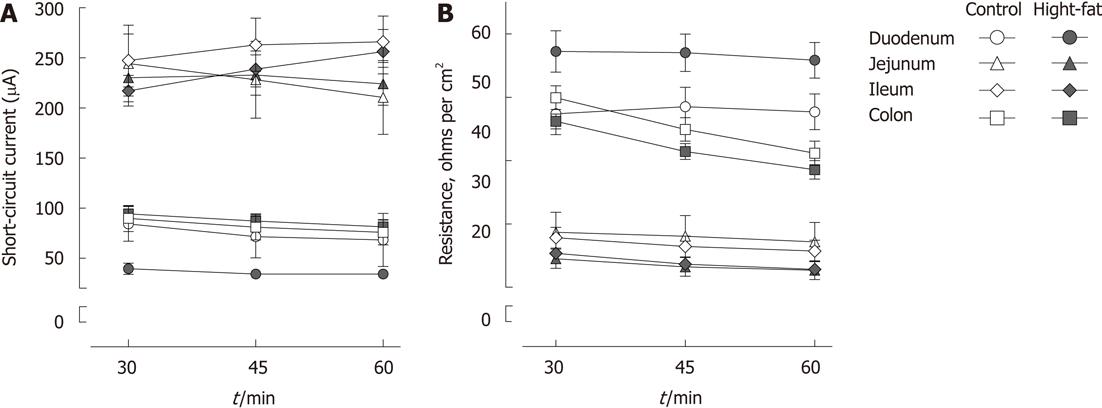
Figure 2 Stability of Ussing chamber experiments.
Short-circuit current (A) and resistance (B) in Ussing chamber experiments. Bars indicate mean and SEM. n = 9-15/group.
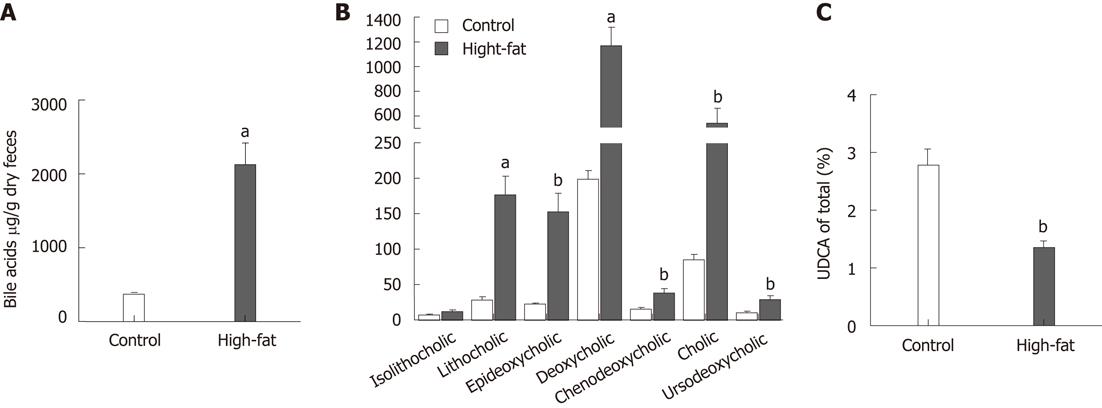
Figure 3 Fecal bile acids.
A: Concentration of total measured bile acids; B: Concentration of measured bile acids in feces; C: Proportion of ursodeoxycholic acid (UDCA) in total measured bile acids. Bars indicate mean and SEM. n = 6/group, aP < 0.001, bP < 0.01 between high-fat and control groups.
Figure 4 Correlation of proportion of ursodeoxycholic acid with intestinal permeability.
Pearson’s correlation of fecal proportion of ursodeoxycholic acid (UDCA) percentage to overall permeability of intestine (A), jejunal permeability (B), and colonic permeability (C). Each dot represents an individual animal.
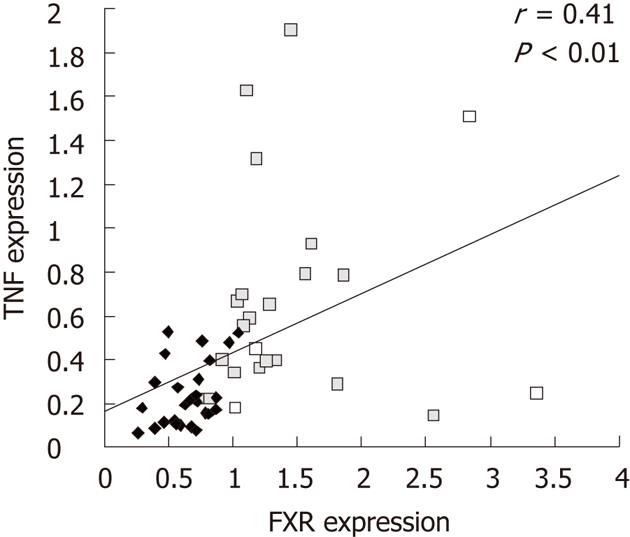
Figure 5 Correlation of tumor necrosis factor and farnesoid X receptor expression.
Pearson’s correlation of tumor necrosis factor (TNF) and farnesoid X receptor (FXR) expression. Jejunal values are shown as black diamonds and colonic values as grey squares. Each dot represents an individual animal.
- Citation: Stenman LK, Holma R, Korpela R. High-fat-induced intestinal permeability dysfunction associated with altered fecal bile acids. World J Gastroenterol 2012; 18(9): 923-929
- URL: https://www.wjgnet.com/1007-9327/full/v18/i9/923.htm
- DOI: https://dx.doi.org/10.3748/wjg.v18.i9.923


