Copyright
©2012 Baishideng Publishing Group Co.
World J Gastroenterol. Nov 7, 2012; 18(41): 5897-5904
Published online Nov 7, 2012. doi: 10.3748/wjg.v18.i41.5897
Published online Nov 7, 2012. doi: 10.3748/wjg.v18.i41.5897
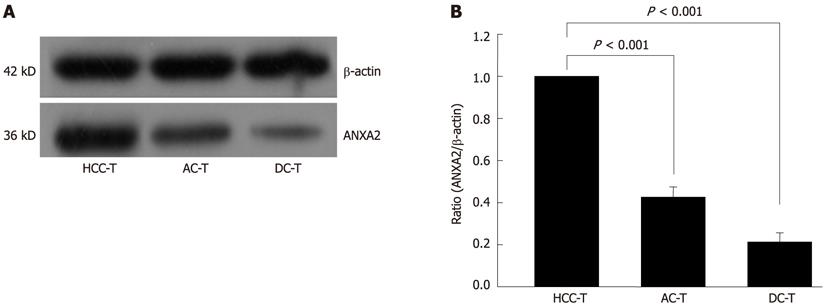
Figure 1 Annexin A2 protein level in liver tissue of hepatocellular carcinoma.
A: Representative images of Western blotting. The protein levels of annexin A2 (ANXA2) and β-actin were detected and the latter served as the control; B: The statistical results indicated that the level of ANXA2 expression was obviously increased in hepatocellular carcinoma (HCC) tissues compared with the matched adjacent- or the distant-cancerous tissues (P < 0.001). Three independent experiments were repeated, and the results are given as mean ± SD. HCC-T: HCC tissues; AC-T: Adjacent cancerous tissues; DC-T: Distant cancerous tissues.
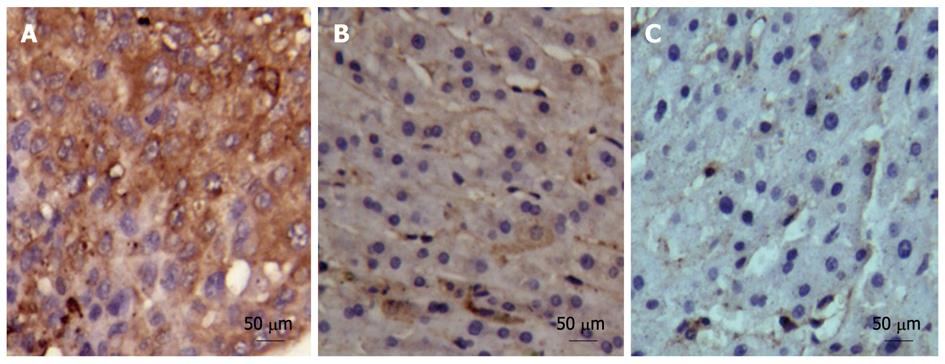
Figure 2 Immunohistochemistry of hepatic annexin A2 expression and distribution.
Representative images of immunohistochemistry in the hepatocellular carcinoma (HCC), self-controlled adjacent- and distant- cancerous tissues (400 × magnification). A: Hepatocyte annexin A2 (ANXA2) expression in HCC tissue; B: Hepatocyte ANXA2 expression in matched adjacent cancerous tissue; C: Hepatocyte ANXA2 expression in matched distant cancerous tissue. The level of ANXA2 expression was obviously increased in HCC tissues compared with that in the matched adjacent- or the distant-cancerous tissues.
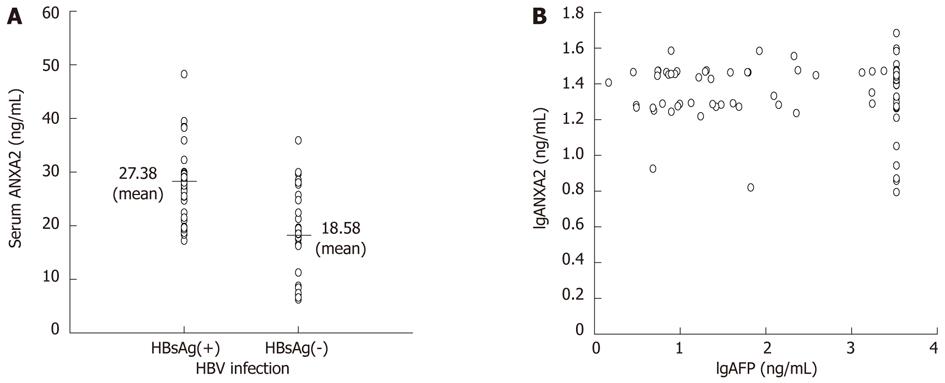
Figure 3 Relationship between serum annexin A2 level and hepatitis B virus infection or serum α-fetoprotein level in hepatocellular carcinoma patients.
A: The scatter figure indicated that serum annexin A2 (ANXA2) level was obviously correlated with hepatitis B virus (HBV) infection. The serum ANXA2 level in hepatocellular carcinoma (HCC) patients was higher (t = 6.820, P < 0.001) in the positive-surface antigen of the HBV (HBsAg) group than that in the negative-HBsAg group; B: The scatter figure of denary logarithm indicated no significant correlation between serum ANXA2 and α-fetoprotein (AFP) level in HCC patients.
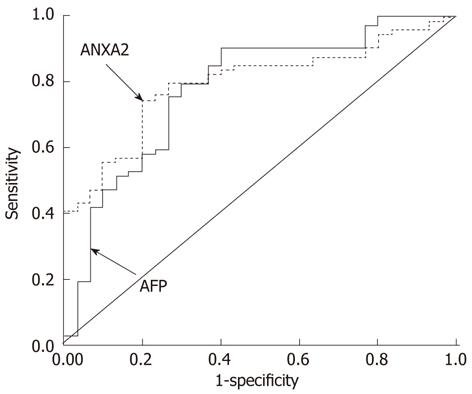
Figure 4 Receiver operating characteristic curves for circulating annexin A2 level in hepatocellular carcinoma diagnosis.
The area under the receiver operating characteristic curves was 0.782 for α-fetoprotein (AFP) and 0.796 for annexin A2 (ANXA2).
- Citation: Zhang HJ, Yao DF, Yao M, Huang H, Wu W, Yan MJ, Yan XD, Chen J. Expression characteristics and diagnostic value of annexin A2 in hepatocellular carcinoma. World J Gastroenterol 2012; 18(41): 5897-5904
- URL: https://www.wjgnet.com/1007-9327/full/v18/i41/5897.htm
- DOI: https://dx.doi.org/10.3748/wjg.v18.i41.5897


