Copyright
©2012 Baishideng Publishing Group Co.
World J Gastroenterol. Oct 7, 2012; 18(37): 5151-5163
Published online Oct 7, 2012. doi: 10.3748/wjg.v18.i37.5151
Published online Oct 7, 2012. doi: 10.3748/wjg.v18.i37.5151
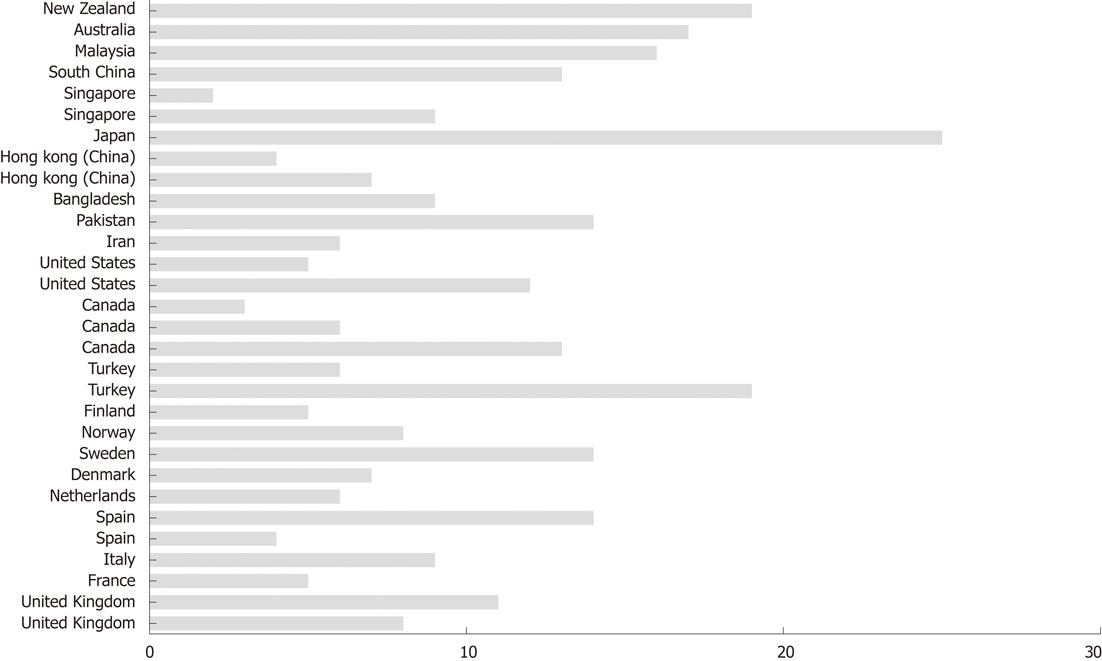
Figure 1 The prevalence of irritable bowel syndrome according to Rome criteria in different countries.
Reproduced from reference [1] with permission from Nova Science Publisher, Inc.
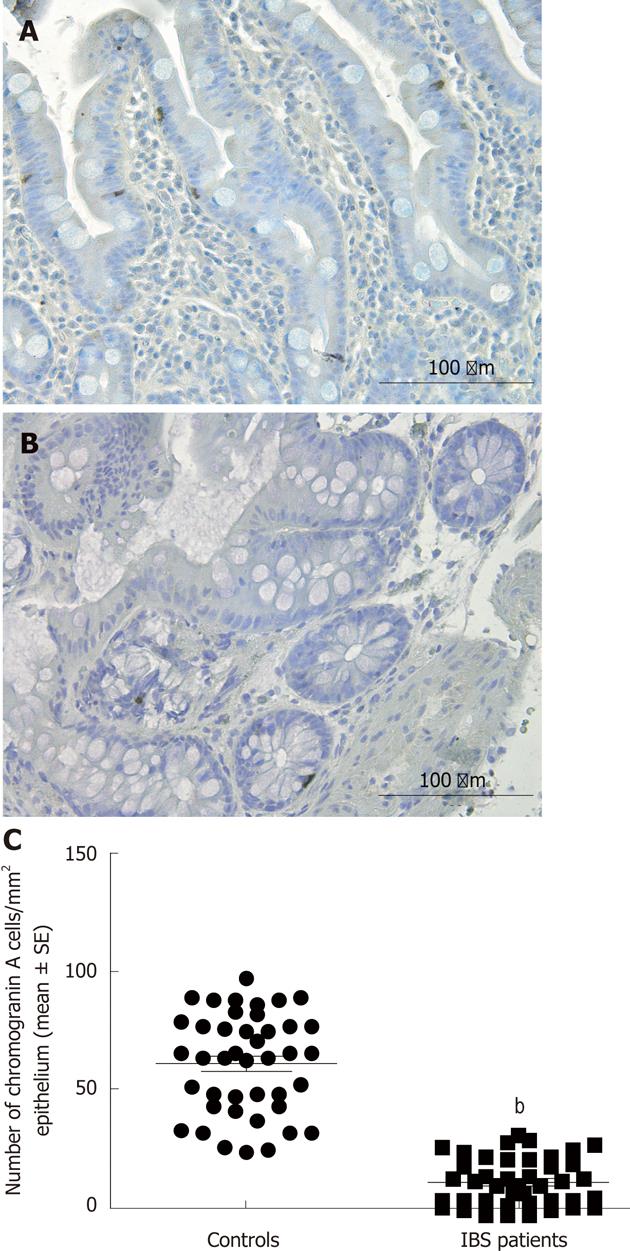
Figure 2 Chromogranin A cells in the duodenum.
A: A healthy subject; B: A patient with irritable bowel syndrome (IBS); C: Controls and IBS patients. Reproduced from reference [1] with permission from Nova Science Publisher, Inc. bP < 0.01 vs control group.
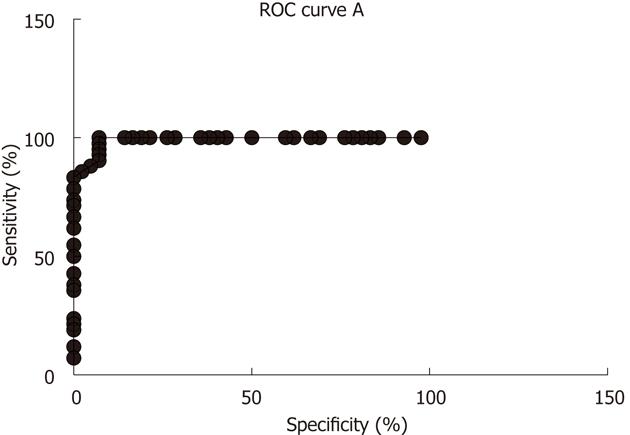
Figure 3 Receiver-operator characteristic for chromogranin A cell density in the duodenum.
Reproduced from reference [1] with permission from Nova Science Publisher, Inc. ROC: Receiver-operator characteristic.
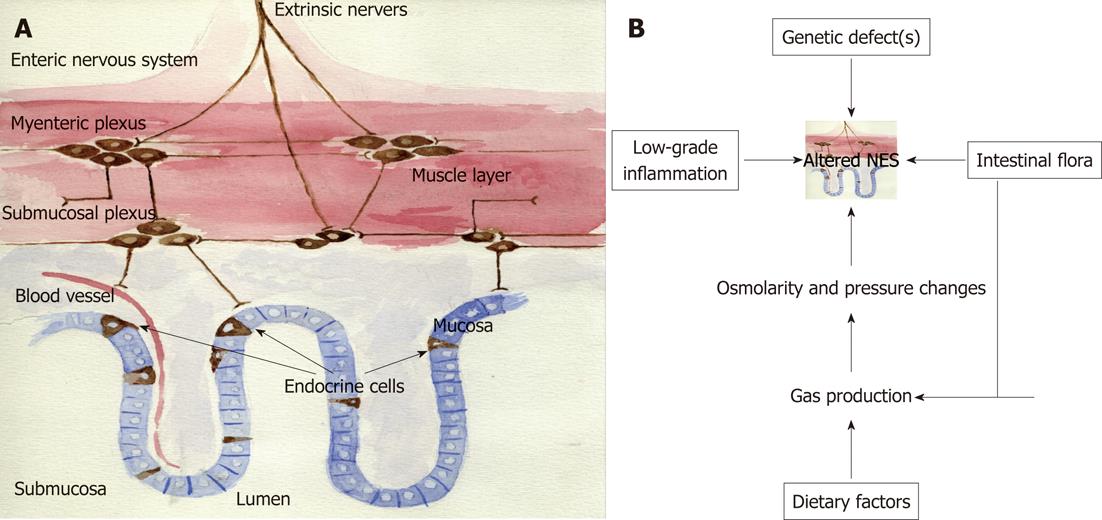
Figure 4 Schematic drawing to illustrate the neuroendocrine system of the gut and the possible pathogenesis of irritable bowel syndrome.
A: Schematic drawing of neuroendocrine system; B: Possible pathogenesis of irritable bowel syndrome. Reproduced from reference [1] with permission from Nova Science Publisher, Inc. NES: Neuroendocrine system.
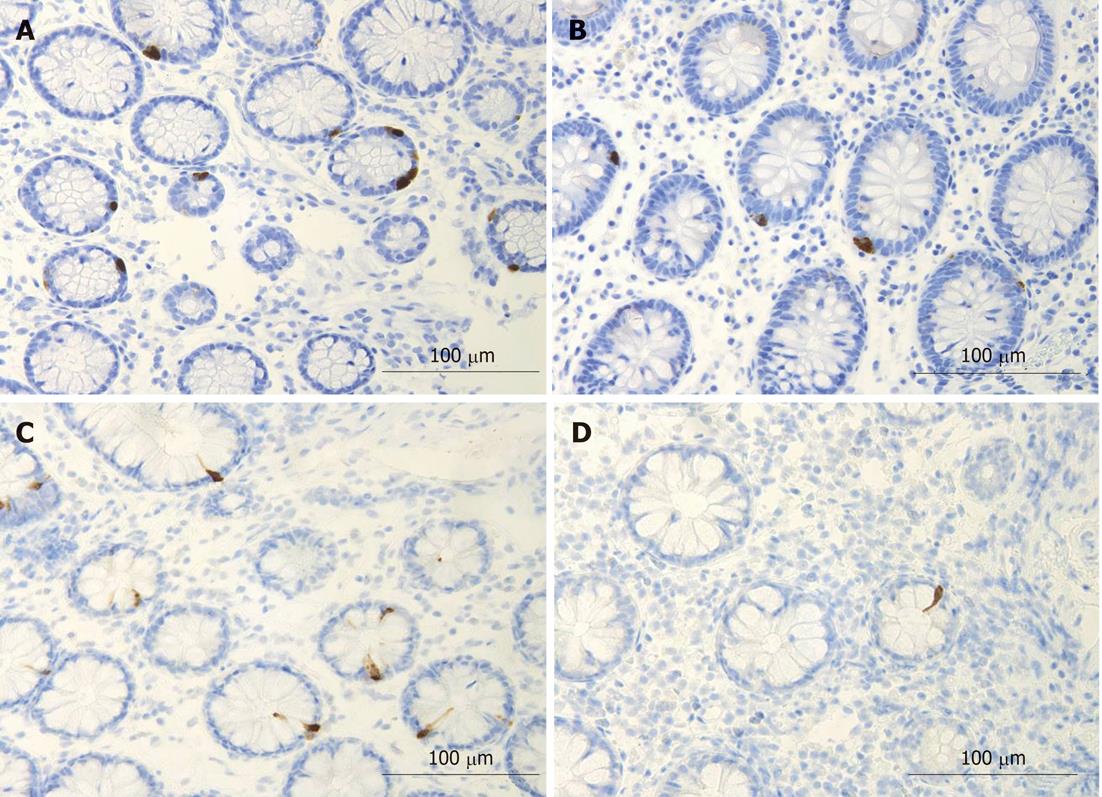
Figure 5 Serotonin cells and polypeptide YY immunoreactive cells in the colon.
A: A healthy control in serotonin cells; B: A patient with irritable bowel syndrome in serotonin cells; C: A healthy subject in polypeptide YY (PYY) immunoreactive cells; D: An irritable bowel syndrome patient in PYY immunoreactive cells. Reproduced from reference 1 with permission from Nova Science Publisher, Inc.
- Citation: El-Salhy M. Irritable bowel syndrome: Diagnosis and pathogenesis. World J Gastroenterol 2012; 18(37): 5151-5163
- URL: https://www.wjgnet.com/1007-9327/full/v18/i37/5151.htm
- DOI: https://dx.doi.org/10.3748/wjg.v18.i37.5151


