Copyright
©2012 Baishideng Publishing Group Co.
World J Gastroenterol. Sep 21, 2012; 18(35): 4944-4958
Published online Sep 21, 2012. doi: 10.3748/wjg.v18.i35.4944
Published online Sep 21, 2012. doi: 10.3748/wjg.v18.i35.4944
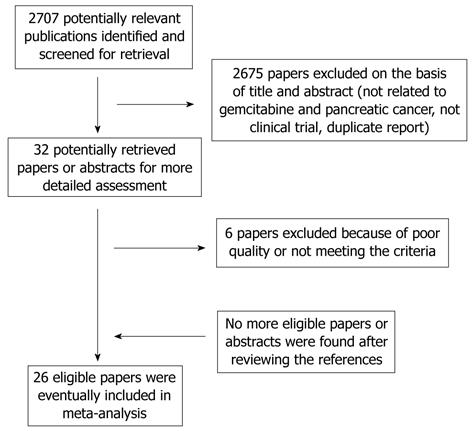
Figure 1 Flow chart of study selection.
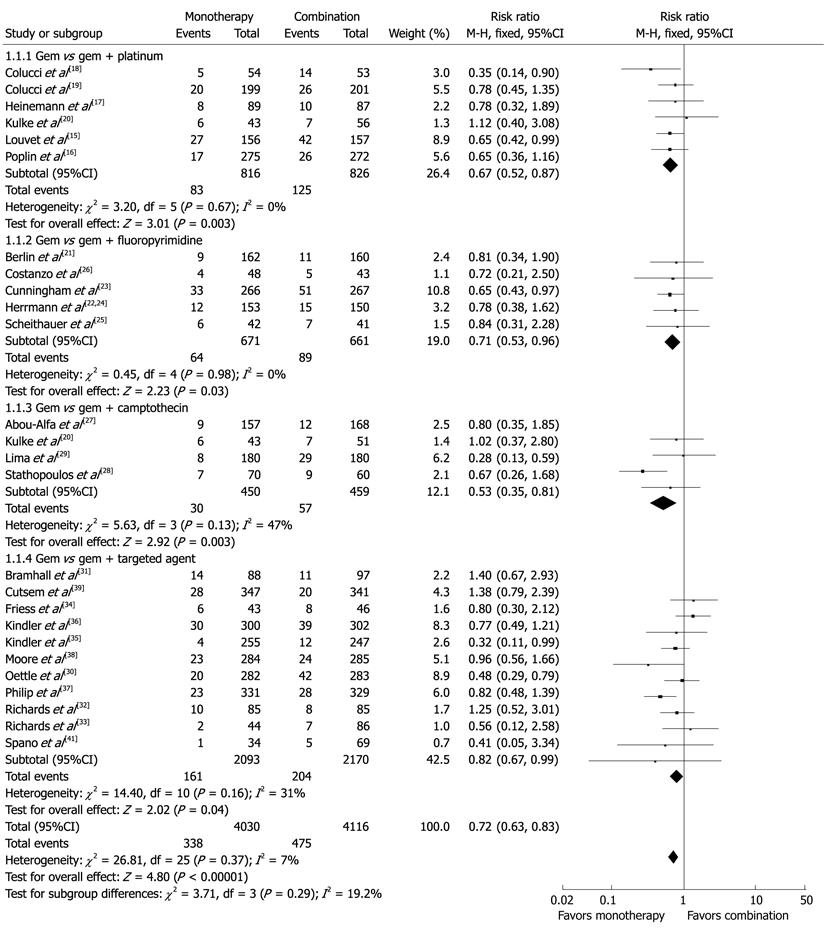
Figure 2 Fixed effect model of risk ratio of objective response rate.
CI: Confidence interval.
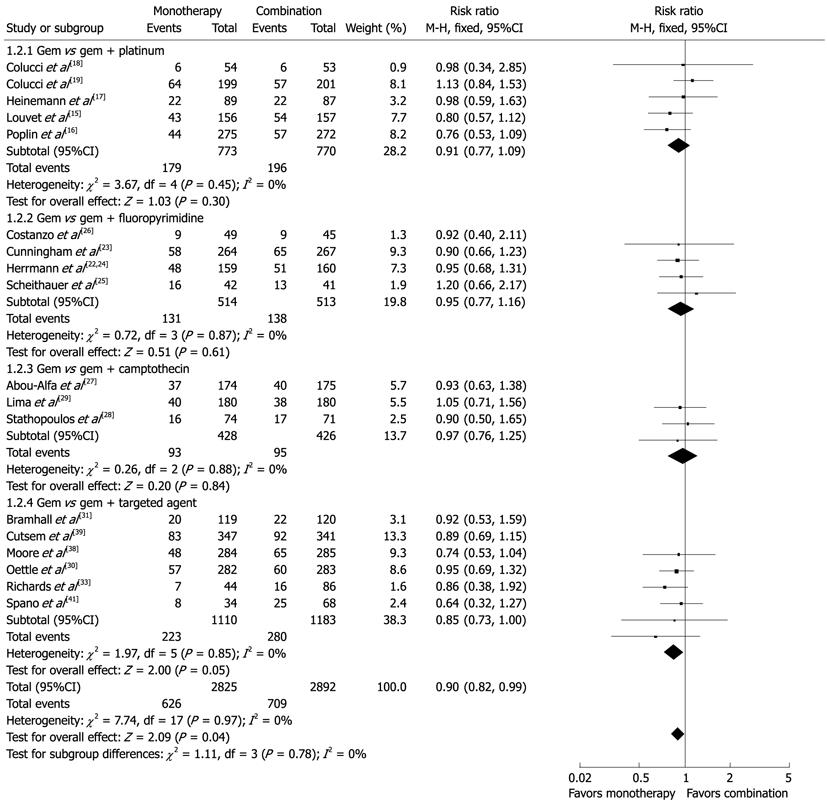
Figure 3 Fixed effect model of risk ratio of 1-year overall survival rate.
CI: Confidence interval.
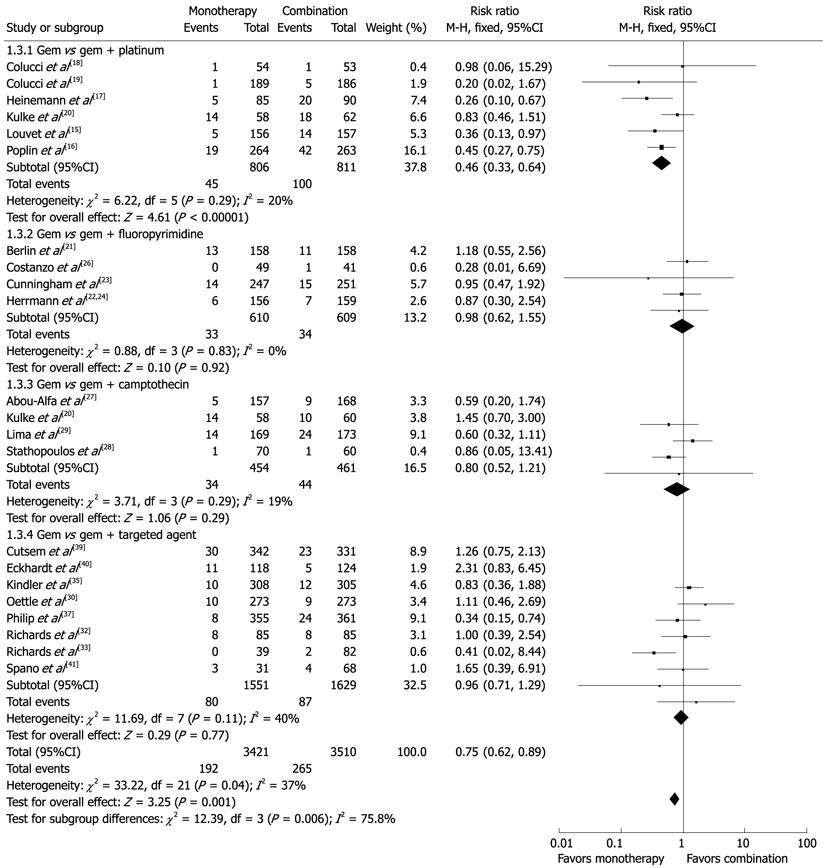
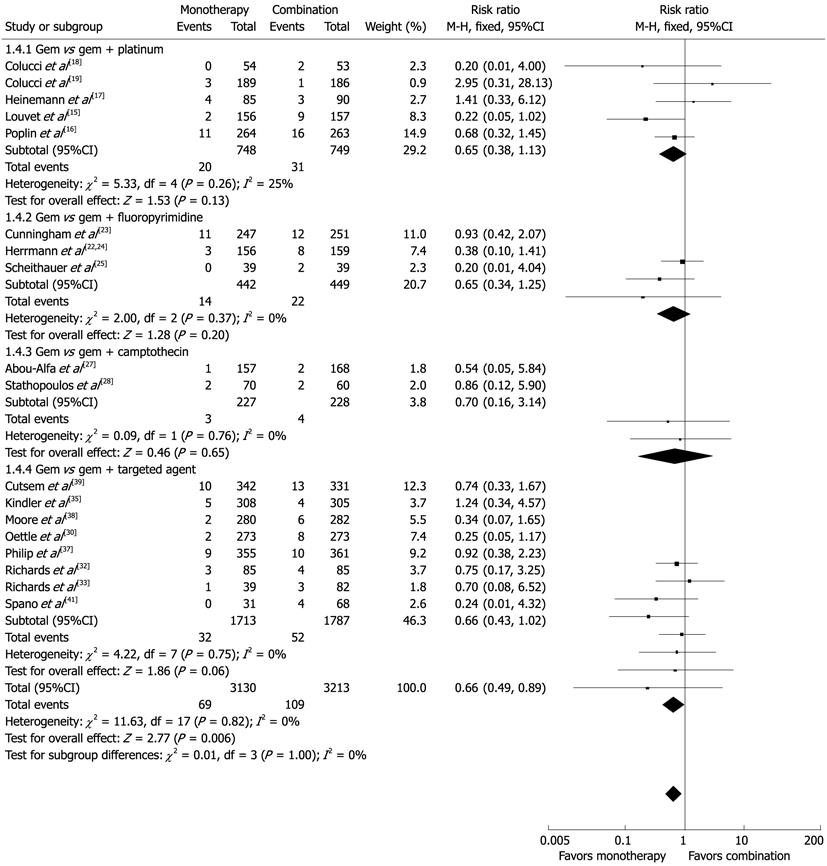
Figure 4 Fixed effect model of risk ratio of grade 3 or 4 vomiting.
CI: Confidence interval.
Figure 5 Fixed effect model of risk ratio of grade 3 or 4 diarrhea.
CI: Confidence interval.
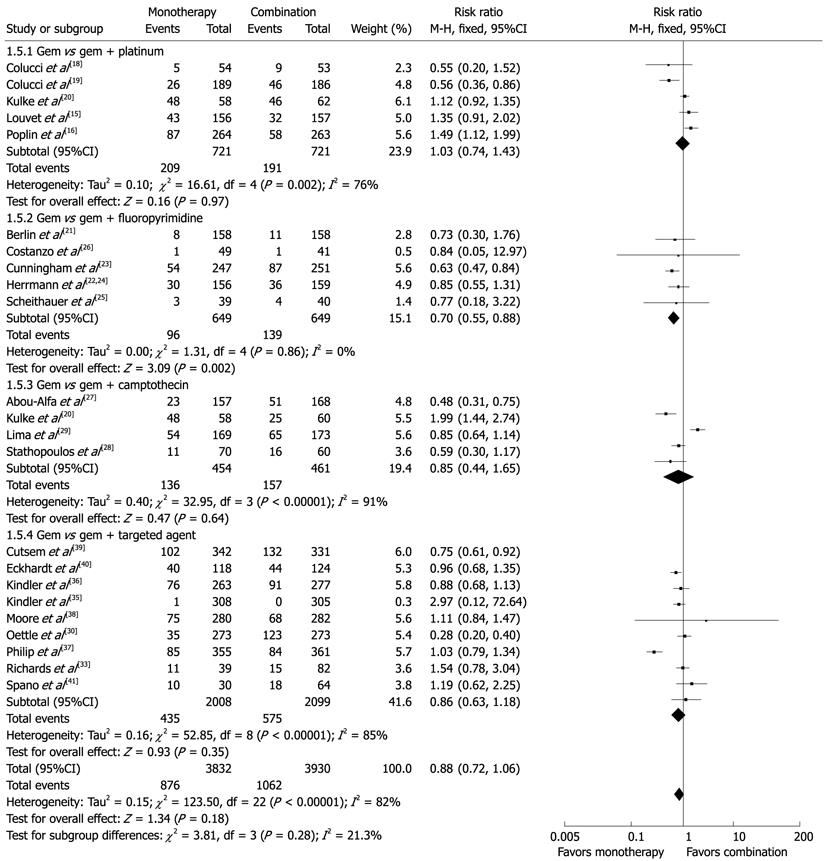
Figure 6 Random effect model of risk ratio of grade 3 or 4 neutropenia.
CI: Confidence interval.
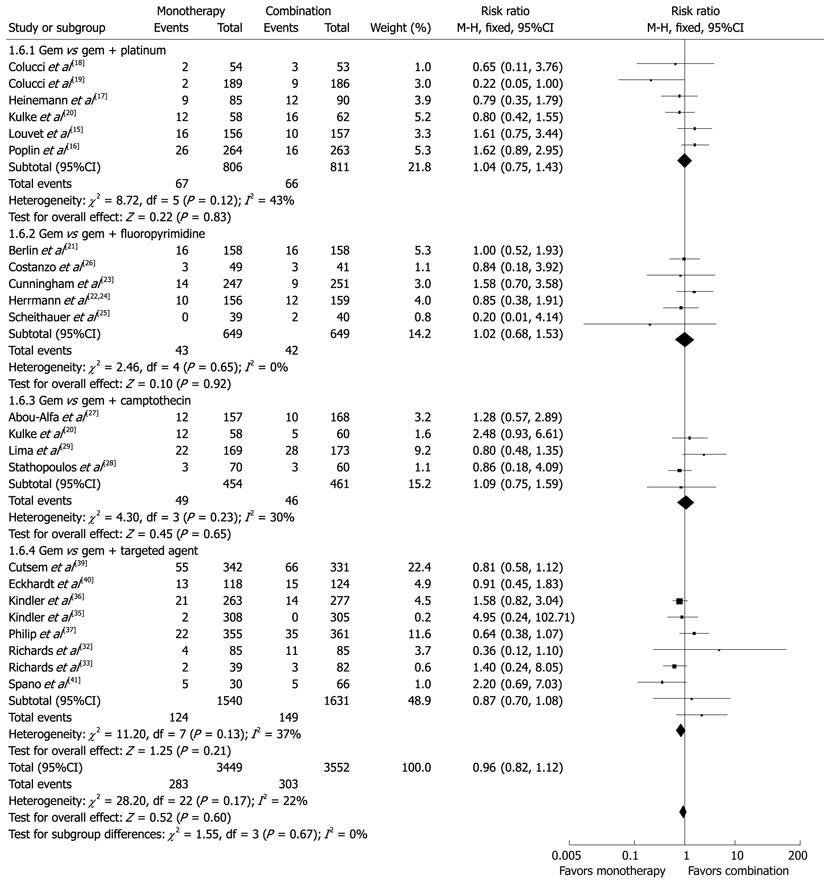
Figure 7 Fixed effect model of risk ratio of grade 3 or 4 anemia.
CI: Confidence interval.
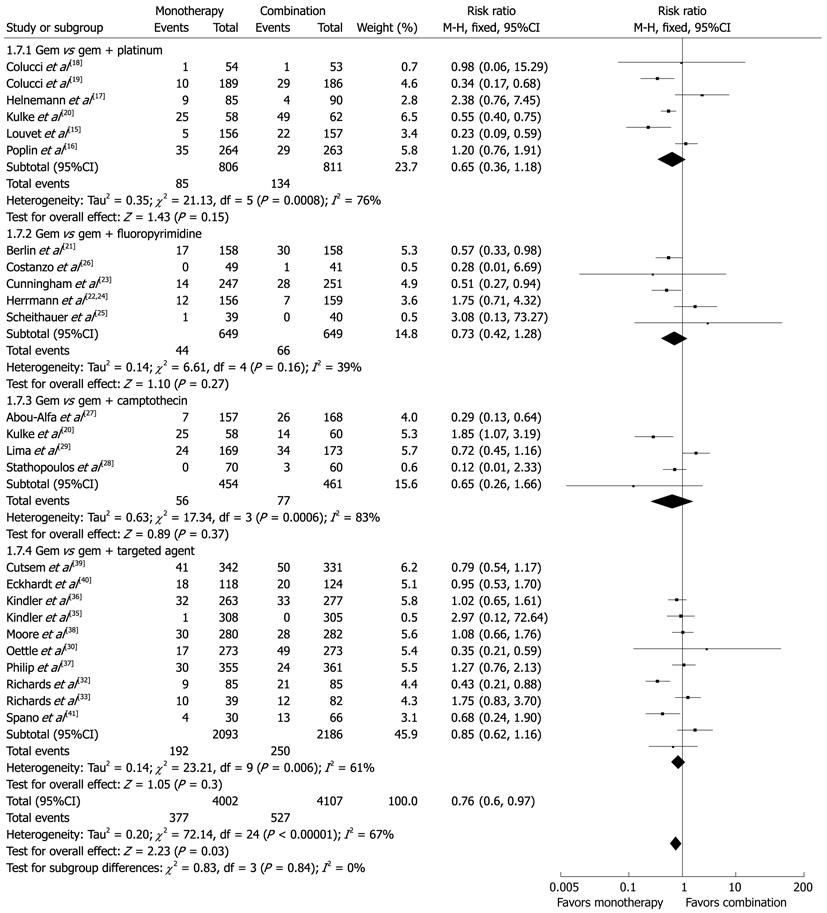
Figure 8 Random effect model of risk ratio of grade 3 or 4 thrombocytopenia.
CI: Confidence interval.
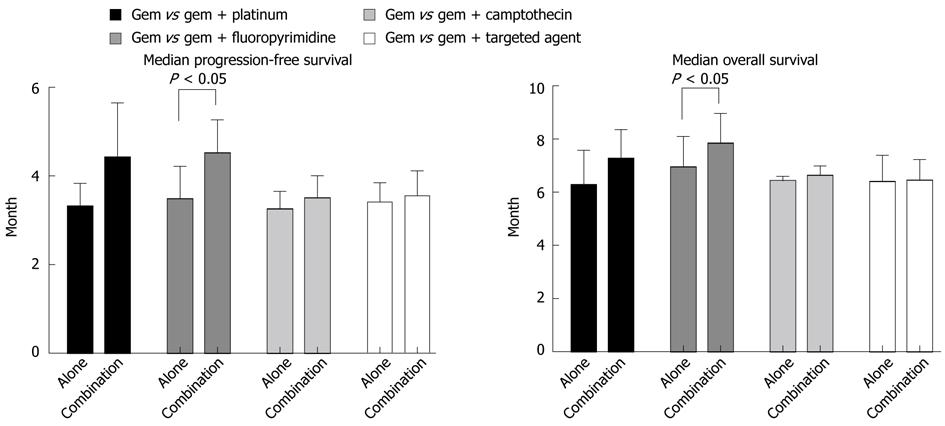
Figure 9 Median progression-free survival and overall survival between gem-monotherapy and combination therapy.
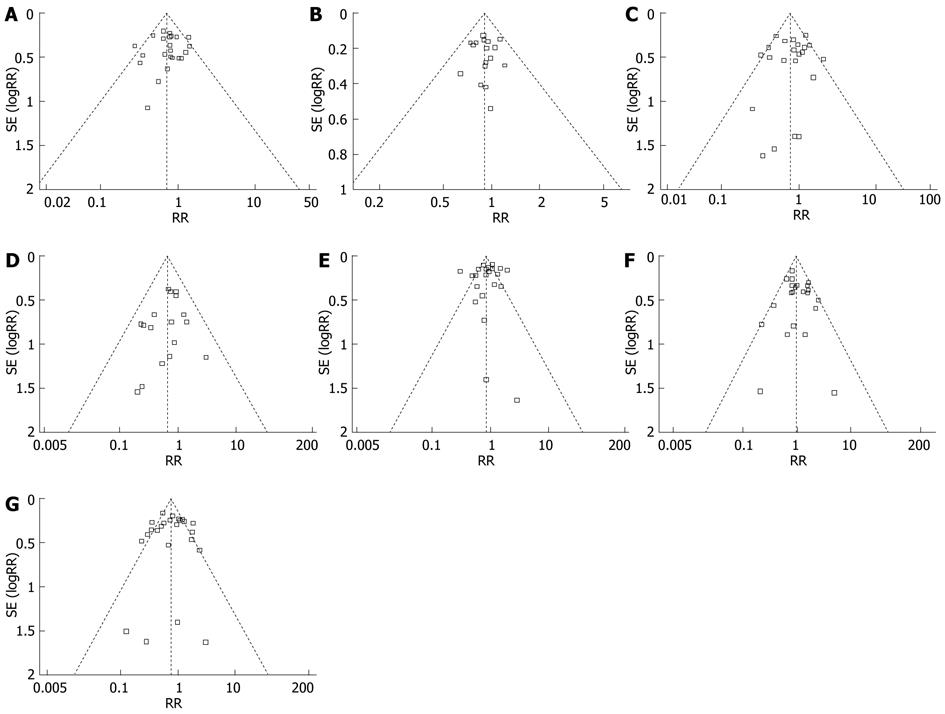
Figure 10 Funnel plots.
A: Objective response rate; B: 1-year overall survival rate; C: Vomiting; D: Diarrhea; E: Neutropenia; F: Anemia; G: Thrombocytopenia. RR: Risk ratio.
- Citation: Sun C, Ansari D, Andersson R, Wu DQ. Does gemcitabine-based combination therapy improve the prognosis of unresectable pancreatic cancer? World J Gastroenterol 2012; 18(35): 4944-4958
- URL: https://www.wjgnet.com/1007-9327/full/v18/i35/4944.htm
- DOI: https://dx.doi.org/10.3748/wjg.v18.i35.4944


