Copyright
©2012 Baishideng Publishing Group Co.
World J Gastroenterol. Jul 14, 2012; 18(26): 3435-3442
Published online Jul 14, 2012. doi: 10.3748/wjg.v18.i26.3435
Published online Jul 14, 2012. doi: 10.3748/wjg.v18.i26.3435
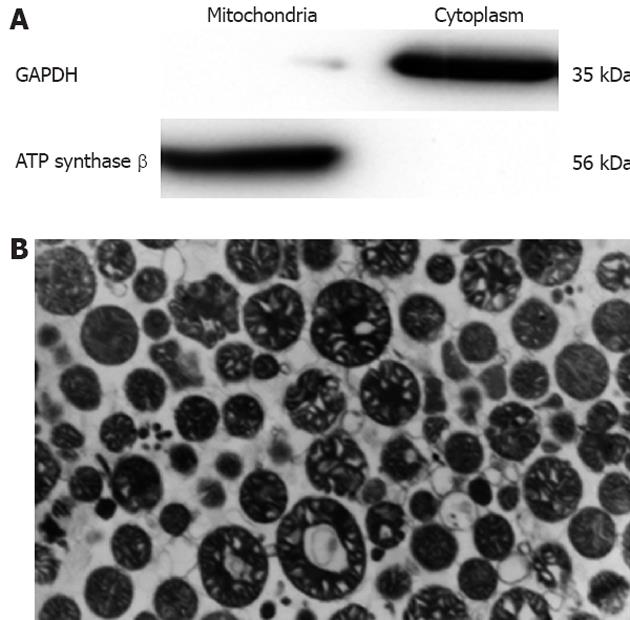
Figure 1 Measurement of mitochondrial purity by Western blotting and transmission electron microscopy.
A: Glyceraldehyde-3-phosphate dehydrogenase is an indicator of cytoplasm and ATP synthase an indicator of mitochondria; B: Image of products purified by Nycodenz gradient centrifugation.
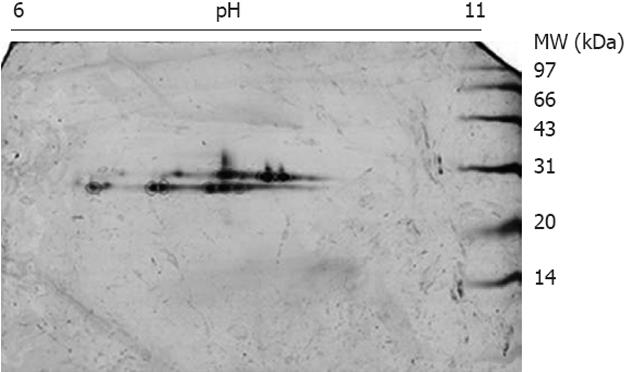
Figure 2 Two dimensional electrophoresis image of proteins purified by glutathione-affinity chromatography.
The mitochondrial proteins enriched by glyceraldehyde affinity column were separated in two dimensional electrophoresis with pH 6-11 strips and 15% sodium dodecyl sulfate polyacrylamide gel electrophoresis. The string sports around molecular weight (MW) 28 kDa appeared on the gels labeled by circles were identified.
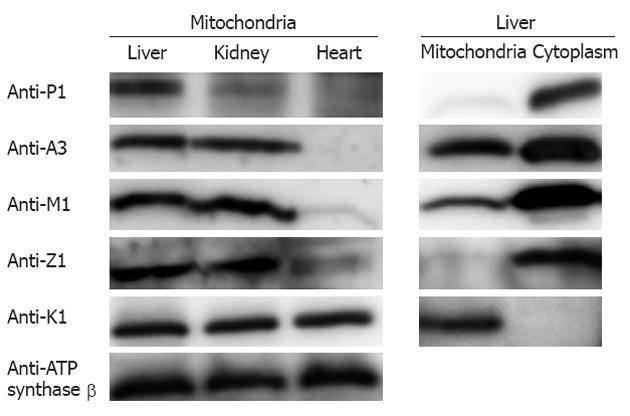
Figure 3 The distribution of glutathione S-transferases in mouse tissue mitochondria, as measured by Western blotting.
A total of 20 μg mitochondrial and cytoplasmic protein from mouse heart, kidney, and liver were loaded in each lane. Left: Glutathione S-transferases (GSTs) in mouse tissue mitochondria; Right: GSTs in liver mitochondria and cytoplasm.
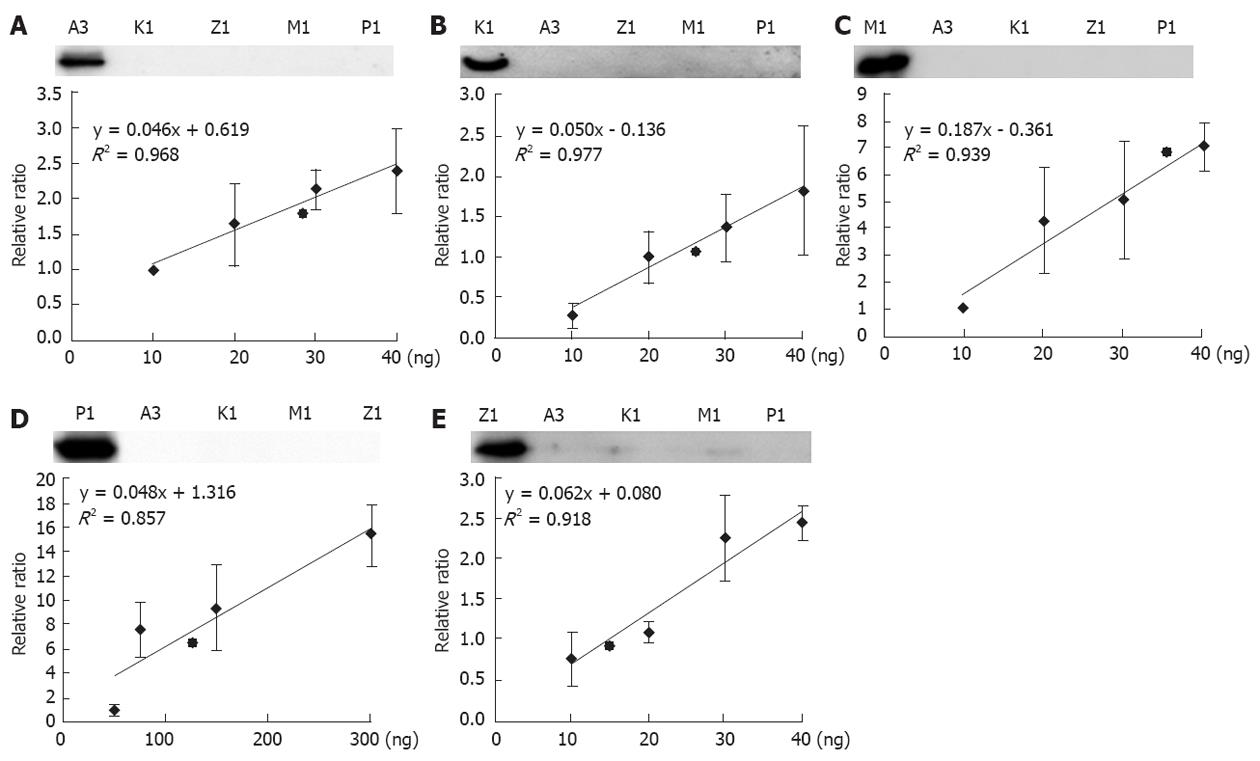
Figure 4 The calibration curves of mitochondrial glutathione S-transferase proteins.
Upper panel in A, B, C, D, E: Examination of the specificity of the five glutathione S-transferase (GST) antibodies, 2 ng of the corresponding GST was loaded in all of the left lanes, and 20 ng of the other unrelated GSTs was loaded in the other four lanes; Lower panel in A, B, C, D, E: The X-axis represents the amounts of recombinant GSTs loaded (ng), and the y-axis represents the relative intensity of the Western blotting, taking the signals generated from the lowest GST amount as the reference. The calibration curves were generated by regression. Insert: The linear equations and R2 were generated by regression.
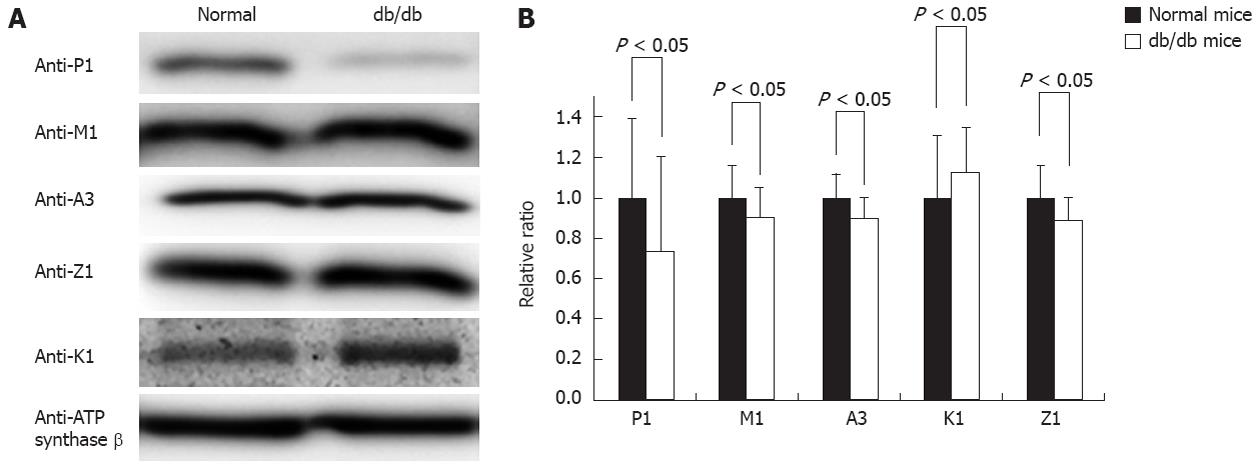
Figure 5 Comparison of mitochondrial glutathione S-transferase abundances between normal and diabetic mice by Western blotting.
A: A typical image of a Western blotting comparing a pair of mouse liver mitochondria from normal and diabetic mice. Approximately 20 μg mitochondrial proteins were loaded in each lane. Anti-ATP synthase β acted as a control to normalize the loading; B: The statistical comparison of the relative ratio of mitochondrial glutathione S-transferases (GSTs) between normal and diabetic mouse liver when normalized by the GSTs in normal mice (n = 3).
- Citation: Sun HD, Ru YW, Zhang DJ, Yin SY, Yin L, Xie YY, Guan YF, Liu SQ. Proteomic analysis of glutathione S-transferase isoforms in mouse liver mitochondria. World J Gastroenterol 2012; 18(26): 3435-3442
- URL: https://www.wjgnet.com/1007-9327/full/v18/i26/3435.htm
- DOI: https://dx.doi.org/10.3748/wjg.v18.i26.3435


