Copyright
©2012 Baishideng Publishing Group Co.
World J Gastroenterol. Jun 14, 2012; 18(22): 2775-2783
Published online Jun 14, 2012. doi: 10.3748/wjg.v18.i22.2775
Published online Jun 14, 2012. doi: 10.3748/wjg.v18.i22.2775
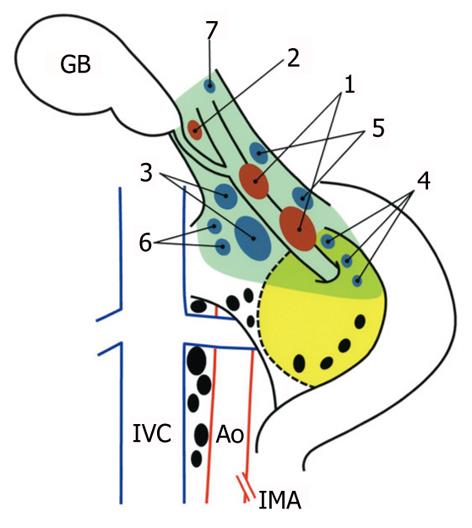
Figure 1 Topographical distribution of the regional lymph nodes of the gallbladder, shown after a full Kocher maneuver.
Solid ellipses represent individual lymph nodes: first-echelon nodes (red), second-echelon nodes (blue), and more distant nodes (black). The yellow painted area represents the head of the pancreas, and the dashed line indicates the border of the uncinate process of the pancreas. Arabic numerals indicate each of the first- and second-echelon node groups: (1) pericholedochal, nodes along the common bile duct; (2) cystic duct, node(s) along the cystic duct; (3) retroportal, nodes posterior to the portal vein and cephalad to the uncinate process; (4) posterior superior pancreaticoduodenal, nodes on the posterosuperior aspect of the head of the pancreas; (5) hepatic artery, nodes along the common or proper hepatic artery; (6) right celiac, nodes located right of the celiac axis and posterior to the common hepatic artery; and (7) hilar, nodes within the porta hepatis. The pale green area indicates the extent of a typical “extended” portal lymph node dissection (en bloc removal of the first- and second-echelon node groups) in the study department. GB: Gallbladder; IVC: Inferior vena cava; Ao: Aorta; IMA: Inferior mesenteric artery.
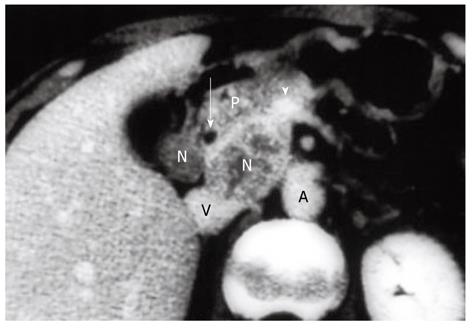
Figure 2 Computed tomography revealing enlarged peripancreatic nodes with heterogeneous contrast enhancement (N).
Note that the posterior superior pancreaticoduodenal node (N, left) and the retroportal node (N, right) are adhered to the head of the pancreas (P). The latter node shifts the portal vein (arrowhead) in a right-upper direction. Histological examination confirmed metastases in 10 regional nodes, some of which had invaded the pancreatic parenchyma. This patient remains well with no evidence of disease at 15 years after a pancreaticoduodenectomy combined with wedge resection of the gallbladder fossa. The arrow indicates common bile duct; V: Inferior vena cava; A: Aorta.
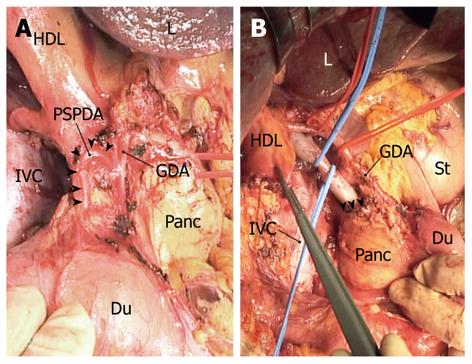
Figure 3 Photographs taken during an “extended” portal lymph node dissection.
A: The posterior superior pancreaticoduodenal artery (PSPDA; arrowheads) is shown following dissection of the posterior superior pancreaticoduodenal nodes. The common hepatic artery is secured with the red loop; B: The superior border of the uncinate process (arrowheads) is exposed, ensuring that dissection of the retroportal nodes is complete. The common bile duct was already transected at the level of PSPDA. The blue loops secure the portal vein, whereas the red loops secure the hepatic arteries. A forceps is picking up the node-bearing adipose tissues dissected en bloc. L: Liver; HDL: Hepatoduodenal ligament; GDA: Gastroduodenal artery; IVC: Inferior vena cava; Panc: Head of the pancreas; Du: Duodenum; St: Stomach.
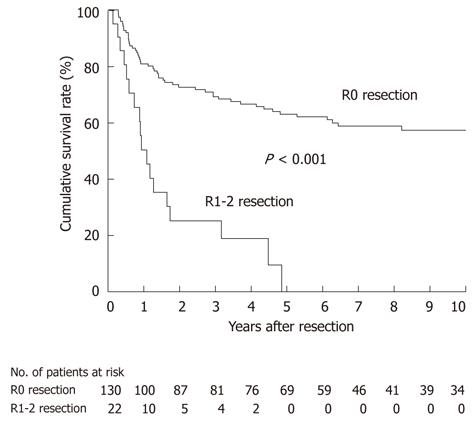
Figure 4 Kaplan-Meier disease-specific survival estimates stratified for residual tumor (R) status in all 152 patients.
The median survival was not reached with a 5-year survival rate of 63% in patients undergoing an R0 resection, whereas it was 13 mo with a 5-year survival rate of 0% in patients undergoing an R1-2 resection.
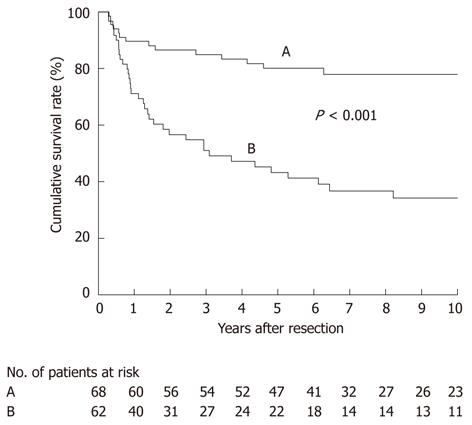
Figure 5 Kaplan-Meier disease-specific survival estimates stratified for nodal status in 130 patients who underwent an R0 resection.
A, without nodal disease; B, with nodal disease.
- Citation: Shirai Y, Wakai T, Sakata J, Hatakeyama K. Regional lymphadenectomy for gallbladder cancer: Rational extent, technical details, and patient outcomes. World J Gastroenterol 2012; 18(22): 2775-2783
- URL: https://www.wjgnet.com/1007-9327/full/v18/i22/2775.htm
- DOI: https://dx.doi.org/10.3748/wjg.v18.i22.2775


