Copyright
©2012 Baishideng Publishing Group Co.
World J Gastroenterol. Jun 7, 2012; 18(21): 2640-2648
Published online Jun 7, 2012. doi: 10.3748/wjg.v18.i21.2640
Published online Jun 7, 2012. doi: 10.3748/wjg.v18.i21.2640
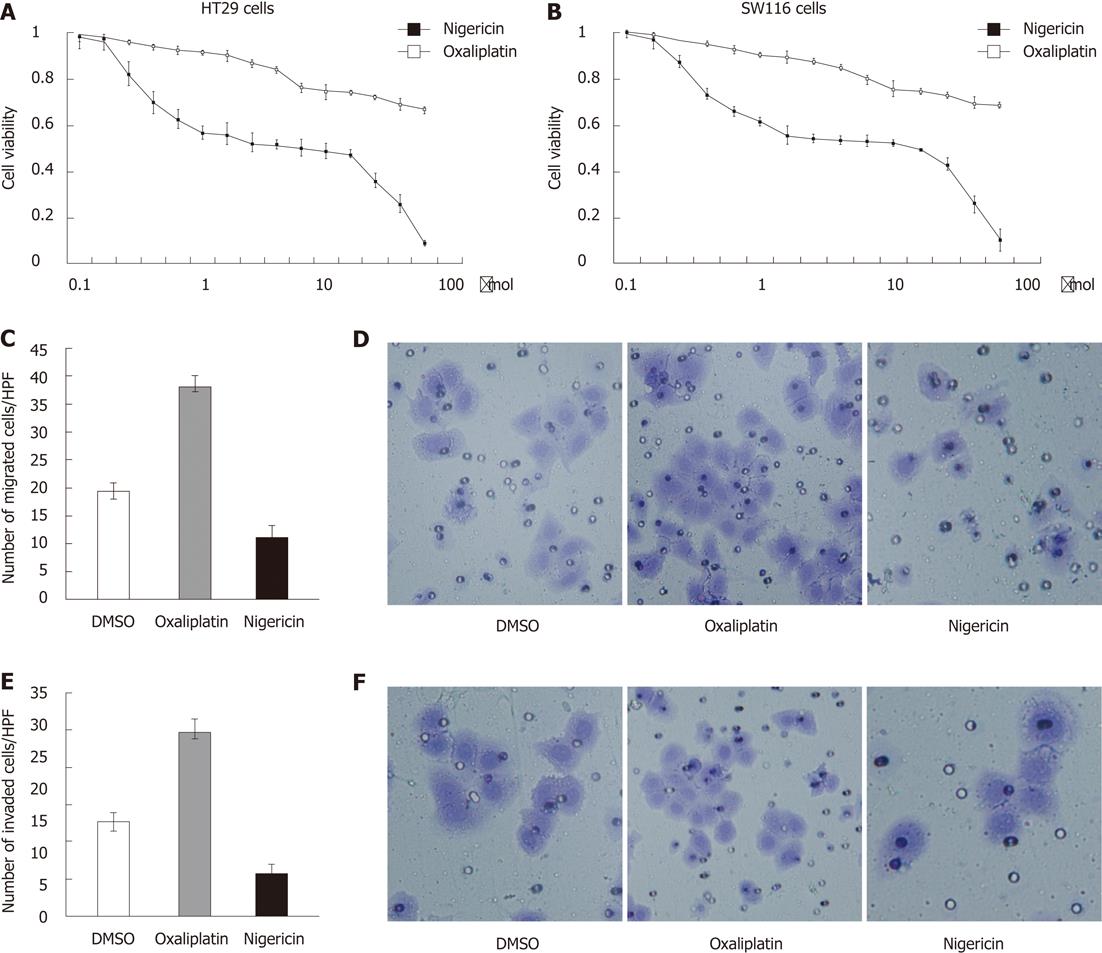
Figure 1 Nigericin inhibits tumor growth and metastasis.
A: Dose-response curves of HT29 cells treated with nigericin and oxaliplatin. Bars denote SD (n = 5); B: Dose-response curves of SW116 cells treated with nigericin and oxaliplatin. Bars denote SD (n = 5); C: Boyden chamber assays were done to compare the migratory capacities of HT29 cells treated with oxaliplatin and nigericin. Bars denote SD (n = 5); D: Also shown are phase-contrast images of HT29 cells migrating through the collagen membrane; E: Numbers of cells invading through the Matrigel-coated hydrophobic polyvinylidene fluoride membrane after treatment with the indicated compounds. Bars denote SD (n = 5); F: Images of HT29 cells migrating through the collagen membrane are also shown. DMSO: Dimethylsulfoxide; HPF: High-power field.
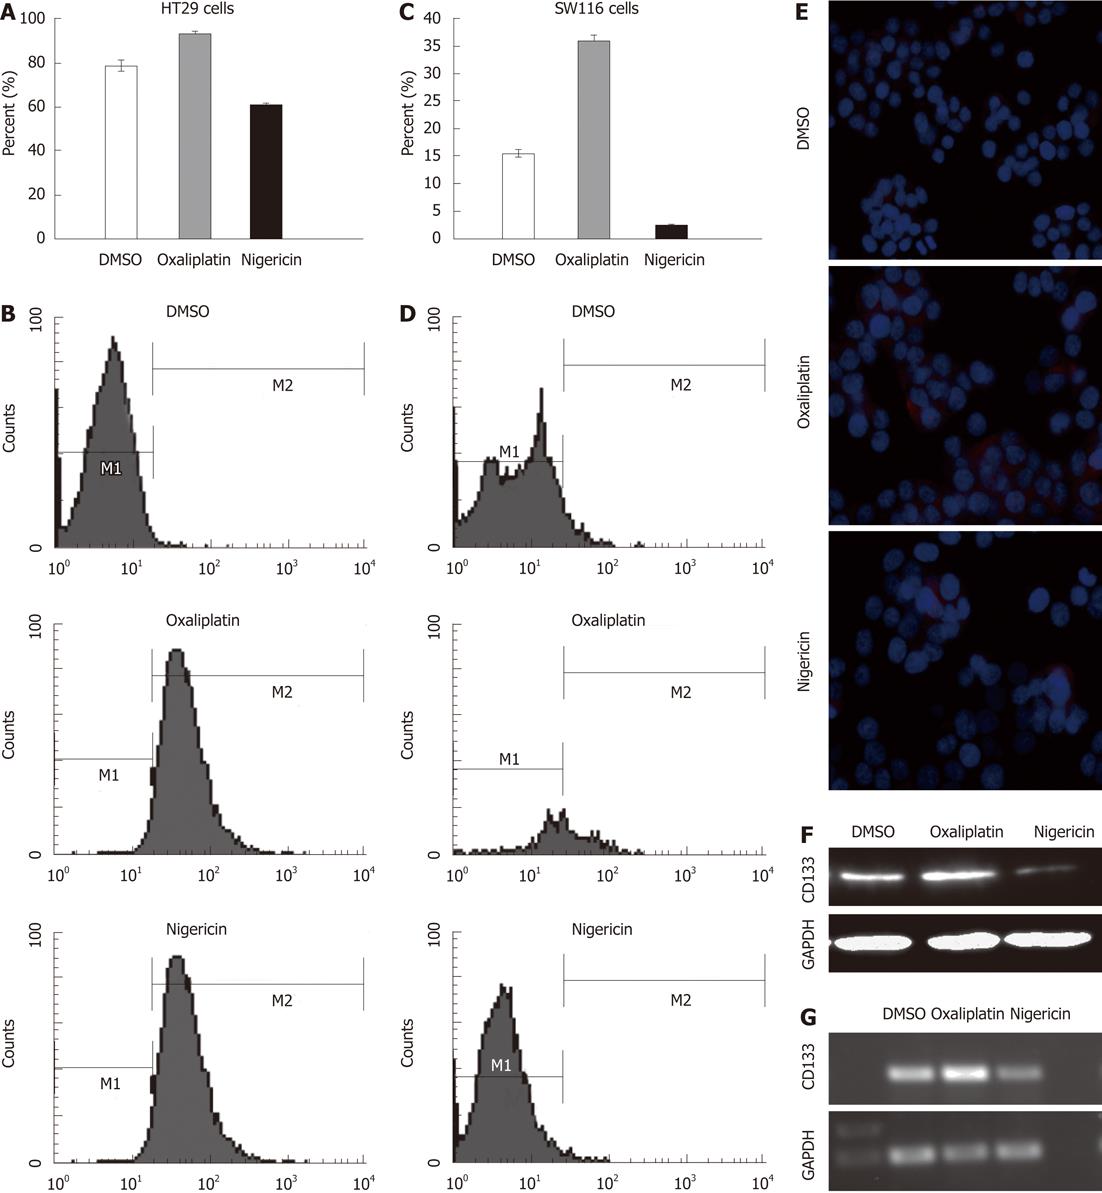
Figure 2 Effects of nigericin and oxaliplatin on expression of cancer stem cell marker.
A: Percentages of CD133+ cells after treatment of HT29 cells with nigericin and oxaliplatin. Bars denote SD; B: CD133 fluorescence-activated cell sorting (FACS) profiles are indicated for HT29 cell treatment with nigericin and oxaliplatin; C: Percentages of CD133+ cells after treatment of SW116 cells with nigericin and oxaliplatin. Bars denote SD; D: CD133 expression in SW116 cells after treatment was assayed with FACS; E: Immunofluorescence staining analysis of CD133 expression in HT29 cells after treatment; F: CD133 protein expression in HT29 cells after treatment was assayed with immunoblotting; G: Real-time polymerase chain reaction analysis of CD133 mRNA expression in HT29 cells. GAPDH: Glyceraldehyde-3-phosphate dehydrogenase; DMSO: Dimethylsulfoxid.
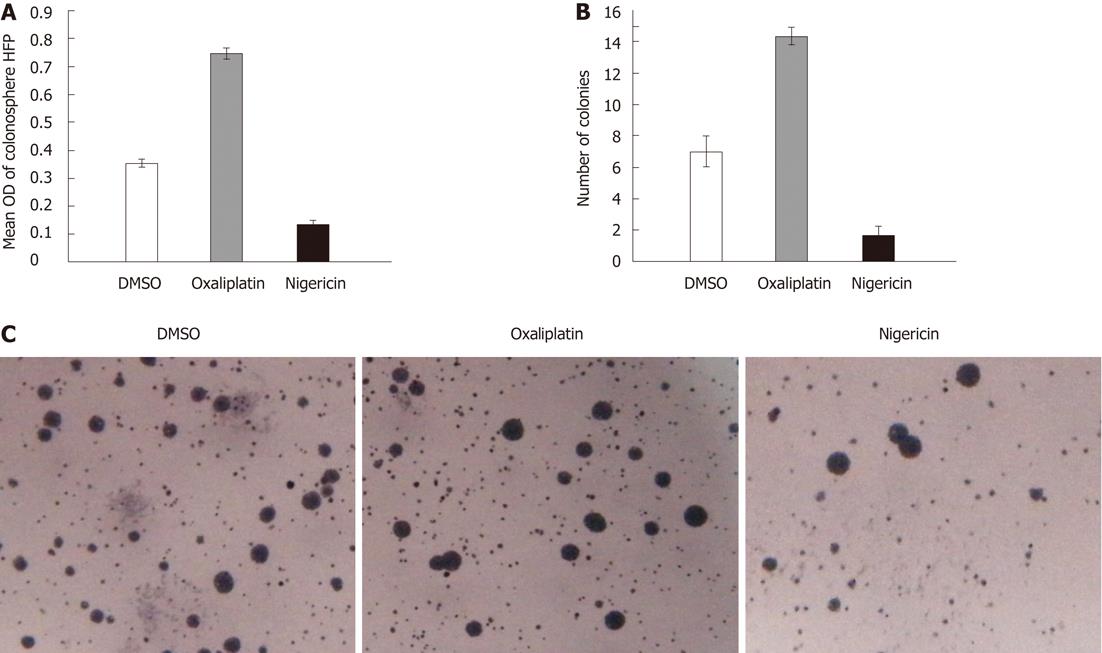
Figure 3 Effects of nigericin and oxaliplatin on sphere- or colony-forming ability of cancer stem cells.
A: Mean OD of sphere-forming HT29 cells after different treatments was assayed by methyl thiazolyl tetrazolium assay. Bars denote SD (n = 5); B: Numbers of colonies formed by HT29 cells after treatment in independent experiments. Bars denote SD (n = 5); C: Phase-contrast images of colonies formed in soft agar assays after treatment. DMSO: Dimethylsulfoxide; HPF: High-power field.
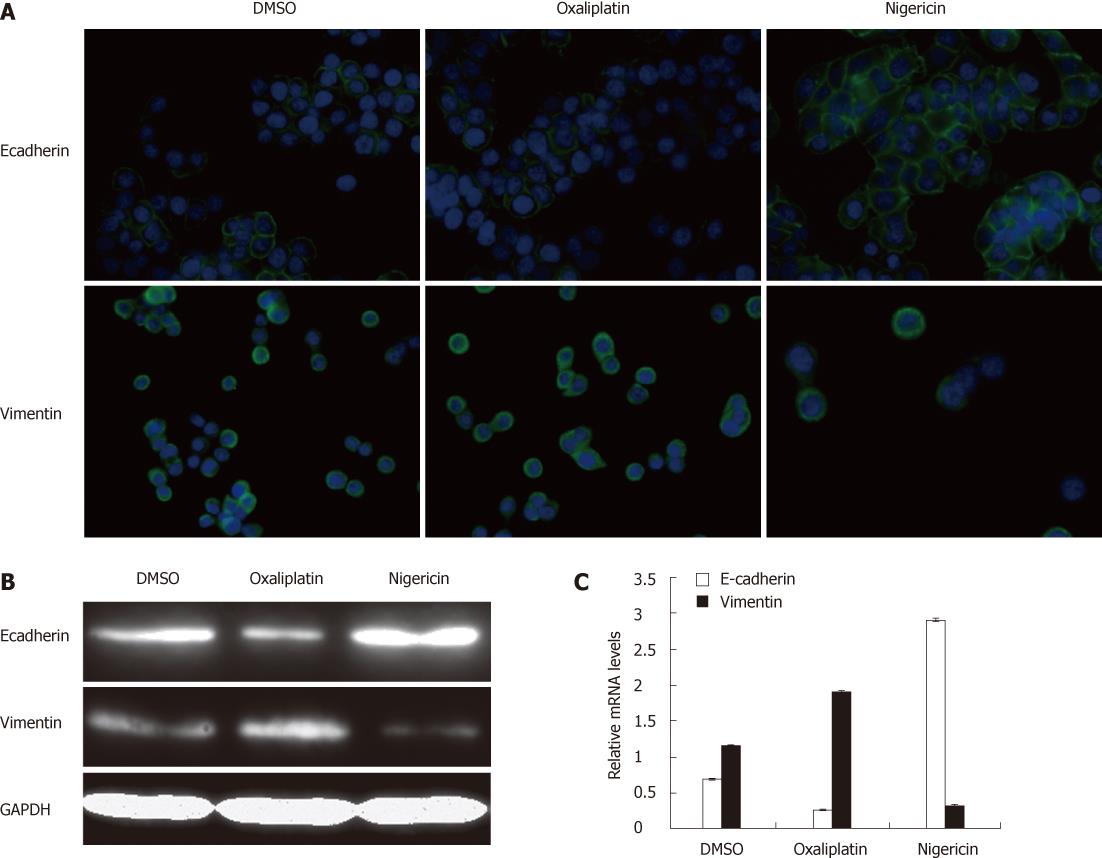
Figure 4 Upregulation of E-cadherin and downregulation of vimentin in cancer stem cells after nigericin treatment.
A: Immunofluorescence staining analysis of treated HT29 cells using epithelial E-cadherin and vimentin staining; B: E-cadherin and vimentin expression in HT29 cells after treatment, assayed by Western blotting; C: Real-time polymerase chain reaction analysis of E-cadherin and vimentin mRNA expression in HT29 cells after treatment with dimethylsulfoxide (DMSO) vehicle, oxaliplatin and nigericin.
- Citation: Zhou HM, Dong TT, Wang LL, Feng B, Zhao HC, Fan XK, Zheng MH. Suppression of colorectal cancer metastasis by nigericin through inhibition of epithelial-mesenchymal transition. World J Gastroenterol 2012; 18(21): 2640-2648
- URL: https://www.wjgnet.com/1007-9327/full/v18/i21/2640.htm
- DOI: https://dx.doi.org/10.3748/wjg.v18.i21.2640


