Copyright
©2012 Baishideng Publishing Group Co.
World J Gastroenterol. May 28, 2012; 18(20): 2502-2510
Published online May 28, 2012. doi: 10.3748/wjg.v18.i20.2502
Published online May 28, 2012. doi: 10.3748/wjg.v18.i20.2502
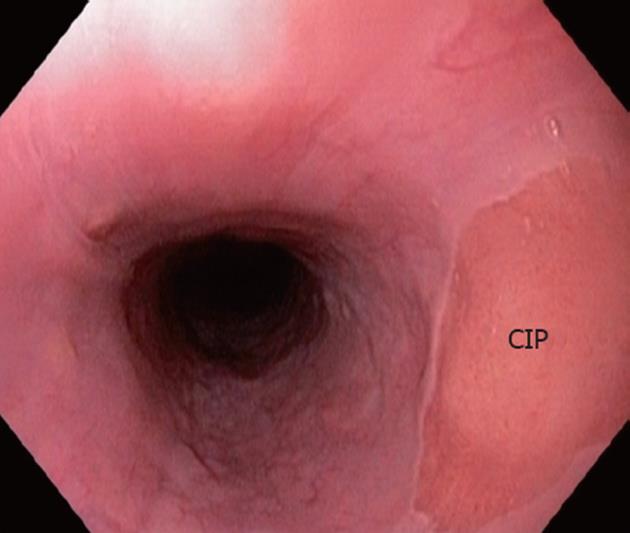
Figure 1 Endoscopic view of cervical inlet patch.
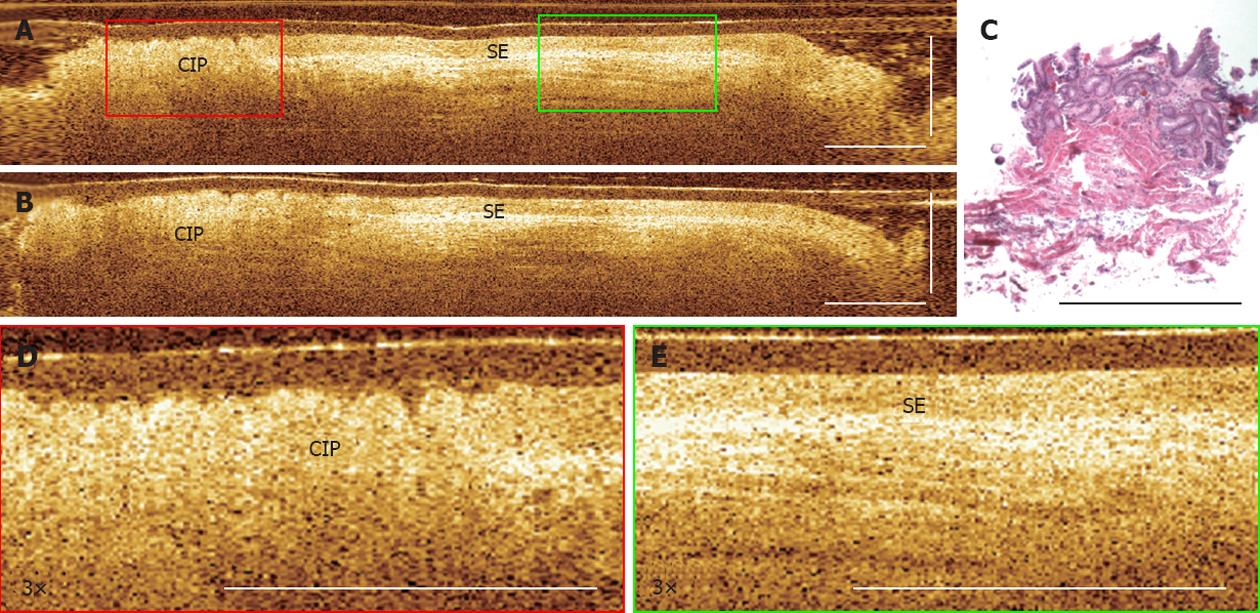
Figure 2 Endoscopic optical coherence tomography imaging of cervical inlet patch.
A: Cross-sectional optical coherence tomography images of cervical inlet patch (CIP); B: Adjacent squamous epithelium, respectively; C: Corresponding hematoxylin and eosin histology obtained from a biopsy at the CIP site; D: 3× magnification of the CIP; E: Squamous epithelium (SE) region marked in (A). Scale bars: 1 mm.
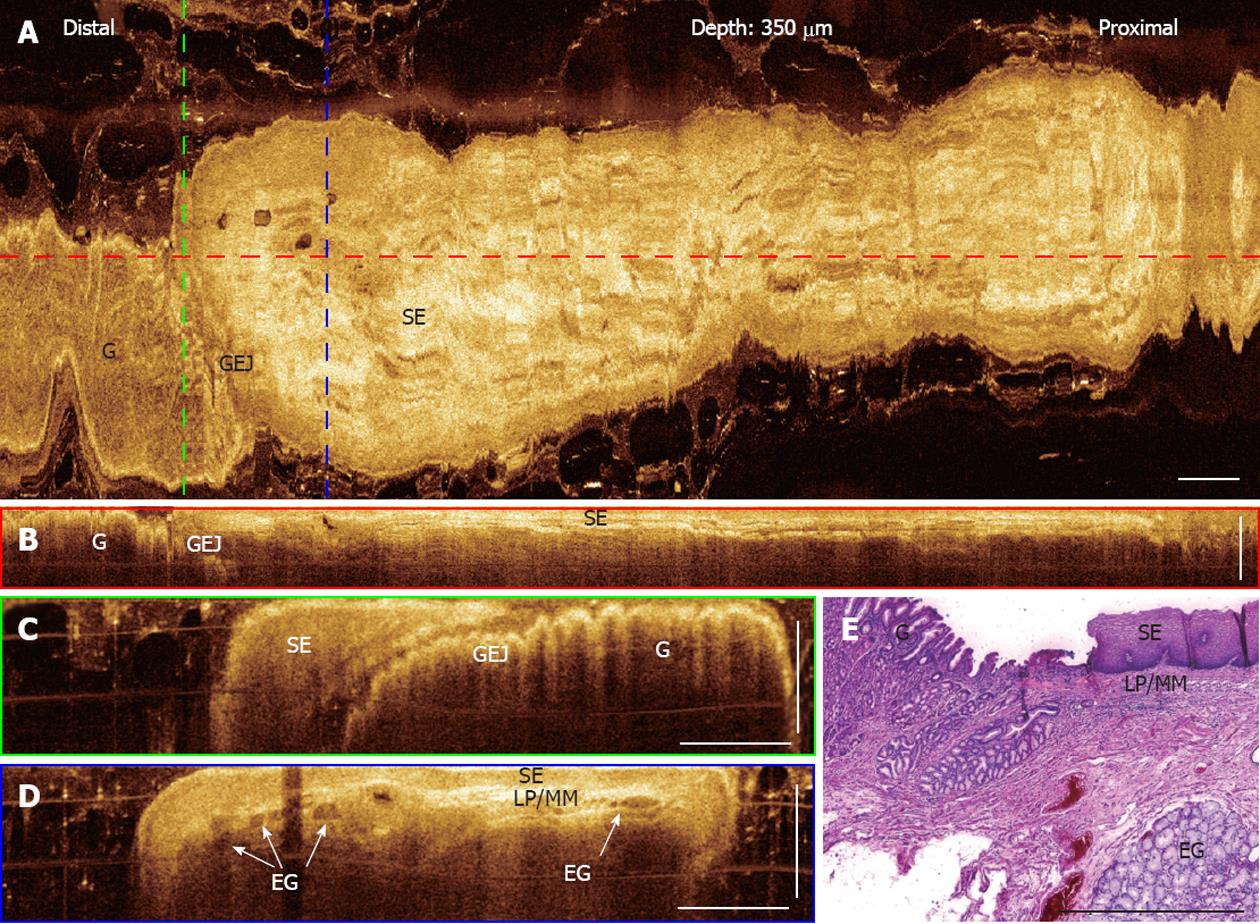
Figure 3 Three-dimensional-optical coherence tomography images of a normal gastro-esophageal junction.
A: En face projection optical coherence tomography (OCT) image at a depth of 350 μm; B: Regions with gastric mucosa and squamous mucosa show distinct features; Cross-sectional OCT image along the probe pullback direction showing the gastro-esophageal junction (GEJ) and normal squamous epithelium (SE) clearly; C, D: Cross-sectional images of the GEJ and SE, corresponding to the green and blue dashed lines marked in (A), respectively. Structures, such as SE, lamina propria (LP)/muscularis mucosa (MM), esophageal glands (arrows) (EG), and gastric mucosa, can be clearly identified; E: Representative histology at the GEJ. Scale bars: 1 mm.
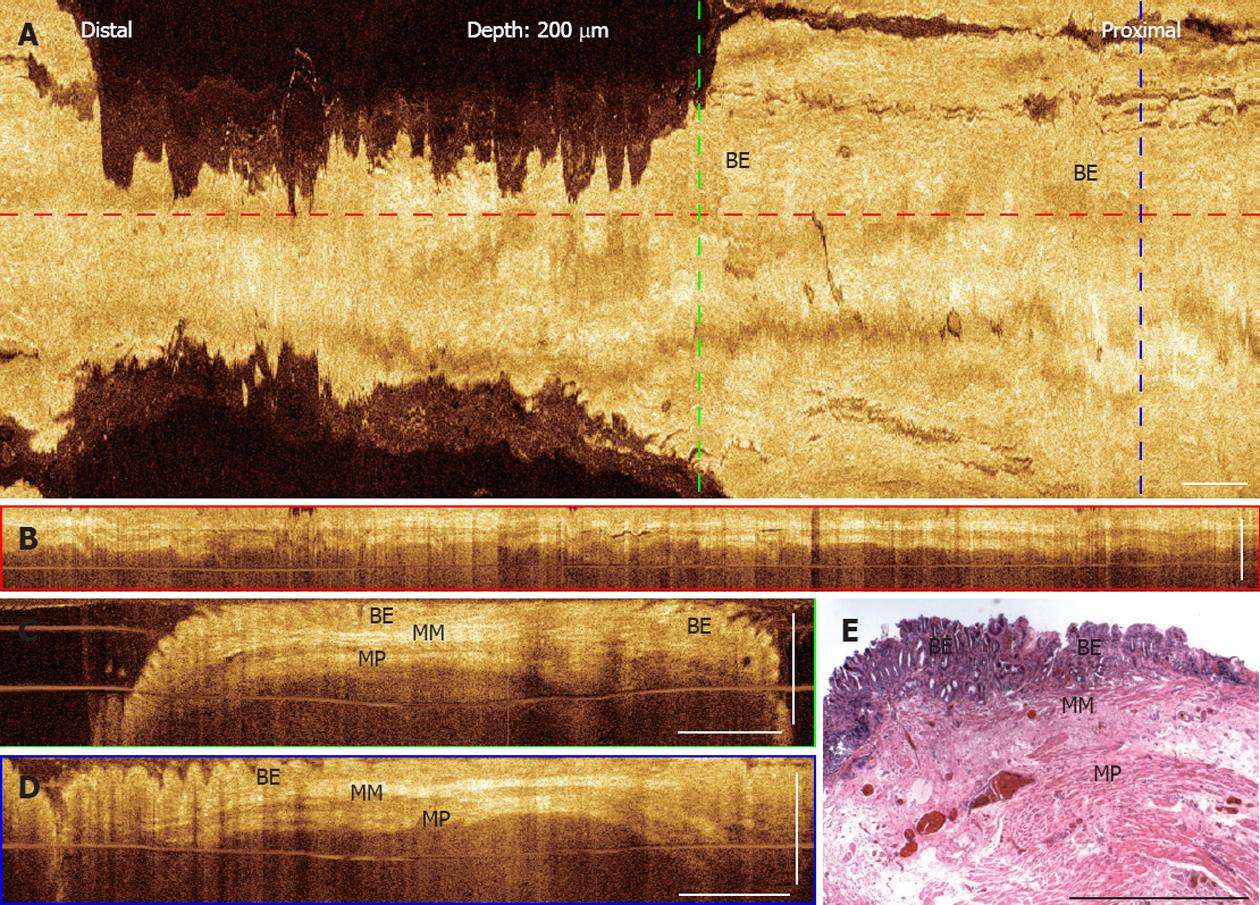
Figure 4 Three-dimensional-optical coherence tomography images of a long segment Barrett's esophagus.
A: En face projection optical coherence tomography (OCT) image at a depth of 200 μm; B: Cross-sectional OCT images of the long segment Barrett's esophagus (BE) along the probe pullback direction; C, D: Cross-sectional OCT images, corresponding to the green and blue dashed lines marked in (A). BE glands, the muscularis mucosa (MM), and the muscularis propria (MP) layers are clearly seen; D: Histology of an endoscopic mucosal resection specimen obtained from the same subject shows corresponding features observed in the OCT images. Scale bars: 1 mm.
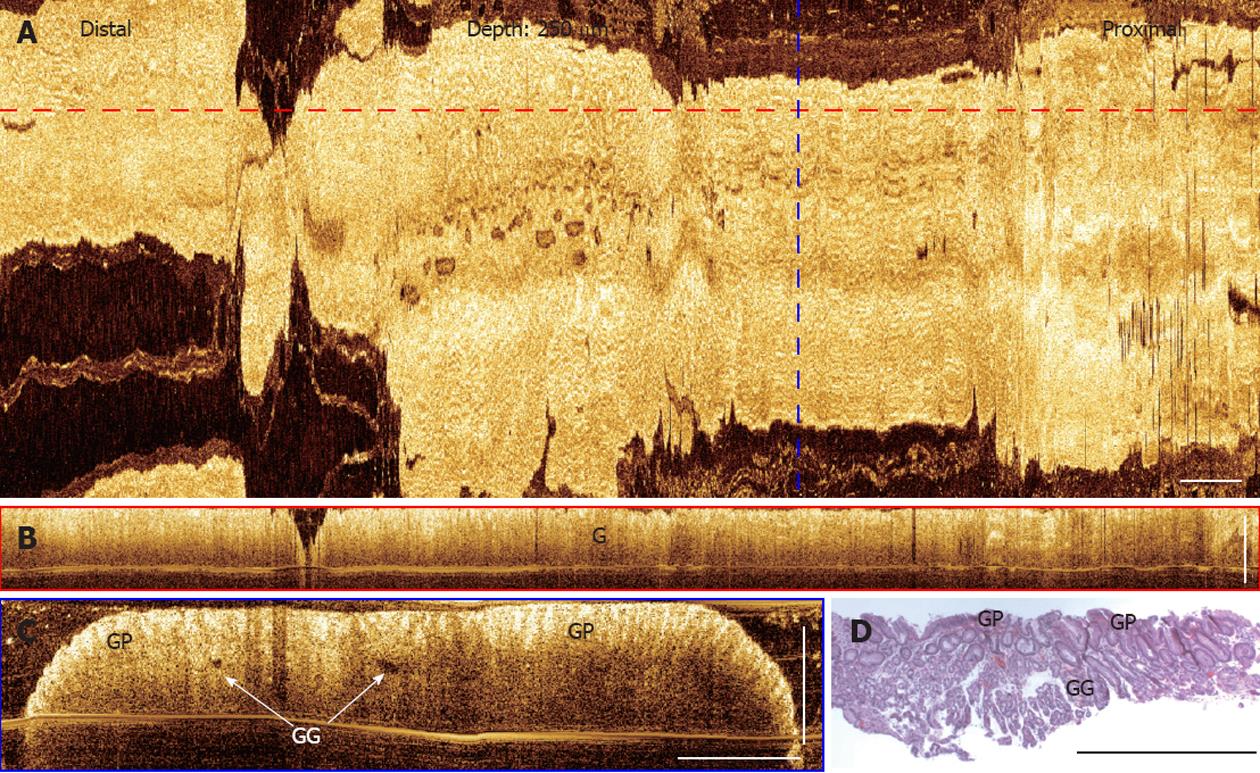
Figure 5 Three-dimensional-optical coherence tomography images of a normal stomach.
A: En face projection optical coherence tomography (OCT) image at a depth of 250 μm; B: Cross-sectional OCT image along the probe pullback direction, corresponding to the red dashed line marked in (A); C: Cross-sectional images of the gastric mucosa, corresponding to the blue dashed line marked in (A). Gastric pits (GP) and gastric glands (arrows) (GG) can be identified; D: Representative histology of a gastric mucosa. Scale bars: 1 mm.
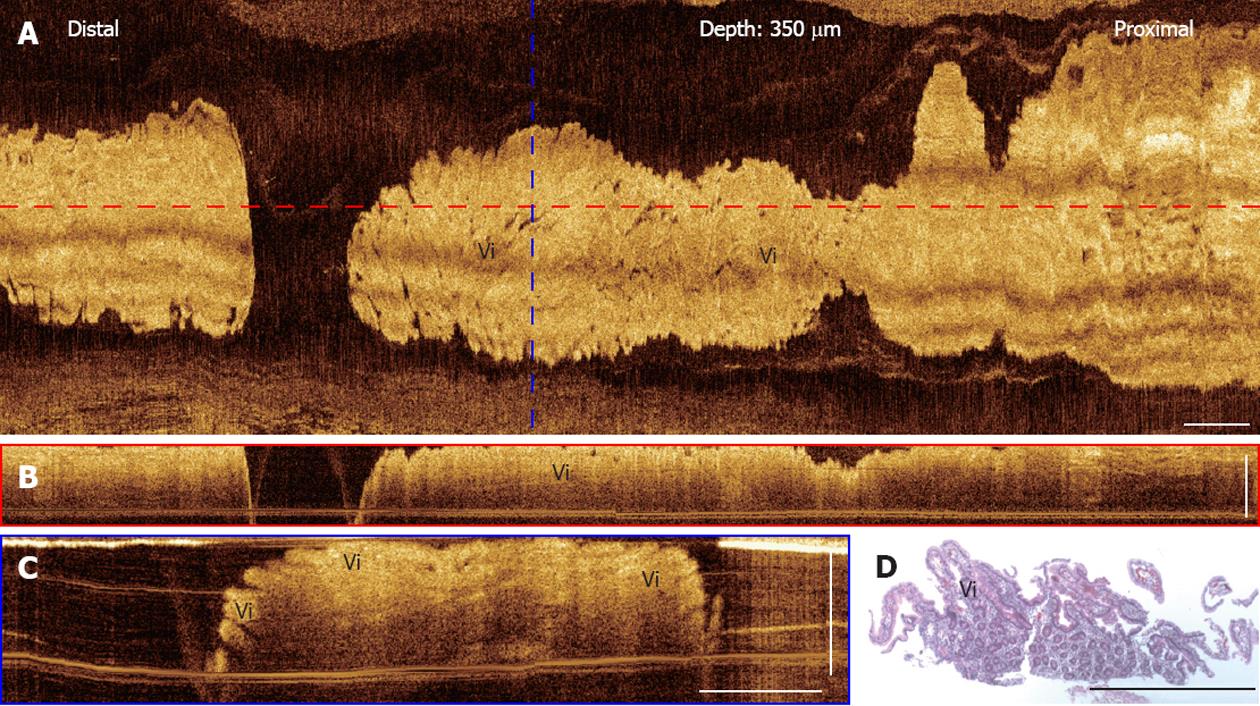
Figure 6 Three-dimensional-optical coherence tomography images of a normal duodenum.
A: En face projection optical coherence tomography (OCT) image at a depth of 350 μm; B: Cross-sectional OCT images of the duodenum along the probe pullback direction; C: Cross-sectional OCT image, corresponding to the blue dashed line marked in (A); Mucosal villous structures (Vi) in the duodenum are clearly seen; D: Corresponding histology of the duodenum showing the villi. Scale bars: 1 mm.
- Citation: Zhou C, Kirtane T, Tsai TH, Lee HC, Adler DC, Schmitt JM, Huang Q, Fujimoto JG, Mashimo H. Cervical inlet patch-optical coherence tomography imaging and clinical significance. World J Gastroenterol 2012; 18(20): 2502-2510
- URL: https://www.wjgnet.com/1007-9327/full/v18/i20/2502.htm
- DOI: https://dx.doi.org/10.3748/wjg.v18.i20.2502


