Copyright
©2012 Baishideng Publishing Group Co.
World J Gastroenterol. Apr 28, 2012; 18(16): 1903-1914
Published online Apr 28, 2012. doi: 10.3748/wjg.v18.i16.1903
Published online Apr 28, 2012. doi: 10.3748/wjg.v18.i16.1903
Figure 1 Cdx2 small interference RNA significantly reduced Cdx2 mRNA and protein expression in MGC-803 cells.
A: Semi-quantitative reverse transcription polymerase chain reaction (RT-PCR) analysis. The RNA samples (2 μg in each) extracted from MGC-803 cells, MGC-803/Cdx2 negative control cells and MGC-803/Cdx2 small interference RNA (siRNA) cells were subjected to RT-PCR for Cdx2 and β-actin mRNAs. RT-PCR for β-actin was performed in parallel to show an equal amount of total RNA in the sample; B: Western blotting analysis. Whole protein extracts (100 μg in each) were prepared from MGC-803 cells, MGC-803/Cdx2 negative control cells and MGC-803/Cdx2 siRNA cells. The expression of Cdx2 protein was determined by Western blotting with an anti-Cdx2 antibody. The β-actin expression levels were determined as a control for equivalent protein loading. Lane 1: MGC-803 group; Lane 2: MGC-803/Cdx2 negative control group; Lane 3: MGC-803/Cdx2 siRNA group; M: 600 bp marker.
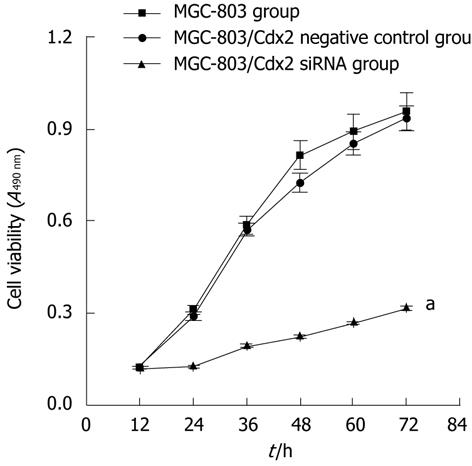
Figure 2 Cdx2 small interference RNA inhibits cell proliferation in MGC-803 cells.
MGC-803 cells, MGC-803/Cdx2 negative control cells and MGC-803/Cdx2 small interference RNA (siRNA) cells were treated with 3-(4,5-dimethylthiazol-2-yl)-2,5-diphenyl tetrazolium bromide at days 1-3. The cell viability in each group was presented. Each time point represented the mean of cell viability for each group. aP < 0.05 for MGC-803/Cdx2 siRNA group vs MGC-803 and MGC-803/Cdx2 negative control group.
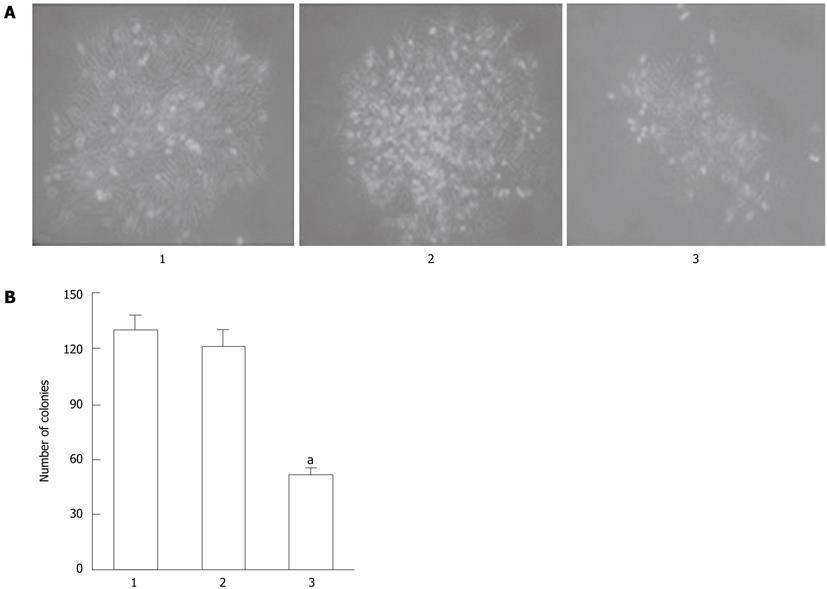
Figure 3 MGC-803/Cdx2 small interference RNA cells exhibited fewer colonies than MGC-803/Cdx2 negative control cells or MGC-803 cells.
A: MGC-803 cells, MGC-803/Cdx2 negative control cells and MGC-803/Cdx2 small interference RNA (siRNA) cells were plated in 6-well plates at a density of 20 cells/cm2, and the colonies were observed under optical microscope at 13 d (×100); B: The surviving fraction of cells (visible colonies) was stained with gentian violet, and counted manually. MGC-803/Cdx2 siRNA cells exhibited fewer colonies than MGC-803/Cdx2 negative control cells or MGC-803 cells. Each column presents as mean ± SE from 3 independent experiments. aP < 0.05 for MGC-803/Cdx2 siRNA group vs MGC-803 and MGC-803/Cdx2 negative control group. Lane 1: MGC-803 group; Lane 2: MGC-803/Cdx2 negative control group; Lane 3: MGC-803/Cdx2 siRNA group.
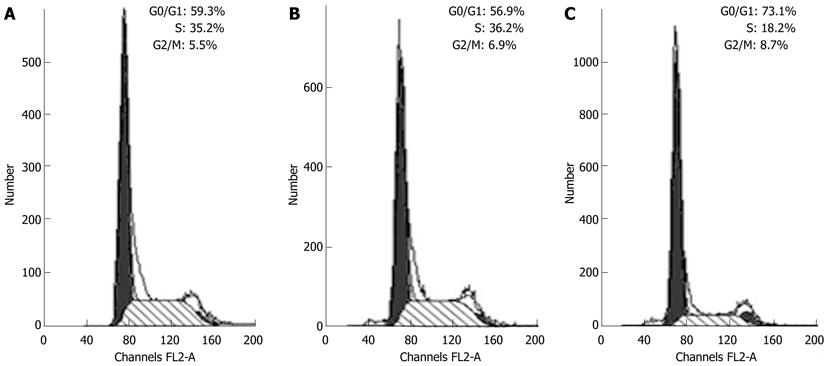
Figure 4 Cdx2 small interference RNA caused cell cycle arrest in the G0/G1 phase.
Cell cycle was analyzed by flow cytometry in MGC-803 cells, MGC-803/Cdx2 negative control cells and MGC-803/Cdx2 small interference RNA (siRNA) cells. The data were representative of 3 independent experiments. A: MGC-803 group; B: MGC-803/Cdx2 negative control group; C: MGC-803/Cdx2 siRNA group.
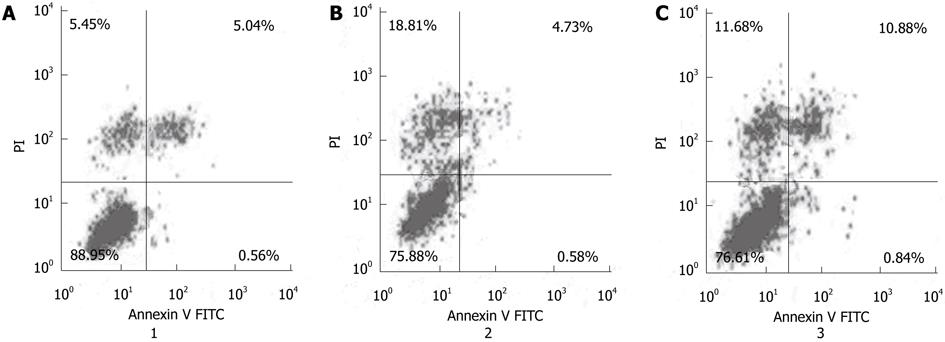
Figure 5 The mean apoptotic rate in MGC-803/Cdx2 small interference RNA cells was significantly higher than that in MGC-803/Cdx2 negative control or MGC-803 cells.
Percentages of apoptotic cells analyzed by flow cytometry. Numbers in the quadrants reflected the percentage of cells. A: MGC-803 group; B: MGC-803/Cdx2 negative control group; C: MGC-803/Cdx2 small interference RNA group. PI: Propidium iodide; FITC: Fluorescein isothiocyanate.
Figure 6 Cdx2 small interference RNA decreased migration of MGC-803 cells in wound healing assay.
MGC-803 cells, MGC-803/Cdx2 negative control cells and MGC-803/Cdx2 small interference RNA (siRNA) cells were cultured to confluence on 6-well plates, a central linear wound was made with a 200 μL sterile pipet tip. The central linear was photographed at different intervals (× 100). A: MGC-803 cells at 0 h; B: MGC-803/Cdx2 negative control cells at 0 h; C: MGC-803/Cdx2 siRNA cells at 0 h; D: MGC-803 cells at 36 h; E: MGC-803/Cdx2 negative control cells at 36 h; F: MGC-803/Cdx2 siRNA cells at 36 h. Lane 1: MGC-803 group; Lane 2: MGC-803/Cdx2 negative control group; Lane 3: MGC-803/Cdx2 siRNA group.
Figure 7 Cdx2 small interference RNA decreased invasion of MGC-803 cells.
MGC-803 cells (A), MGC-803/Cdx2 negative control cells (B) and MGC-803/Cdx2 small interference RNA cells (C) were loaded onto Matrigel-coated upper chambers of Transwell plates. Filtrated cells on the undersurface of the polycarbonate membranes were stained and counted under a optical microscope at 24 h (× 200).
Figure 8 Cdx2 small interference RNA upregulated phosphatase and tensin homolog, caspase-9 and caspase-3 mRNA expression.
A: Semi-quantitative reverse transcription polymerase chain reaction (RT-PCR) analysis. The RNA samples (2 μg in each) extracted from MGC-803 cells, MGC-803/Cdx2 negative control cells and MGC-803/Cdx2 small interference RNA (siRNA) cells were subjected to RT-PCR for phosphatase and tensin homolog (PTEN), caspase-9, caspase-3 and glyceraldehyde-3-phosphate dehydrogenase (GAPDH) mRNAs. RT-PCR for GAPDH was performed in parallel to show an equal amount of total RNA in the sample. Lane 1: MGC-803 group; Lane 2: MGC-803/Cdx2 negative control group; Lane 3: MGC-803/Cdx2 siRNA group; M: 600 bp marker; B: PTEN, caspase-9 and caspase-3 mRNA levels were measured at three groups, normalized to those of GAPDH and presented as mean ± SE. aP < 0.05 for MGC-803/Cdx2 siRNA group vs MGC-803 and MGC-803/Cdx2 negative control group.
Figure 9 Cdx2 small interference RNA significantly increased phosphatase and tensin homolog, cleaved caspase-9 and cleaved caspase-3 protein concentrations while pro-caspase-9 and pro-caspase-3 are decreased.
A: Western blotting analysis. Whole protein extracts (100 μg in each) were prepared from MGC-803 cells, MGC-803/Cdx2 negative control cells and MGC-803/Cdx2 small interference RNA (siRNA) cells. The expression of phosphatase and tensin homolog (PTEN), pro-caspase-9, p37 cleaved caspase-9, pro-caspase-3, and p17 cleaved caspase-3 was determined by Western blotting with an anti-PTEN, pro-caspase-9, cleaved caspase-9, pro-caspase-3 and cleaved caspase-3 antibody. The glyceraldehyde-3-phosphate dehydrogenase (GAPDH) protein expression levels were determined as a control for equivalent protein loading. Lane 1: MGC-803 group; Lane 2: MGC-803/Cdx2 negative control group; Lane 3: MGC-803/Cdx2 siRNA group; B: PTEN, pro-caspase-9, p37 cleaved caspase-9, pro-caspase-3 and p17 cleaved caspase-3 protein levels were measured at three groups, normalized to those of GAPDH and presented as mean ± SE. aP < 0.05 for MGC-803/Cdx2 siRNA group vs MGC-803 and MGC-803/Cdx2 negative control group.
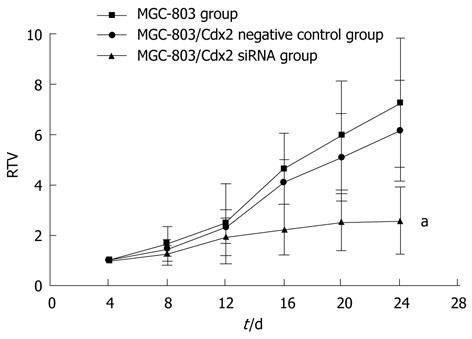
Figure 10 Tumor growth curve showed a significant growth tendency in MGC-803 cells and in MGC-803/Cdx2 negative control cells, while the tumor growth in MGC-803/Cdx2 small interference RNA cells was obviously inhibited.
MGC-803 cells, MGC-803/Cdx2 negative control cells and MGC-803/Cdx2 small interference RNA (siRNA) cells were implanted subcutaneously into the flanks of the nude mice. The relative tumor volume (RTV) of nude mice in each group were presented. Each time point represented the mean of RTV for each group; aP < 0.05 for MGC-803/Cdx2 siRNA group vs MGC-803 and MGC-803/Cdx2 negative control group.
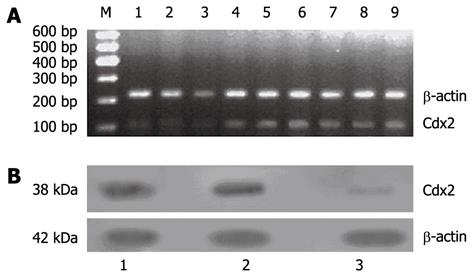
Figure 11 Cdx2 mRNA and protein expression was suppressed in MGC-803/Cdx2 small interference RNA tumor tissue.
A: Semi-quantitative reverse transcription polymerase chain reaction (RT-PCR) analysis. Total RNAs (2 μg in each) extracted from tumor tissue were subjected to RT-PCR for Cdx2 and β-actin mRNAs. RT-PCR for β-actin was performed in parallel to show an equal amount of total RNA in the sample; Lanes 1-3: MGC-803/Cdx2 small interference RNA (siRNA) group; Lanes 4-6: MGC-803/Cdx2 negative control group; Lanes 7-9: MGC-803 group; M: 600 bp marker; B: Western blotting analysis. Equal amounts of protein extracts (100 μg in each) were prepared from tumor tissue. The expression of Cdx2 protein was determined by Western blotting with an anti-Cdx2 antibody. The β-actin expression levels were determined as a control for equivalent protein loading. Lane 1: MGC-803 group; Lane 2: MGC-803/Cdx2 negative control group; Lane 3: MGC-803/Cdx2 siRNA group.
Figure 12 Cdx2 small interference RNA promoted tumor cells apoptosis.
Tumor cells were assessed for apoptosis using terminal deoxynucleotidyl transferase-mediated 2’-deoxyuridine, 5’-triphosphate nick end labeling assay. The apoptotic cells were brown-stained and counted under a optical microscope (× 400). A: MGC-803 group; B: MGC-803/Cdx2 negative control group; C: MGC-803/Cdx2 small interference RNA group.
- Citation: Wang XT, Xie YB, Xiao Q. siRNA targeting of Cdx2 inhibits growth of human gastric cancer MGC-803 cells. World J Gastroenterol 2012; 18(16): 1903-1914
- URL: https://www.wjgnet.com/1007-9327/full/v18/i16/1903.htm
- DOI: https://dx.doi.org/10.3748/wjg.v18.i16.1903


