Copyright
©2012 Baishideng Publishing Group Co.
World J Gastroenterol. Mar 28, 2012; 18(12): 1308-1318
Published online Mar 28, 2012. doi: 10.3748/wjg.v18.i12.1308
Published online Mar 28, 2012. doi: 10.3748/wjg.v18.i12.1308
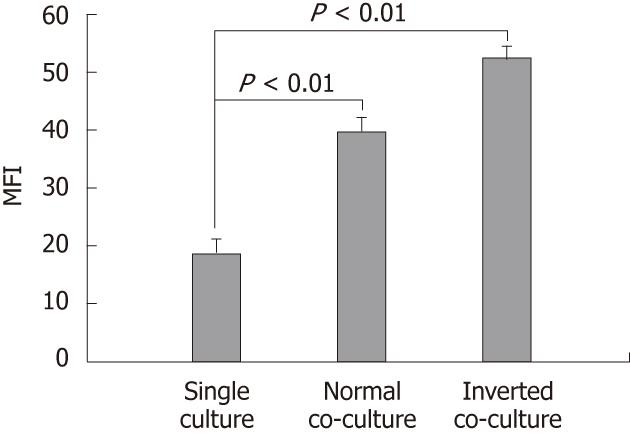
Figure 1 Effect of non-stimulated intestinal epithelial cells on surface phenotype of dendritic cells.
Fluorescence activated cell sorter analysis of dendritic cells (DC) cultured alone or co-cultured with non-stimulated epithelial cell monolayers for 12 h showing DC surface phenotype by staining with I-Ad. Data are shown as the mean fluorescent intensity (MFI) ± SEM of three representative experiments. Significant difference between the single culture and co-culture as determined by Student’s t-test (P < 0.01).
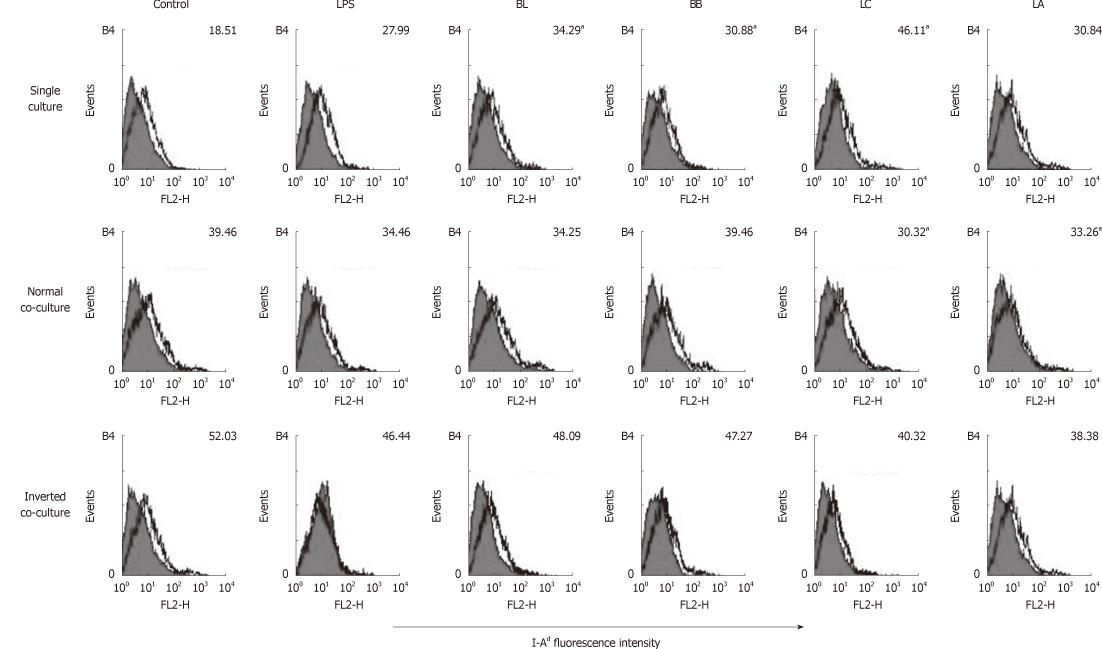
Figure 2 Effect of probiotics on I-Ad of single- or co-cultured dendritic cells.
Fluorescence activated cell sorter analysis of probiotics-treated dendritic cells (DC) cultured in the presence or absence of intestinal monolayers for 12 h. Filled histograms are isotype controls; unfilled histogram show staining for I-Ad. Numbers indicate the mean fluorescent intensity of three representative experiments. aSignificant difference among the control, lipopolysaccharides and probiotics as determined by analysis of variance (P < 0.05). LPS: Lipopolysaccharides; BL: Bifidobacterium lactis AD011, BB: Bifidobacterium bifidum BGN4, LC: Lactobacillus casei IBS041; LA: Lactobacillus acidophilus AD031.
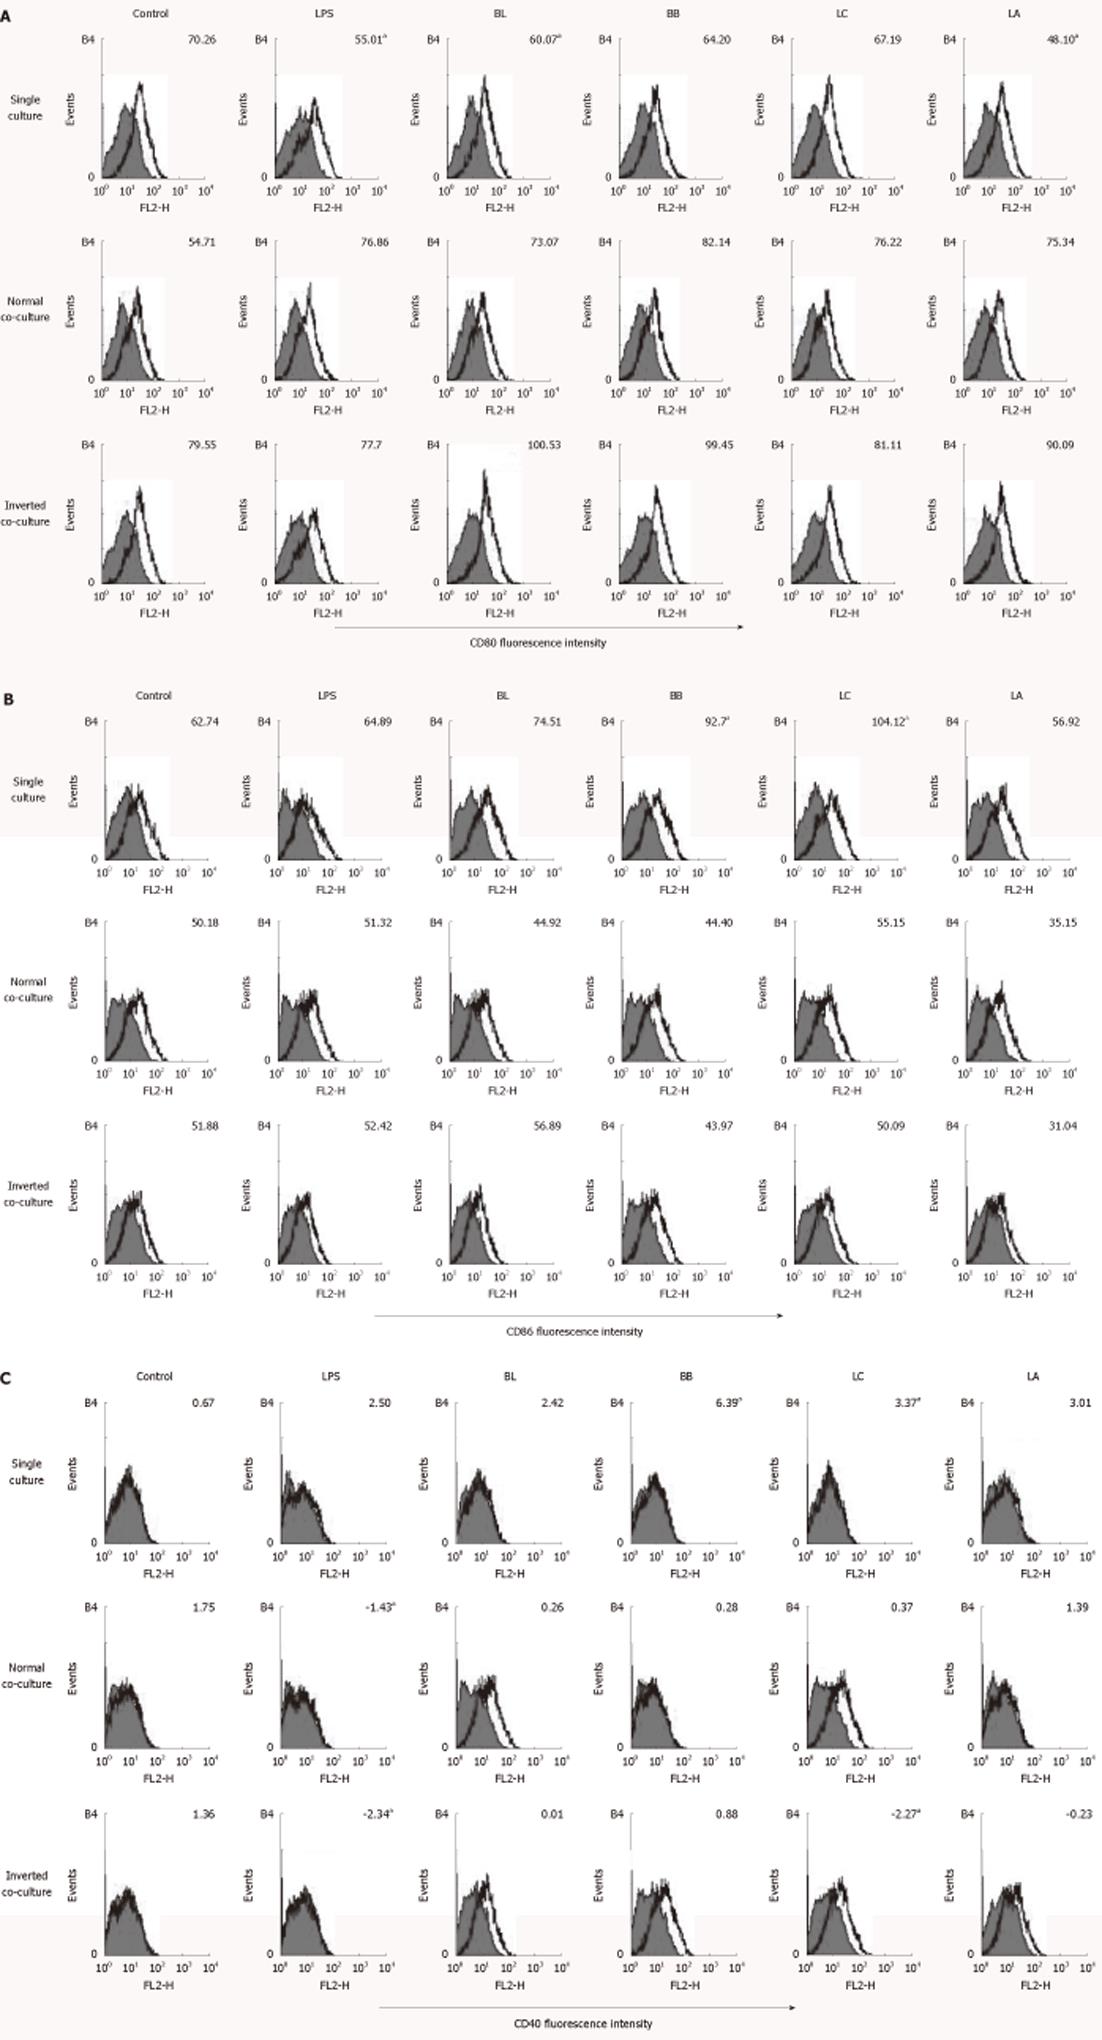
Figure 3 Effect of probiotics on the CD80, CD86 and CD40 of single- or co-cultured dendritic cells.
Fluorescence activated cell sorter analysis of probiotics-treated dendritic cells (DC) cultured in the presence or absence of intestinal monolayers for 12 h. Filled histograms are isotype controls; unfilled histogram shows staining for CD80 (A), CD86 (B) and CD40 (C). Numbers indicate the mean fluorescent intensity of at least three representative experiments. aSignificant difference among the control, lipopolysaccharides, and probiotics as determined by analysis of variance (P < 0.05). LPS: Lipopolysaccharides; BL: Bifidobacterium lactis AD011, BB: Bifidobacterium bifidum BGN4, LC: Lactobacillus casei IBS041; LA: Lactobacillus acidophilus AD031.
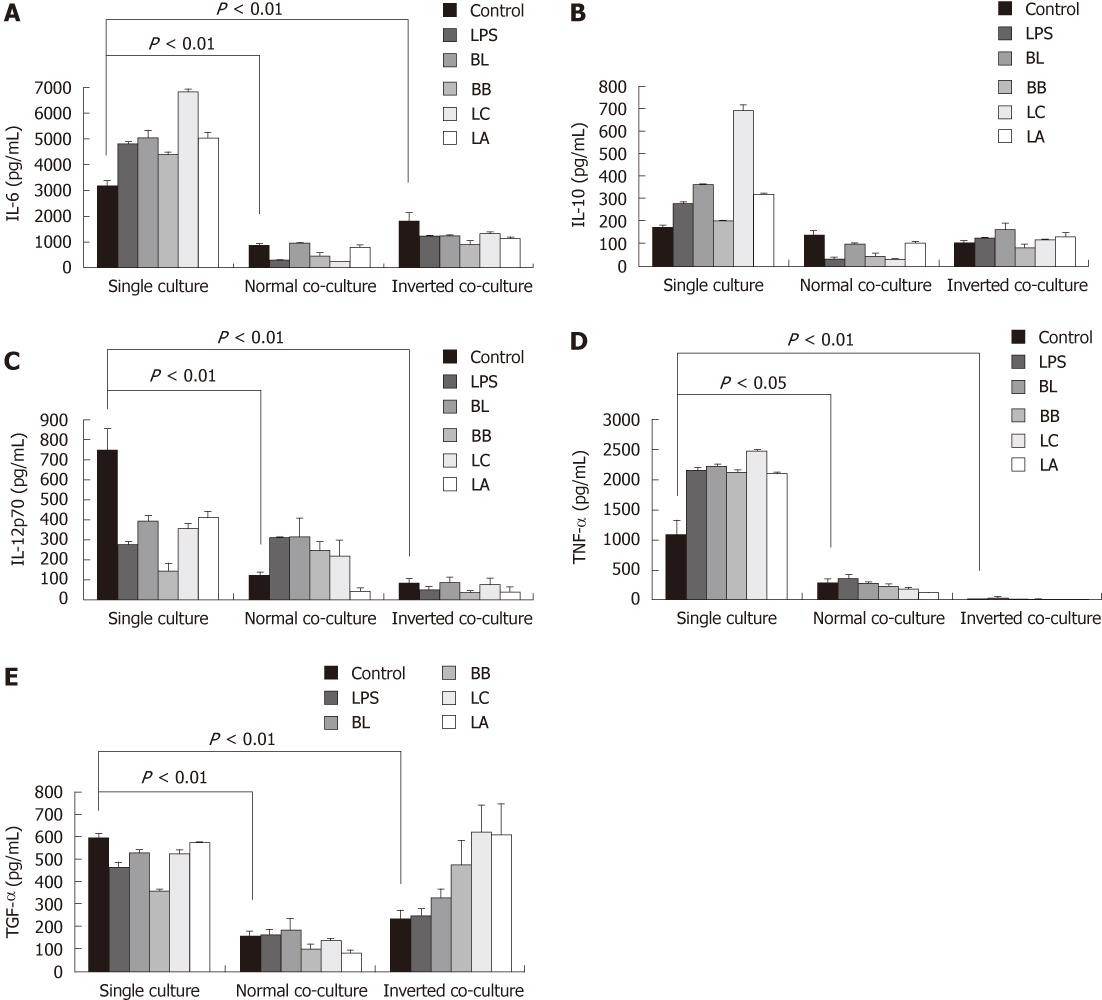
Figure 4 Effect of probiotics on the production of cytokines from single- or co-cultured dendritic cells.
Supernatants were obtained from probiotic-treated dendritic cells (DC) cultured in the presence or absence of intestinal monolayers for 12 h. Levels of interleutkin (IL)-6 (A), IL-10 (B), IL-12p70 (C), tumor necrosis factor (TNF)-α (D), and transforming growth factor(TGF)-β (E) were determined by enzyme-linked immunosorbent assay. Data are shown as mean ± SE of three representative experiments. Different letters indicate significant differences among the control, lipopolysaccharides (LPS), and probiotics determined by Duncan’s multiple range test (P < 0.05). Significant difference between the single culture and co-culture as determined by Student’s t-test (P < 0.05). BL: Bifidobacterium lactis AD011; BB: Bifidobacterium bifidum BGN4; LC: Lactobacillus casei IBS041; LA: Lactobacillus acidophilus AD031.
- Citation: Kim JY, Park MS, Ji GE. Probiotic modulation of dendritic cells co-cultured with intestinal epithelial cells. World J Gastroenterol 2012; 18(12): 1308-1318
- URL: https://www.wjgnet.com/1007-9327/full/v18/i12/1308.htm
- DOI: https://dx.doi.org/10.3748/wjg.v18.i12.1308


