Copyright
©2011 Baishideng Publishing Group Co.
World J Gastroenterol. Feb 28, 2011; 17(8): 1009-1017
Published online Feb 28, 2011. doi: 10.3748/wjg.v17.i8.1009
Published online Feb 28, 2011. doi: 10.3748/wjg.v17.i8.1009
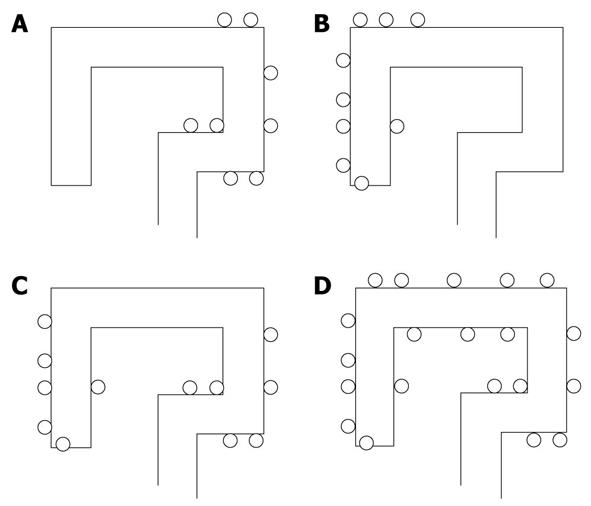
Figure 1 Classification of the pattern of distribution of diverticula throughout the colon.
A: Left-sided diverticular disease; B: Right-sided diverticular disease; C: Right and left diverticular disease; D: Pan-diverticular disease.
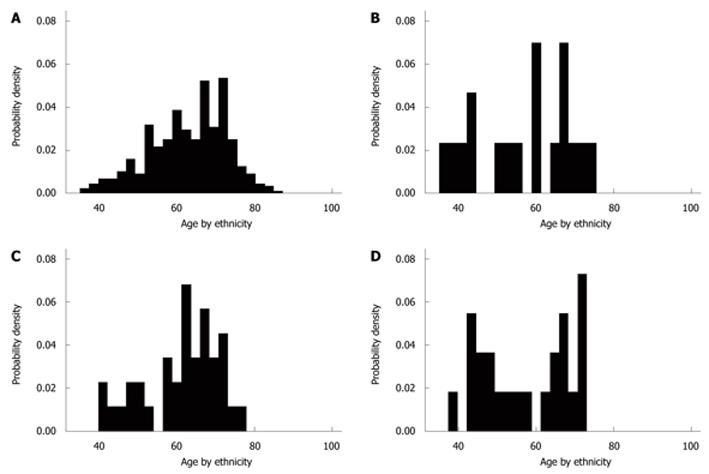
Figure 2 Age and probability density by ethnicity in patients diagnosed with diverticular disease.
A: White; B: Asian; C; Other black; D: Black African.
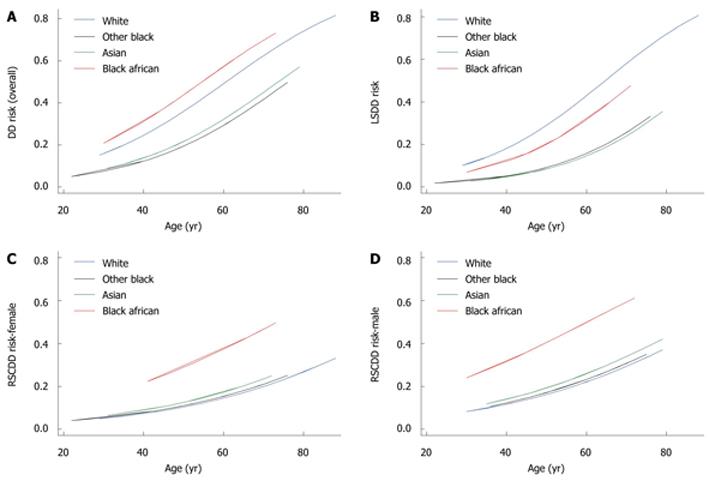
Figure 3 Predictive risk of being diagnosed with diverticular disease by age, ethnicity and sex using the corresponding final models in Table 2.
A: Diverticular disease (DD) overall; B: Left-sided DD (LSDD); C: Right-sided component DD (RSCDD)-female; D: RSCDD-male.
Figure 4 Predictive risks of having a higher diverticula density form, by age and ethnicity.
A: Left-sided diverticular disease; B: Right-sided component diverticular disease.
- Citation: Golder M, Ster IC, Babu P, Sharma A, Bayat M, Farah A. Demographic determinants of risk, colon distribution and density scores of diverticular disease. World J Gastroenterol 2011; 17(8): 1009-1017
- URL: https://www.wjgnet.com/1007-9327/full/v17/i8/1009.htm
- DOI: https://dx.doi.org/10.3748/wjg.v17.i8.1009


