Copyright
©2011 Baishideng Publishing Group Co.
World J Gastroenterol. Nov 21, 2011; 17(43): 4772-4778
Published online Nov 21, 2011. doi: 10.3748/wjg.v17.i43.4772
Published online Nov 21, 2011. doi: 10.3748/wjg.v17.i43.4772
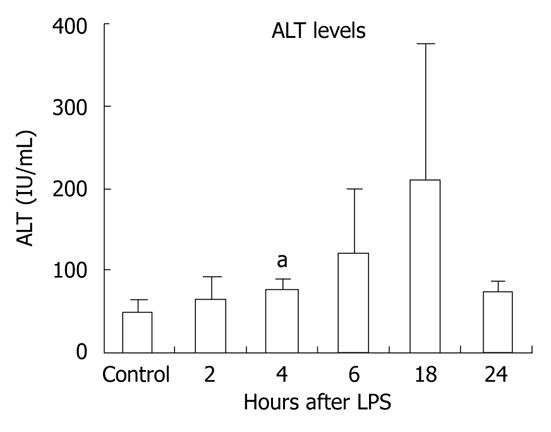
Figure 1 Lipopolysaccharide stimulation results in liver damage.
C57BL/6 wild-type chow-fed mice (three per group) were injected intraperitoneally with lipopolysaccharide (LPS) for 2, 4, 6, 18 or 24 h. Serum was separated from whole blood and analyzed for alanine aminotransferase (ALT), which was significantly increased after 4 h of LPS stimulation. Mean ± SD are shown. aP < 0.01.
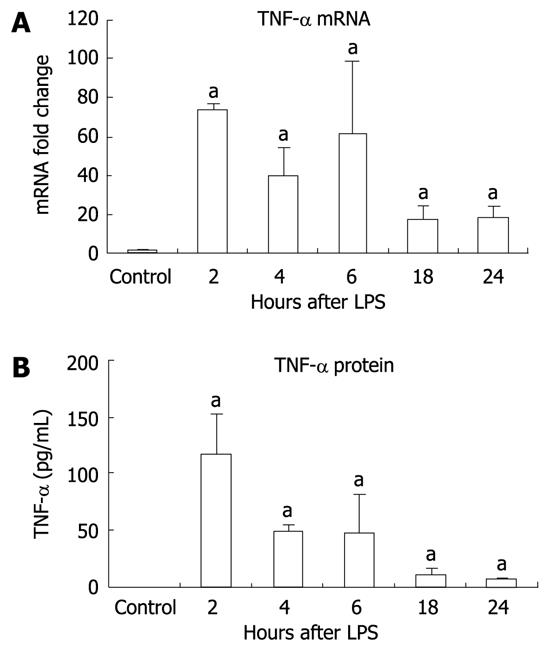
Figure 2 Inflammation in the liver is seen after lipopolysaccharide stimulation.
A: Tumor necrosis factor (TNF)-α mRNA in liver tissue was significantly increased at all time points after lipopolysaccharide (LPS) stimulation. TNF-α mRNA was analyzed by real-time quantitative polymerase chain reaction and normalized to 18S. The values are shown as a fold change to the non-stimulated LPS control; B: Similarly, TNF-α protein was significantly elevated in liver tissue following LPS stimulation as detected by enzyme-linked immunosorbent assay. Protein levels were normalized to total protein concentration in each tissue sample. Mean ± SD are shown. n = 3 for each group (except at 4 h LPS stimulation, where n = 2 due to an outlier), aP < 0.01.
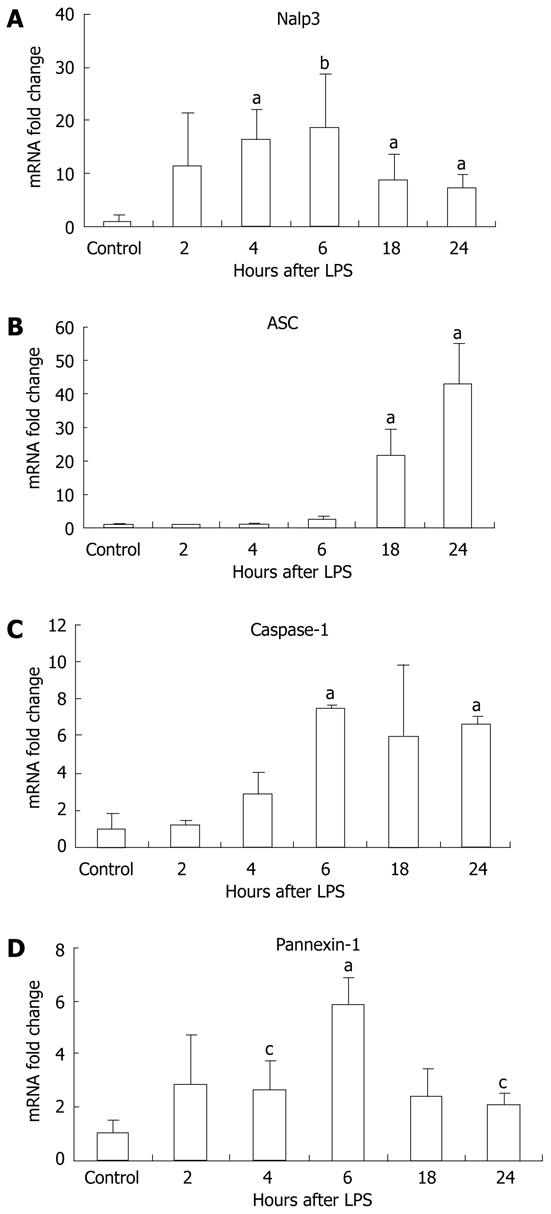
Figure 3 Lipopolysaccharide stimulation increased Nalp3 inflammasome mRNA expression in liver tissue.
Liver RNA analysis of Nalp3 (A), apoptosis-associated speck-like, caspase recruitment domain-domain containing protein (ASC) (B), caspase-1 (C) and pannexin-1 (D) were analyzed by real-time quantitative polymerase chain reaction. The values were normalized to 18S and are shown as a fold increase to the non-lipopolysaccharide (LPS) stimulated control. Mean ± SD are shown. n = 3 per group, aP < 0.01, bP < 0.03, cP < 0.05.
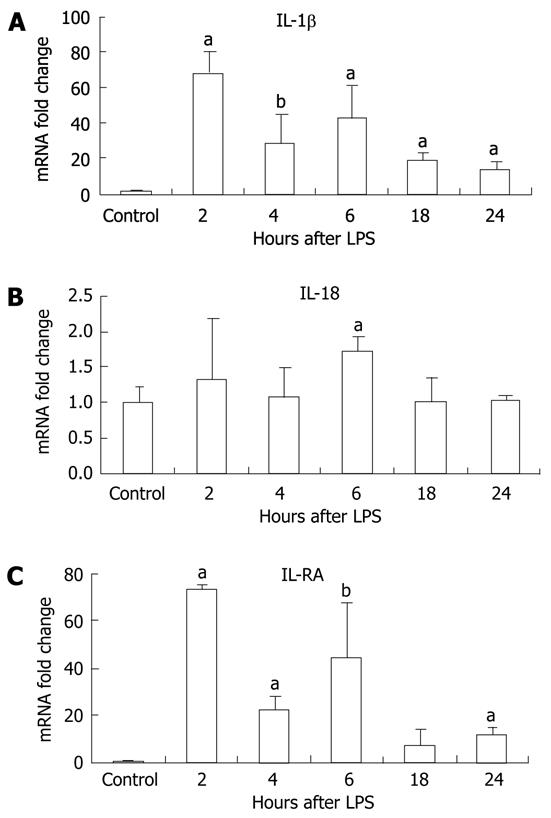
Figure 4 Lipopolysaccharide stimulation increased interleukin (IL)-1β and IL-18 mRNA, and IL-1RA transcription in the liver.
Liver mRNA levels of IL-1β (A), IL-18 (B) and IL-1RA (C) were analyzed by real-time quantitative polymerase chain reaction and normalized to 18S. Mean ± SD are shown. n = 3 per group [except at 2 h lipopolysaccharide (LPS) stimulation, where n = 2 due to outlier], aP < 0.01, bP < 0.03.
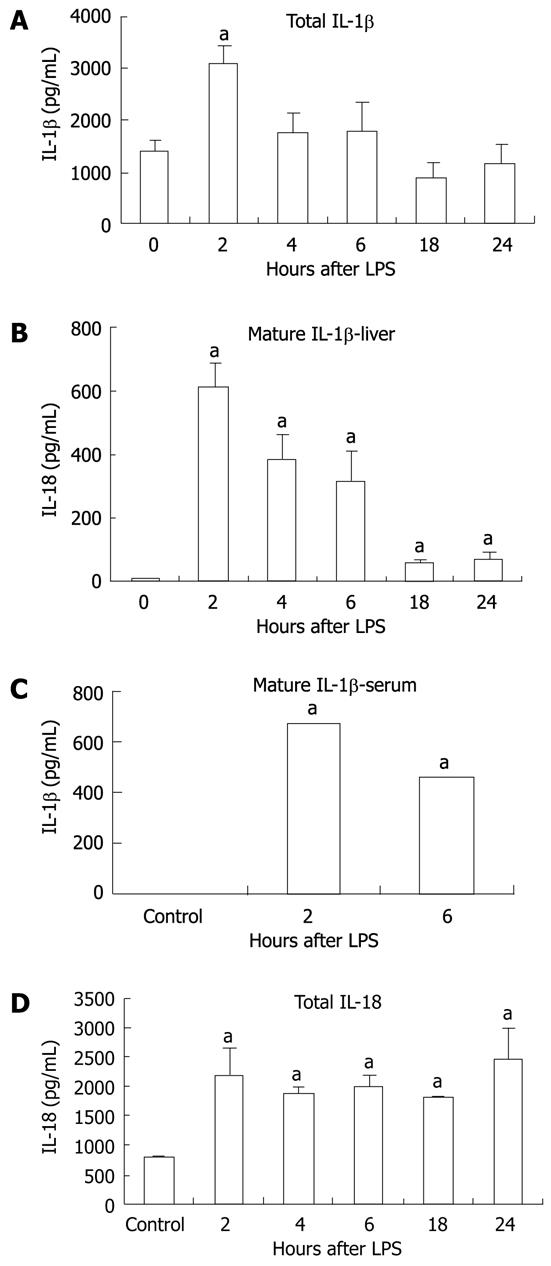
Figure 5 Lipopolysaccharide increased interleukin-1β and interleukin-18 protein.
Protein level was detected in liver tissue by enzyme-linked immunosorbent assay for total-interleukin (IL)-1β (pro-IL-1β and cleaved IL-1β) (A), cleaved IL-1β in the liver tissue (B),cleaved IL-1β in the serum (C) and total IL-18 (pro-IL-18 and cleaved IL-18) (D) in liver tissue. The values shown are the fold change compared to non-Lipopolysaccharide (LPS) stimulated control. Protein levels were normalized to total protein concentrations in each tissue sample. Mean ± SD are shown. n = 3 per group (except at 2 h LPS stimulation, where n = 2 due to an outlier), aP < 0.01.
- Citation: Ganz M, Csak T, Nath B, Szabo G. Lipopolysaccharide induces and activates the Nalp3 inflammasome in the liver. World J Gastroenterol 2011; 17(43): 4772-4778
- URL: https://www.wjgnet.com/1007-9327/full/v17/i43/4772.htm
- DOI: https://dx.doi.org/10.3748/wjg.v17.i43.4772


