Copyright
©2011 Baishideng Publishing Group Co.
World J Gastroenterol. Nov 7, 2011; 17(41): 4581-4589
Published online Nov 7, 2011. doi: 10.3748/wjg.v17.i41.4581
Published online Nov 7, 2011. doi: 10.3748/wjg.v17.i41.4581
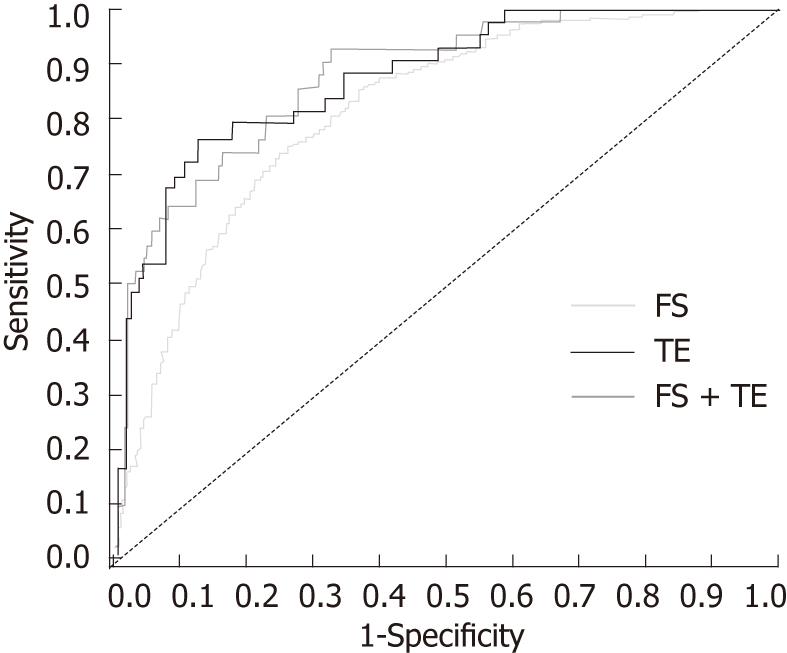
Figure 1 Baseline area-under-the-receiver-operating-curve analysis for stages F2-4 for FibroSURE and transient elastography.
Of the overall cohort with baseline biopsy (n = 2060), FibroSURE (FS) was available in 2055 patients, transient elastography (TE) in 214, and both FS and TE in 209. Area-under-the-receiver-operating-curve values for stages F2-4 were 0.82 for FS, 0.88 for TE, and 0.88 for FS + TE. Differences between FS and TE were not significant. FS: FibroSURE; TE: Transient elastography.
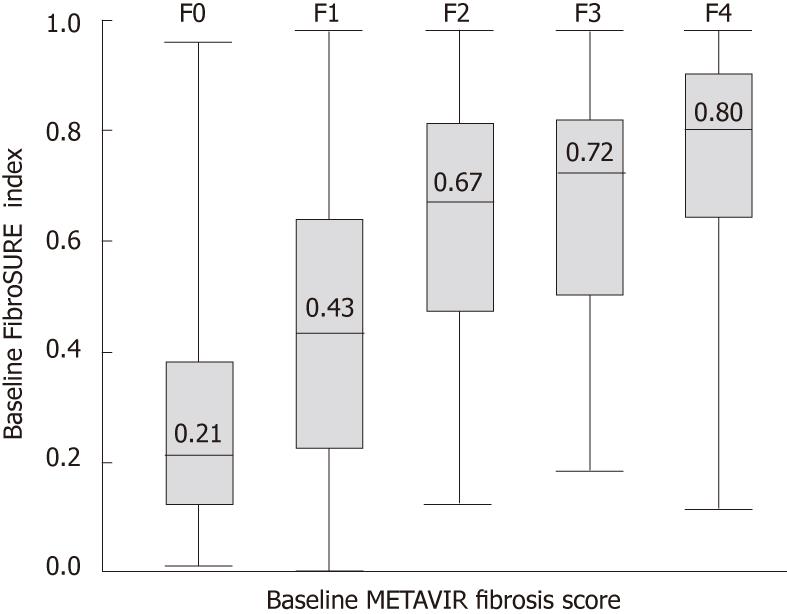
Figure 2 Boxplot distribution of FibroSURE index scores in all patients at baseline (n = 2055).
Box parameters represent 25th and 75th percentile index scores for each fibrosis stage; median index values are shown within box, and upper and lower range limits are represented by vertical lines.
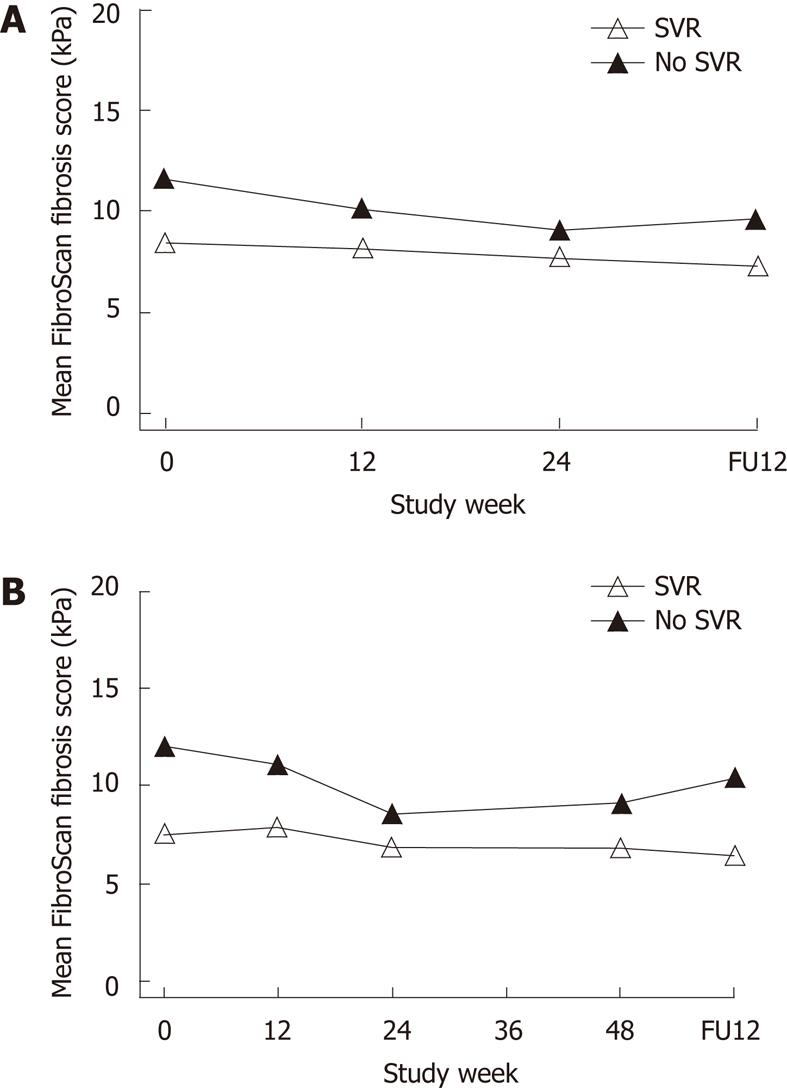
Figure 3 Changes in transient elastography with therapy according to sustained virological response.
Mean FibroScan fibrosis scores over time by sustained virological response status in patients with hepatitis C virus (A) genotypes 2/3 and (B) genotype 1. FU: Follow-up.
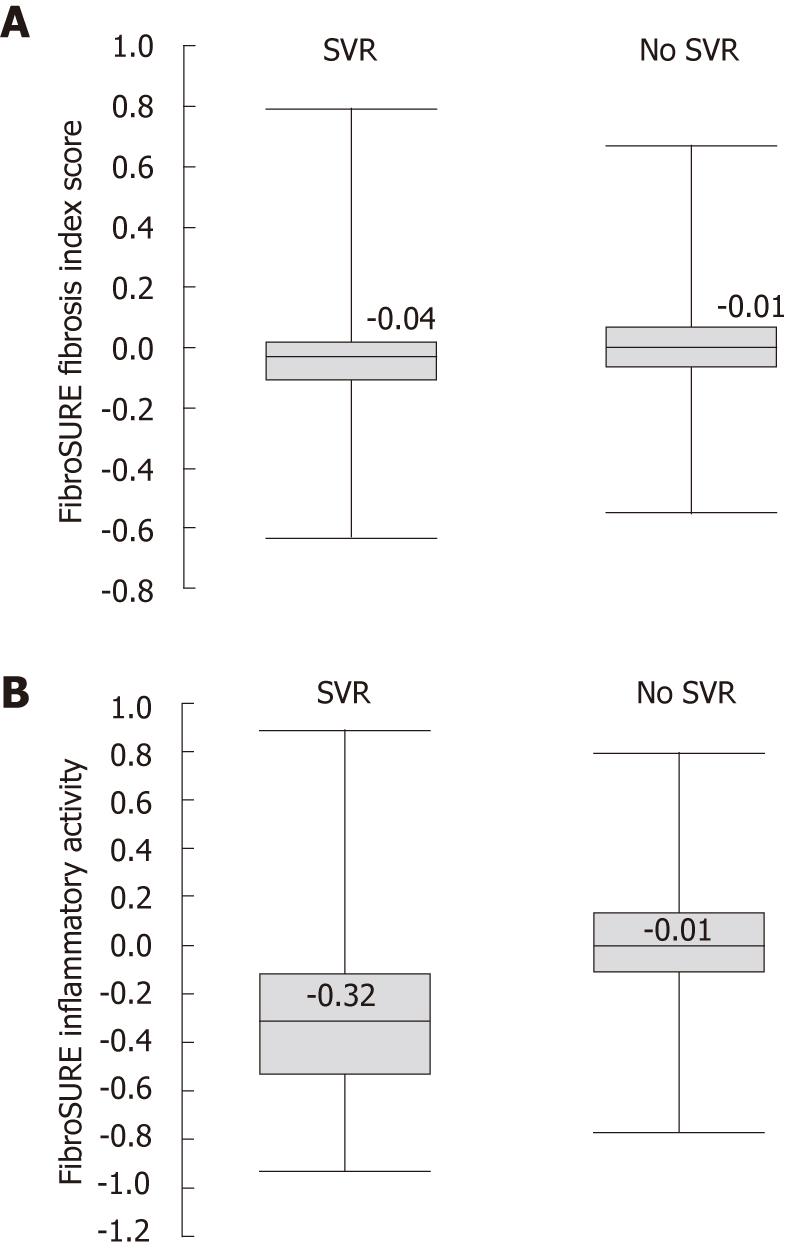
Figure 4 Changes in FibroSURE with therapy according to sustained virological response.
Changes in FibroSURE (A) fibrosis index and (B) inflammatory index at 12 wk post-treatment compared with baseline values by sustained virological response status.
- Citation: Patel K, Friedrich-Rust M, Lurie Y, Grigorescu M, Stanciu C, Lee CM, Schiff ER, Häussinger D, Manns MP, Gerken G, Colle I, Torbenson M, Pulkstenis E, Subramanian GM, McHutchison JG, Zeuzem S. FibroSURE™ and FibroScan® in relation to treatment response in chronic hepatitis C virus. World J Gastroenterol 2011; 17(41): 4581-4589
- URL: https://www.wjgnet.com/1007-9327/full/v17/i41/4581.htm
- DOI: https://dx.doi.org/10.3748/wjg.v17.i41.4581


