Copyright
©2011 Baishideng Publishing Group Co.
World J Gastroenterol. Nov 7, 2011; 17(41): 4563-4571
Published online Nov 7, 2011. doi: 10.3748/wjg.v17.i41.4563
Published online Nov 7, 2011. doi: 10.3748/wjg.v17.i41.4563
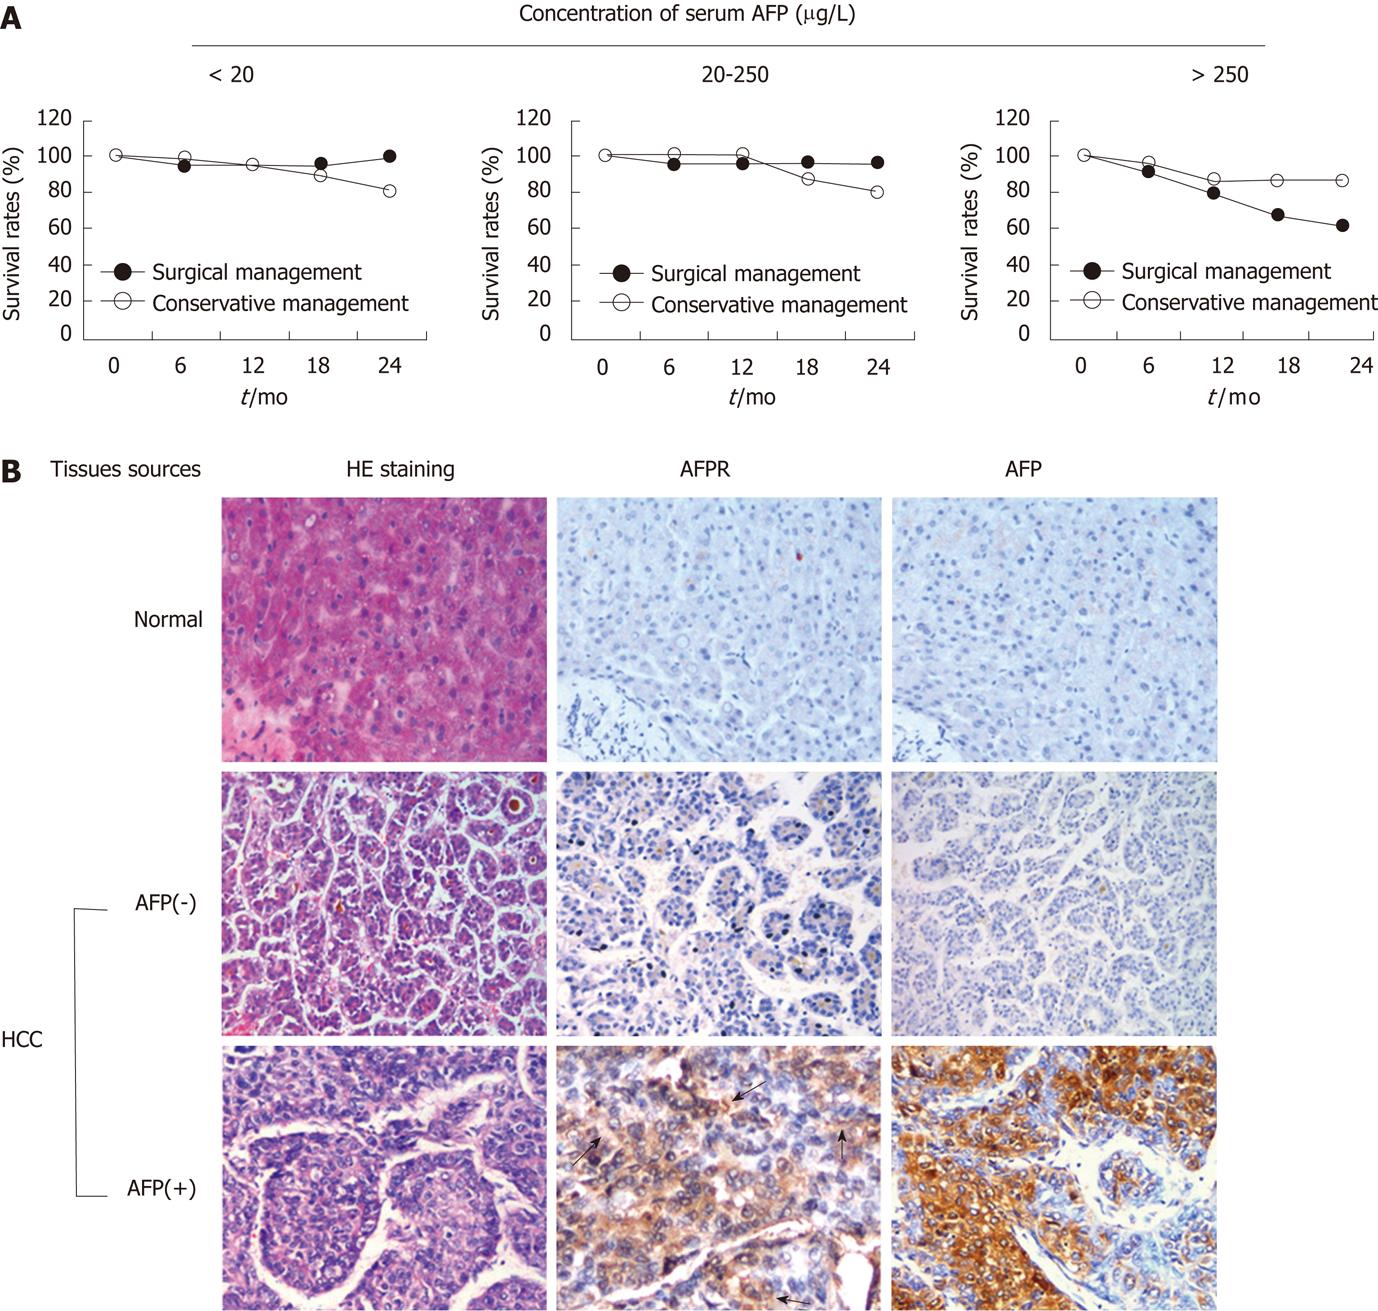
Figure 1 Survival rates of hepatocellular carcinoma patients and expression of alpha fetoprotein and alpha fetoprotein receptor in tumor tissues.
A: Comparison of survival rates in hepatocellular carcinoma (HCC) patients with various alpha fetoprotein (AFP) levels who were treated surgically or non-surgically. Serum AFP levels of these HCC patients were divided into three groups: < 20 μg/L, 20-250 μg/L and > 250 μg/L; B: Immunohistochemical analysis of AFP and AFP receptor (AFPR) expressions in HCC tumor tissues. Membranous expression of AFPR is indicated with arrows. HE: Hematoxylin-eosin staining; AFP: Alpha fetoprotein; AFPR: Alpha fetoprotein receptor; HCC: Hepatocellular carcinoma.
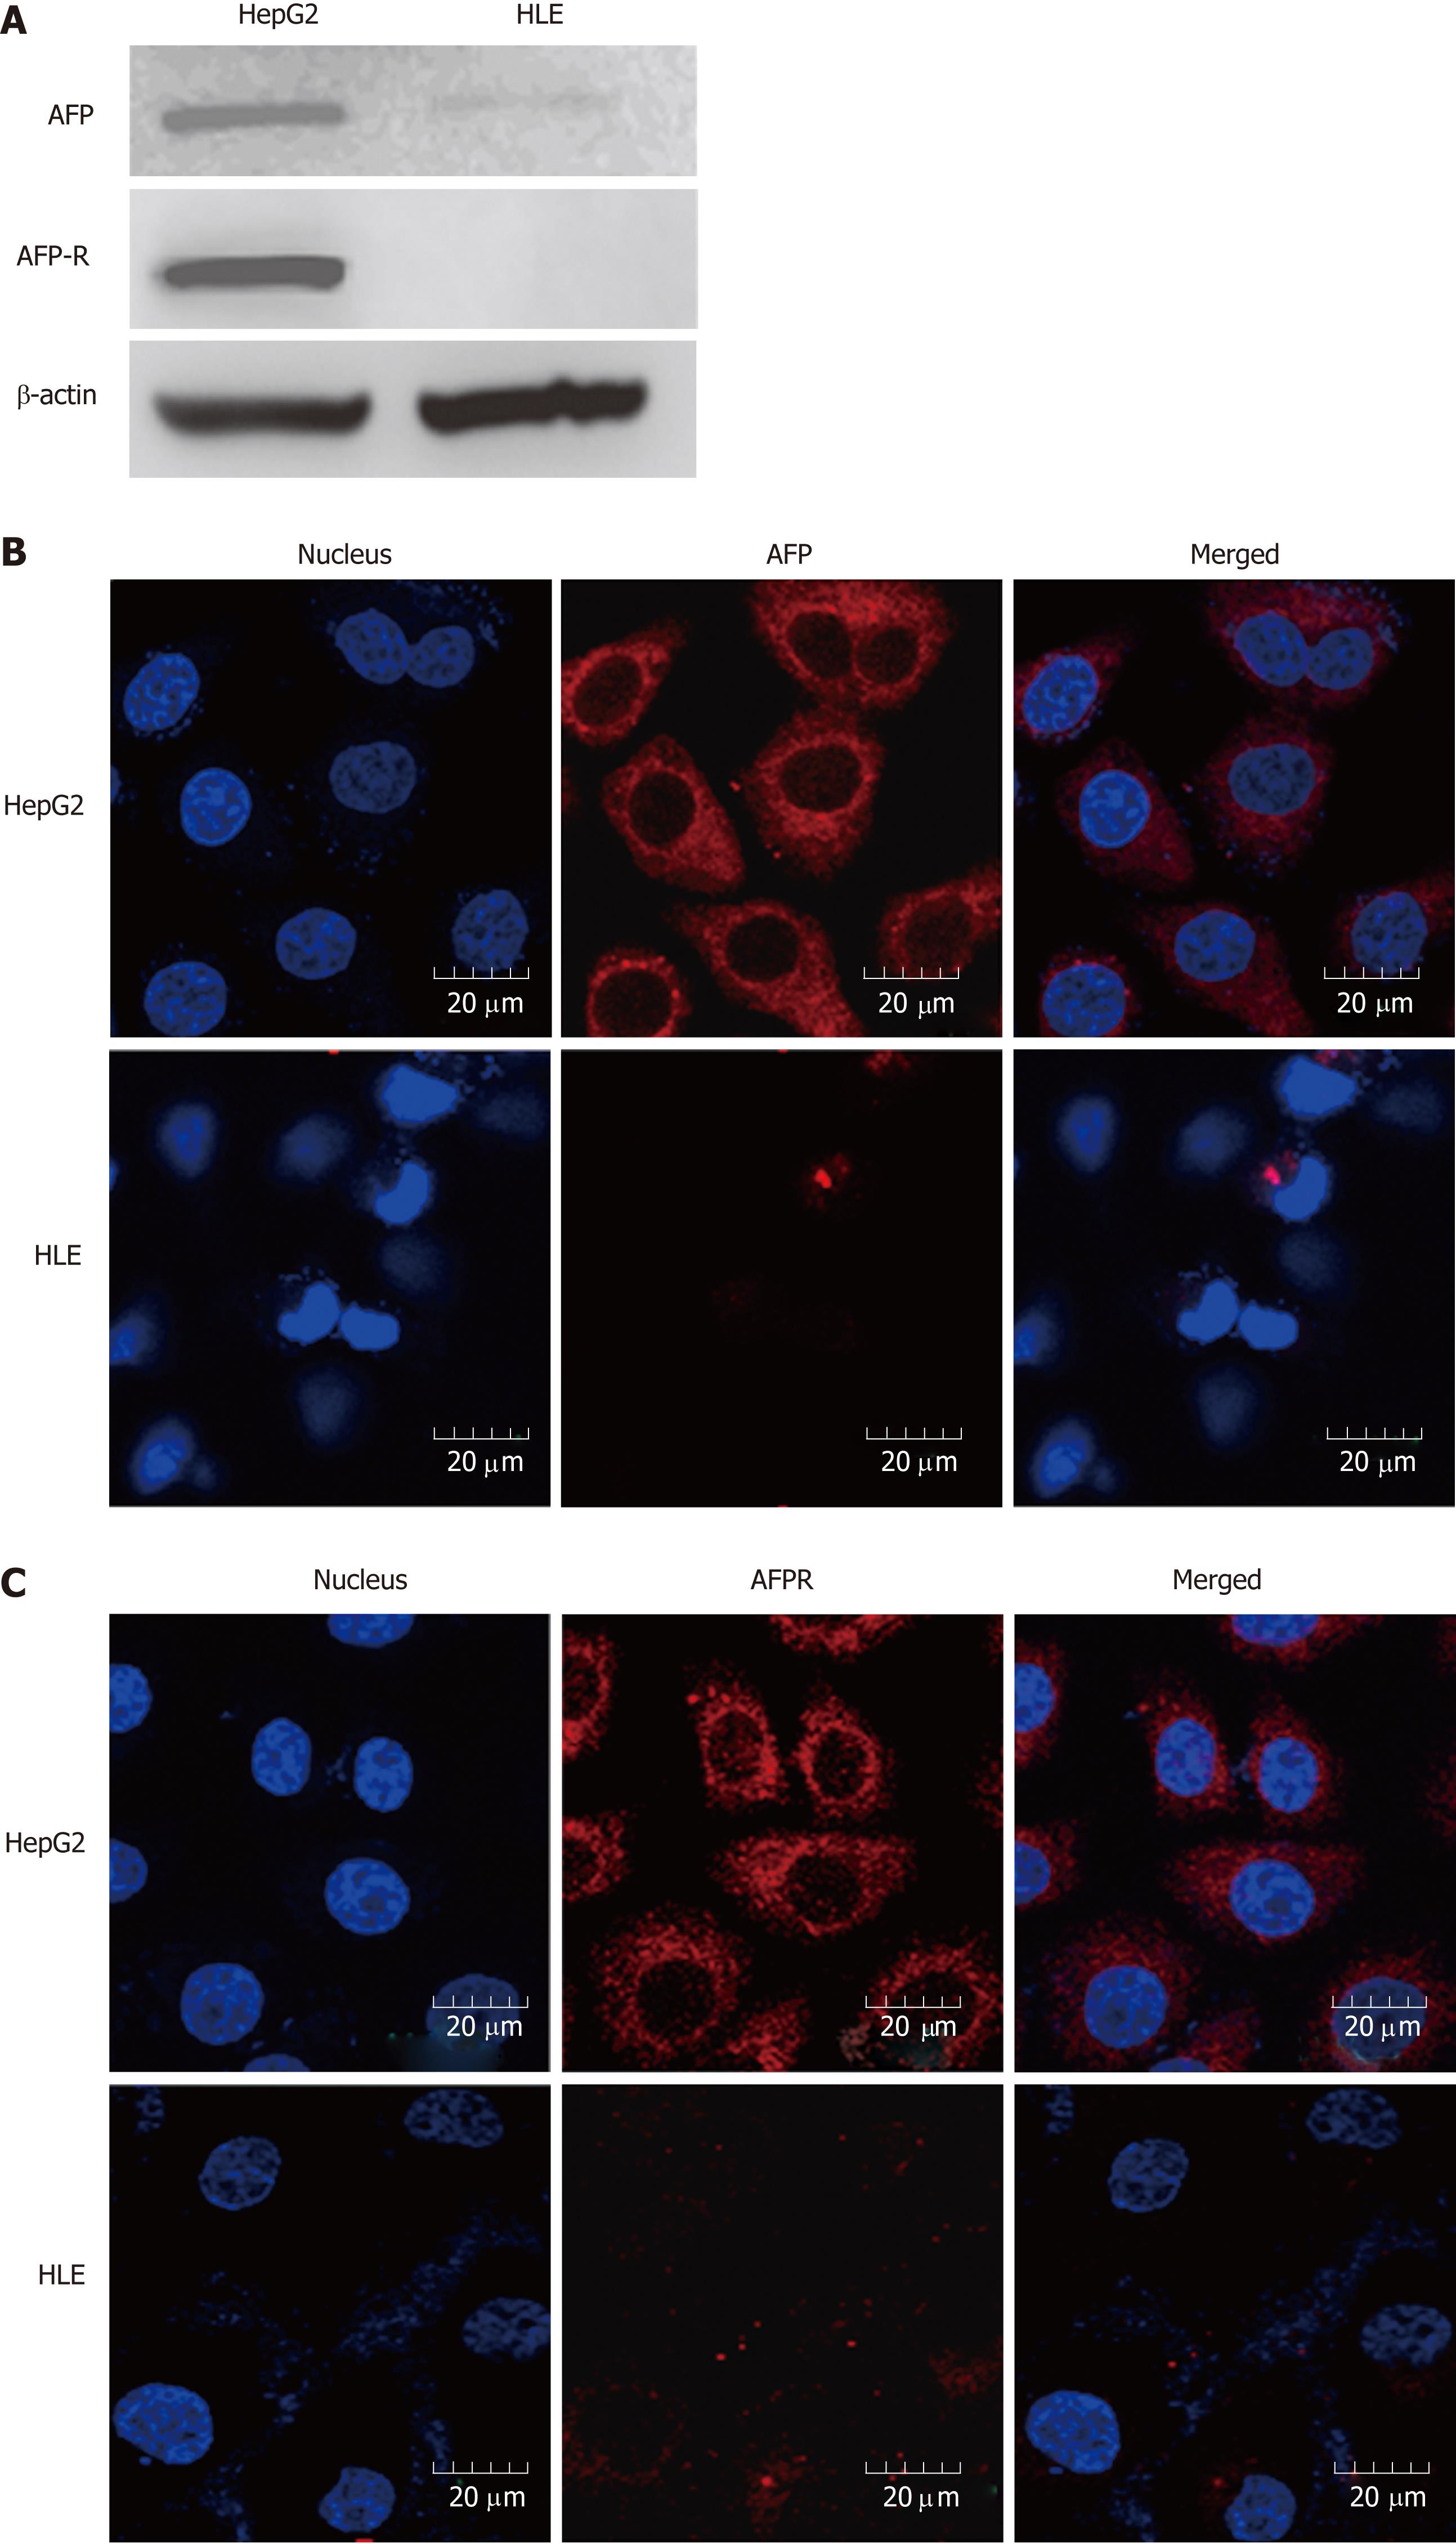
Figure 2 Expression of alpha fetoprotein and alpha fetoprotein receptor in HepG2 and HLE cells.
A: Western blotting; B and C: Confocal microscopy. The immunoblots and images captured by cofocal microscopy are representative of experiments that were repeated at least three times. AFP: Alpha fetoprotein; AFPR: Alpha fetoprotein receptor.
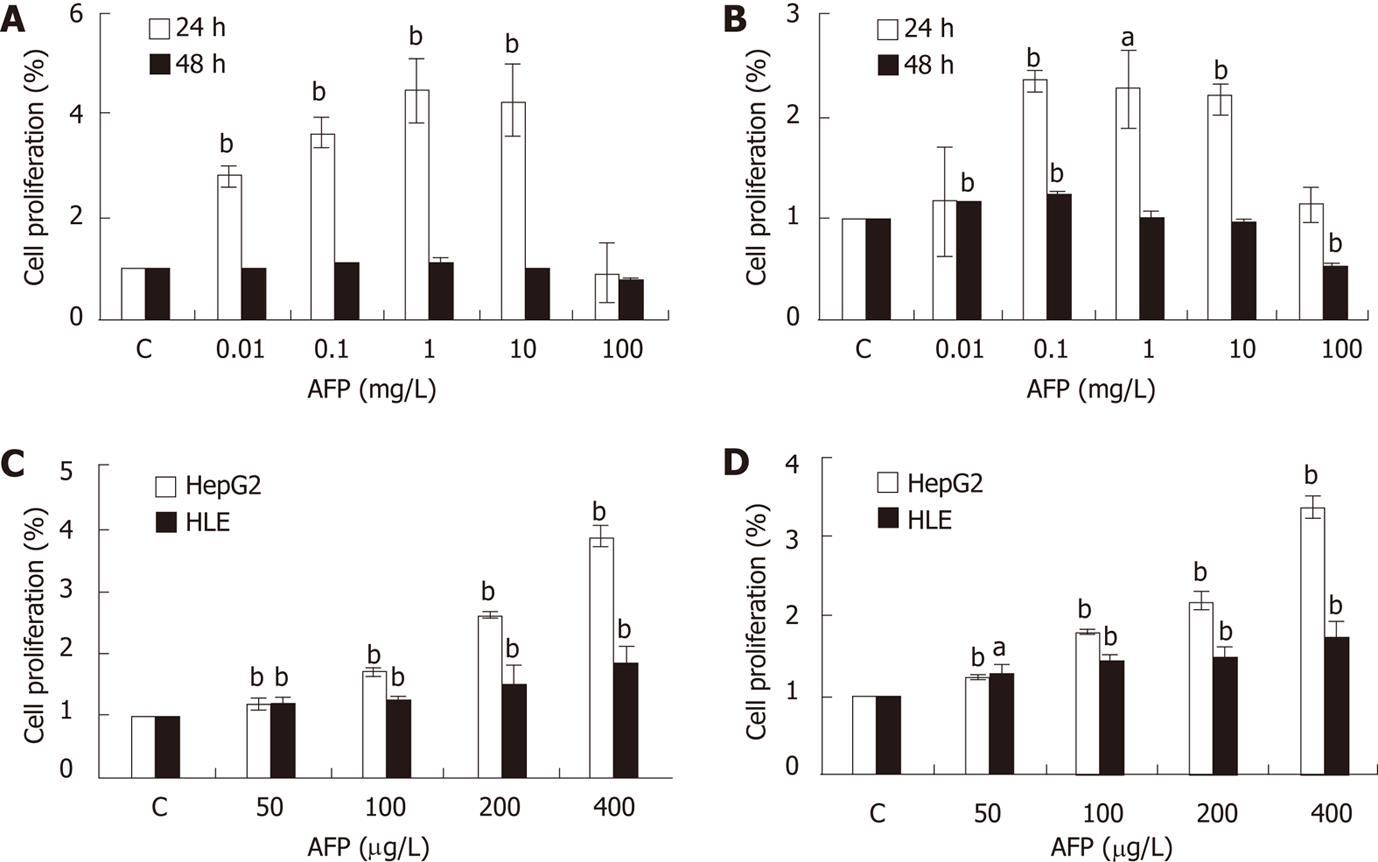
Figure 3 Effects of alpha fetoprotein in proliferation of HepG2 and HLE cells.
Different concentrations (0, 0.01, 0.1, 1, 10 and 100 mg/L) of alpha fetoprotein (AFP) were tested in cell culture. The proliferation of HepG2 (A) and HLE (B) cells was evaluated with the dimethylthiahzolyl-2,5-diphenyl-tetrazolium bromide (MTT) assay at 24 and 48 h. HepG2 and HLE cells were further tested with 0, 50, 100, 200 and 400 μg/L AFP and proliferation was evaluated by MTT (C) and a cell counting kit (cck)-8 assay (D) at 24 h. The differences in proliferation between HepG2 and HLE cells were statistically analyzed with SPSS16 software. Data are representative of experiments that were repeated three times and are presented as mean ± SD for 6-9 samples.
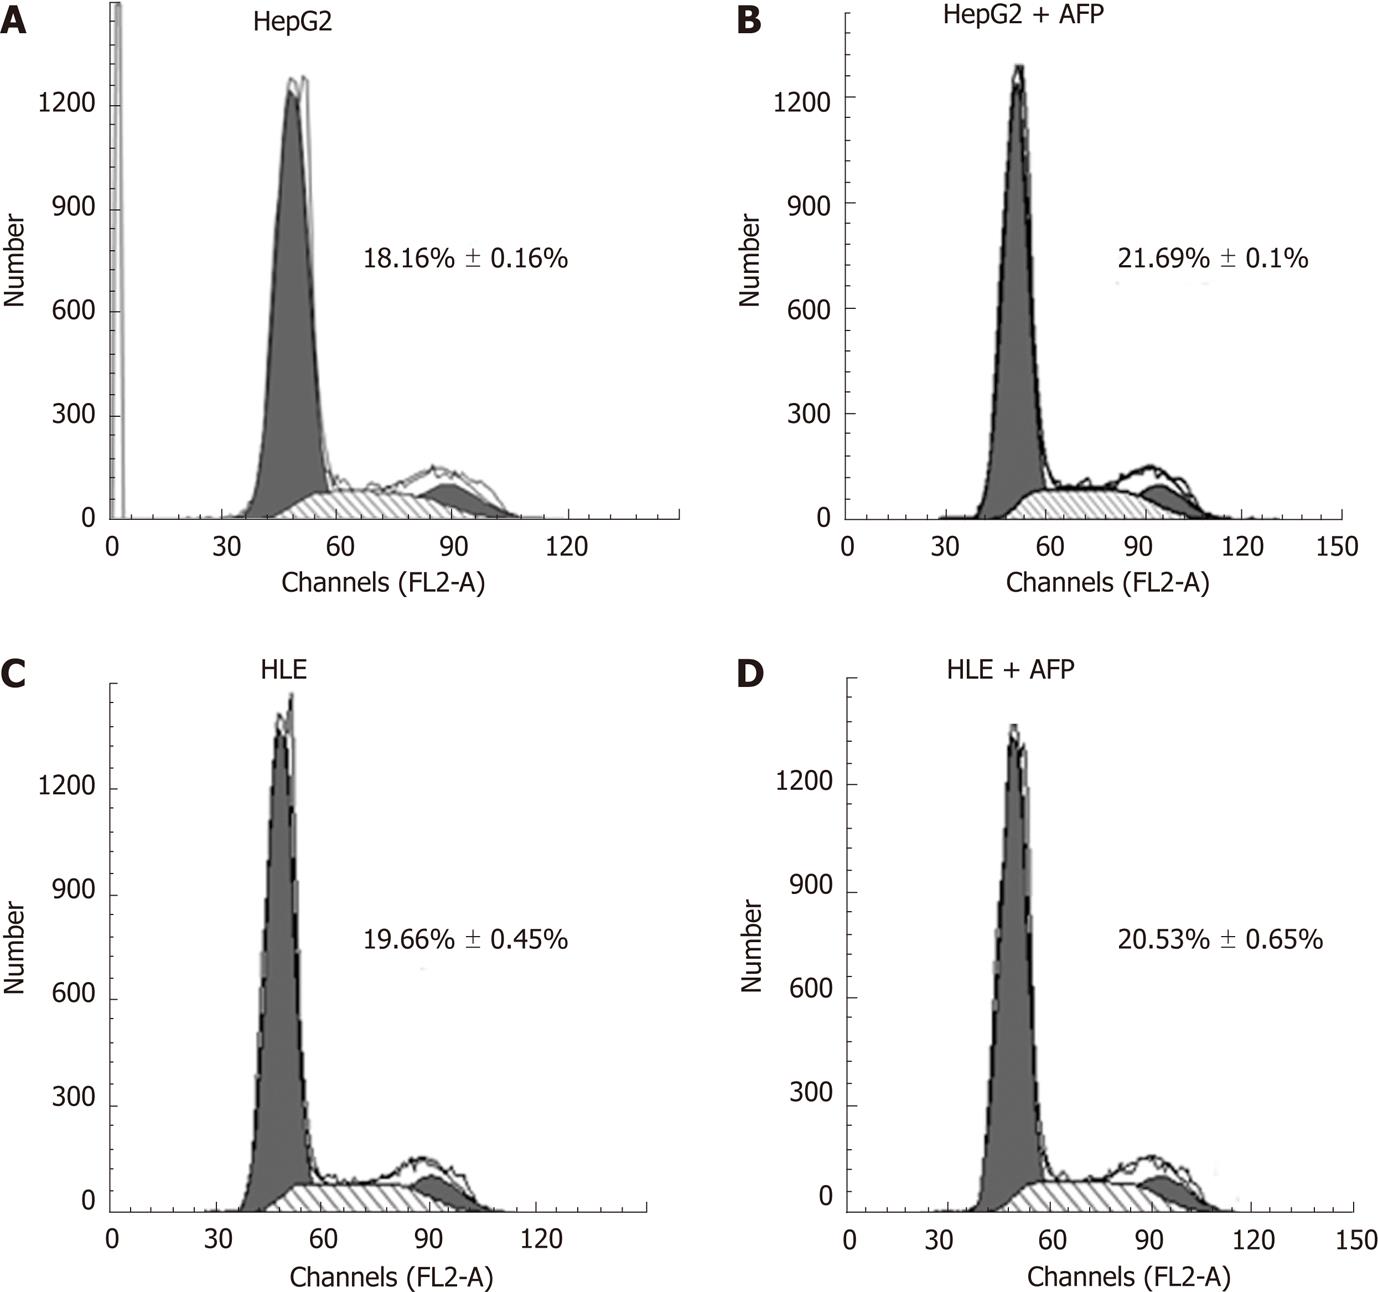
Figure 4 Effects of alpha fetoprotein on cell cycle progression of HepG2 and HLE cells.
The distribution of cells in different cell cycle phases was determined according to DNA content. The data are representative of 3 independent experiments. Each panel represents a different treatment group. A: HepG2 cells without treatment; B: HepG2 cells treated with 400 μg/L alpha fetoprotein (AFP) for 24 h; C: HLE cells without treatment; D: HLE cells treated with 400 μg/L AFP for 24 h. In each panel, the number represents cell percentage in S phase. Data are presented as mean ± SD of 3 samples. AFP: Alpha fetoprotein.
- Citation: Li P, Wang SS, Liu H, Li N, McNutt MA, Li G, Ding HG. Elevated serum alpha fetoprotein levels promote pathological progression of hepatocellular carcinoma. World J Gastroenterol 2011; 17(41): 4563-4571
- URL: https://www.wjgnet.com/1007-9327/full/v17/i41/4563.htm
- DOI: https://dx.doi.org/10.3748/wjg.v17.i41.4563


