Copyright
©2011 Baishideng Publishing Group Co.
World J Gastroenterol. Oct 7, 2011; 17(37): 4191-4198
Published online Oct 7, 2011. doi: 10.3748/wjg.v17.i37.4191
Published online Oct 7, 2011. doi: 10.3748/wjg.v17.i37.4191
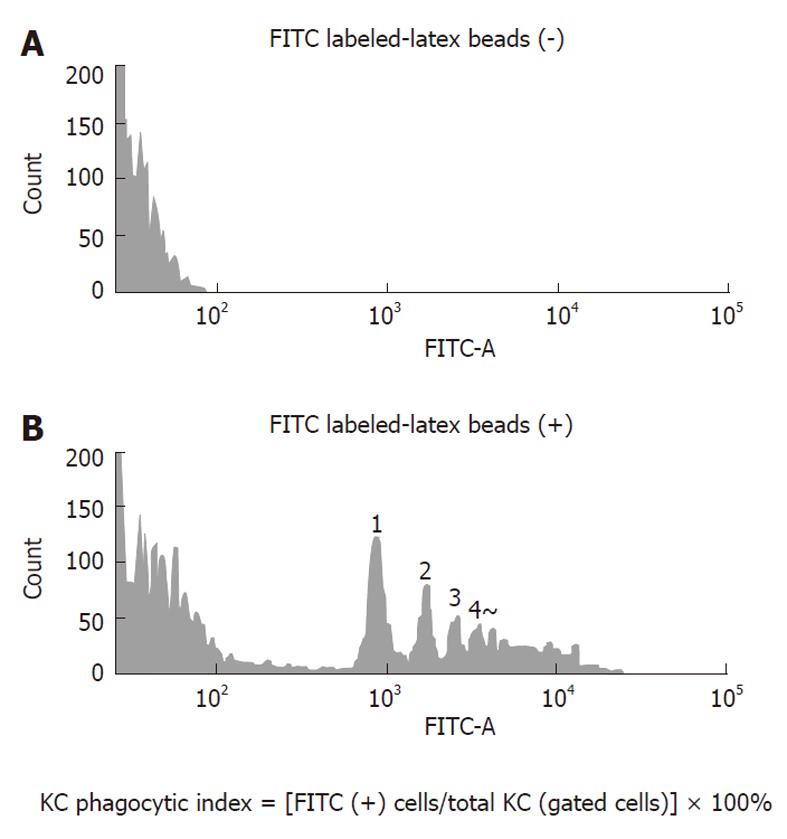
Figure 1 Measurement of Kupffer cells phagocytic activity by flow cytometry.
A: The negative control, into which fluoresceinisothiocyanate (FITC)-labeled latex beads were not injected; B: The positive control to which FITC-labeled latex beads were administered. Note the several peaks of the FITC from the beads in the positive control. The numbers on the peak shows the number of latex beads phagocytosed. KC: Kupffer cell.
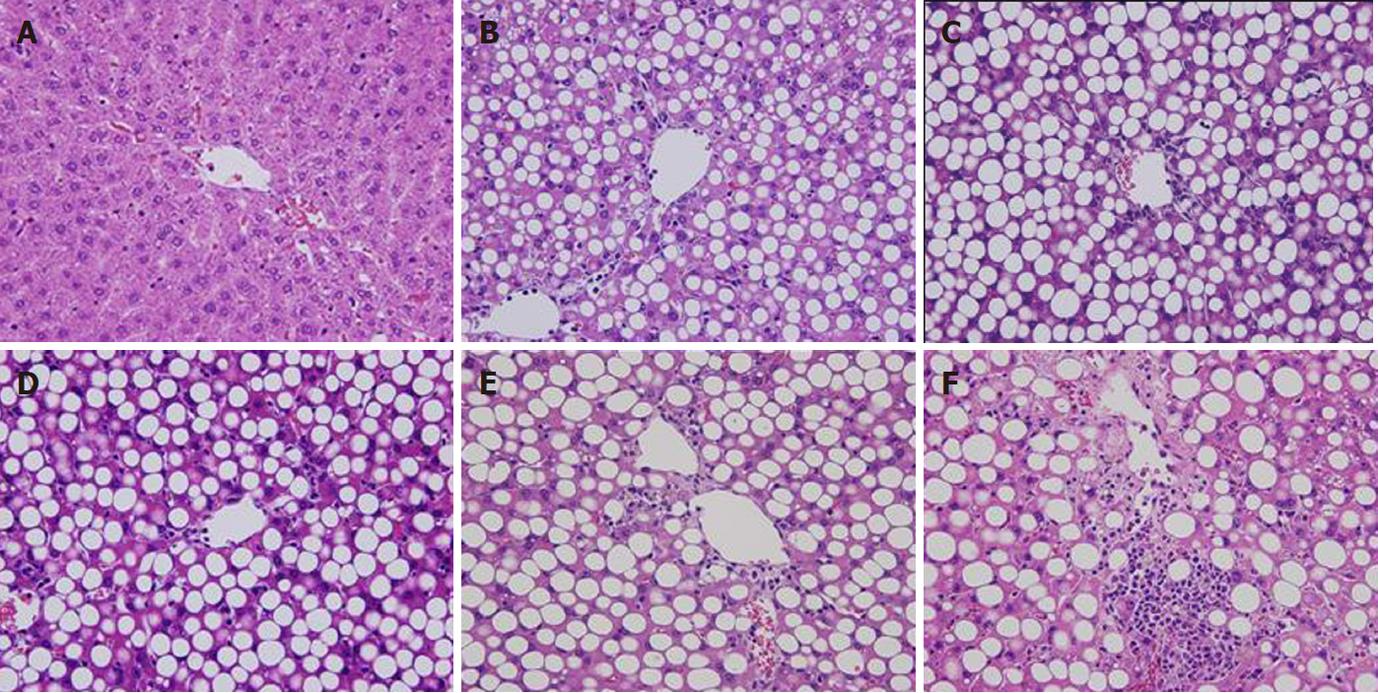
Figure 2 Histological changes of methionine choline-deficient diet-fed rat liver (hematoxylin eosin x 200).
Extremely large vesicle fat deposits in almost the entire lobules were detected even as early as two weeks after the start of the methionine choline-deficient diet. By 8 wk, spotty necrosis was dispersed and by 16 wk, there was fibrosis extending from the central vein. A: Control; B: Two weeks methionine choline-deficient (MCD); C: Four weeks MCD; D: Eight weeks MCD; E: Twelve weeks MCD; F: Sixteen weeks MCD.
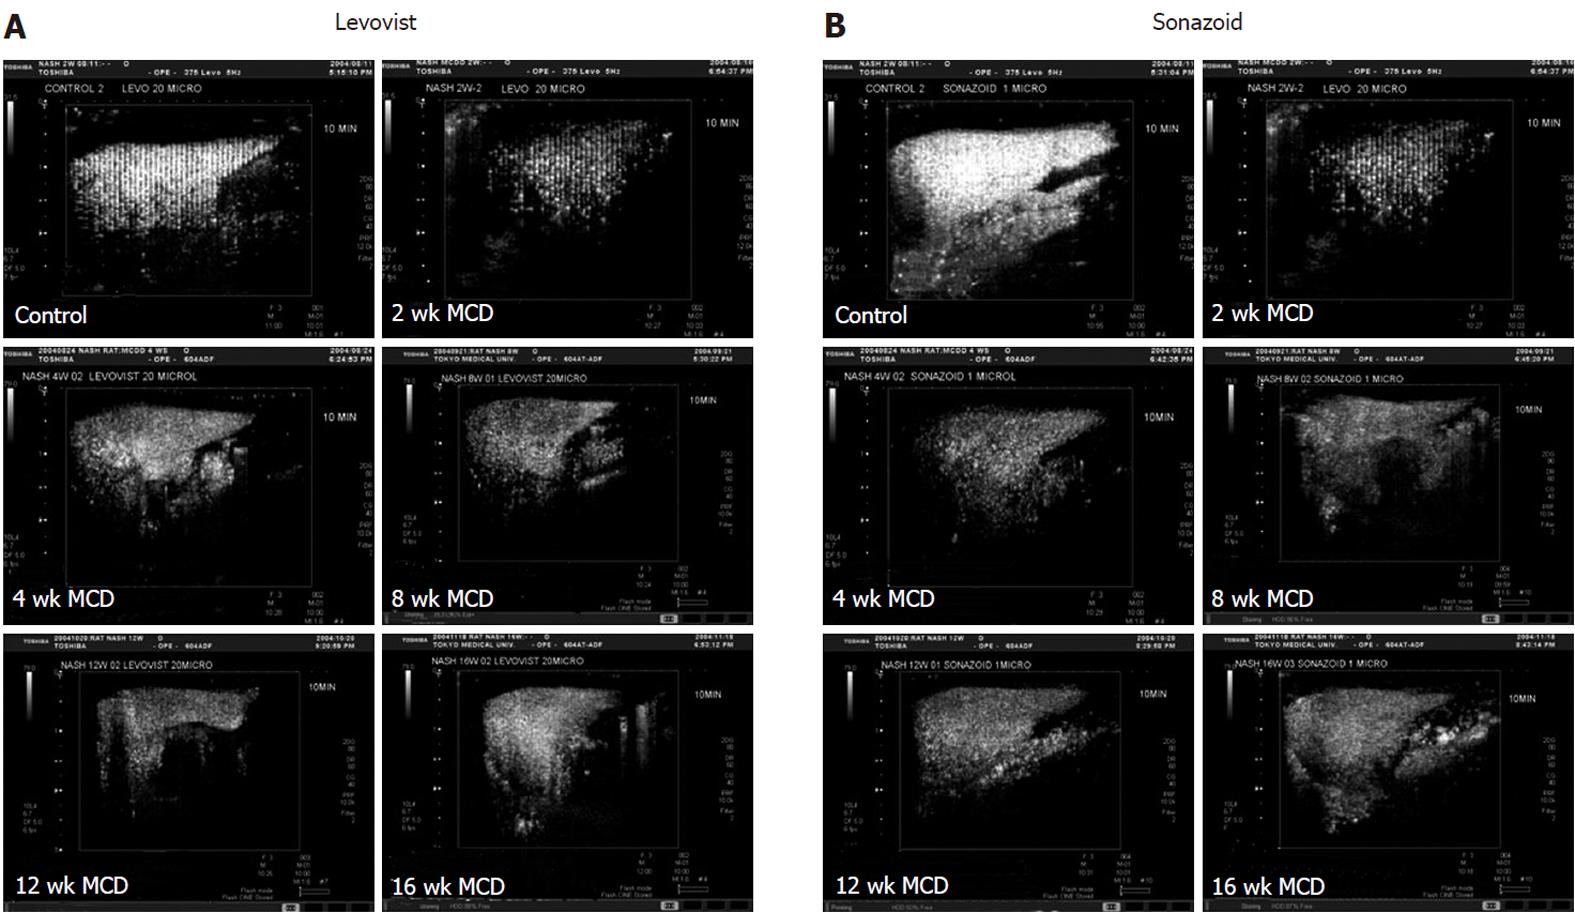
Figure 3 Ultrasound images of the liver 10 min after LevovistTM (A) and SonazoidTM injection (B).
Note signal intensity of the liver was lower in all methionine choline-deficient diet rats than in the controls. MCD: Methionine choline-deficient.
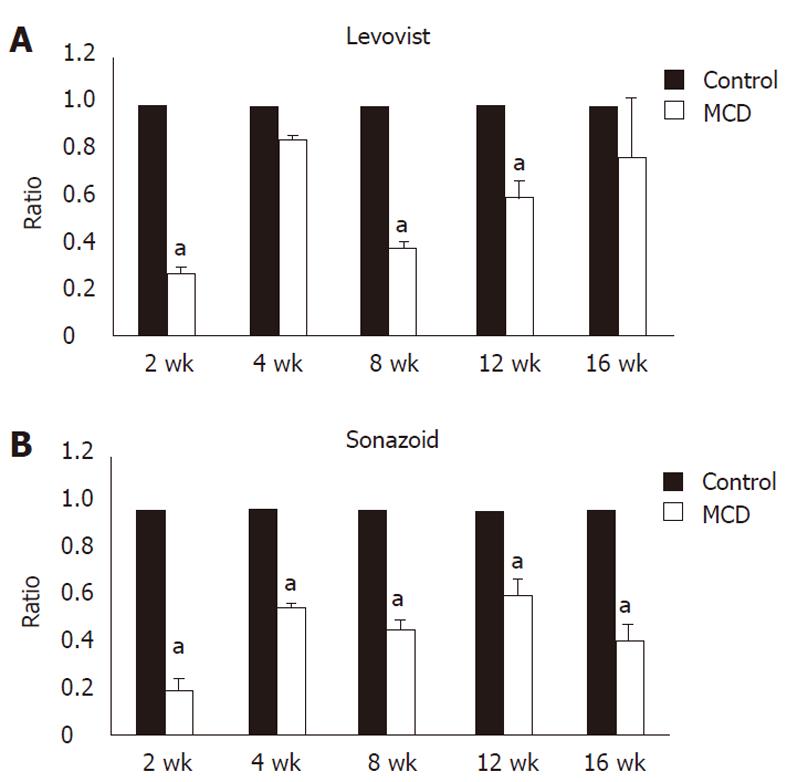
Figure 4 Changes in the signal intensity between control and methionine choline-deficient diet livers.
A: LevovistTM contrast enhanced ultrasonography (CEUS). In the methionine choline-deficient diet (MCDD) liver, there was a significant decrease in LevovistTM signal intensity, compared to control livers at 2, 8 and 12 wk. While there was a lower tendency in signal intensity in MCDD liver than control liver at 4 and 16 wk, however, significance was not obtained; B: SonazoidTM CEUS. In the MCCD liver, there was a significant decrease in SonazoidTM signal intensity, compared to control livers at all time points. MCD: Methionine choline-deficient. aP < 0.05 vs control.
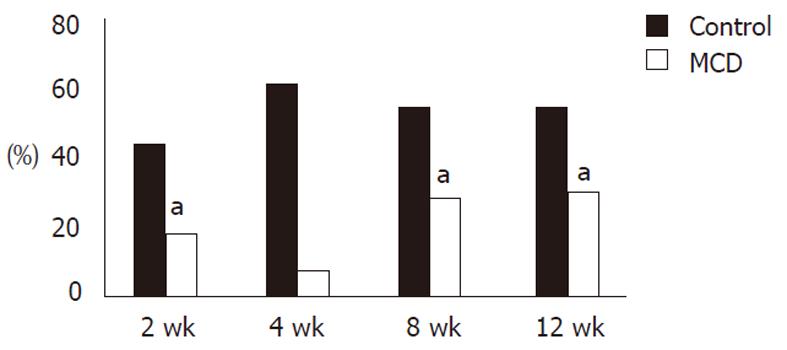
Figure 5 Decreased phagocytic activity in Kupffer cells from methionine choline-deficient dietrats compared to Kupffer cells from control rats.
Control and methionine choline-deficient diet (MCDD) rats were injected with fluoresceinisothiocyanate (FITC)-labeled latex beads and Kupffer cells (KCs) were isolated 1 h later. KCs which had phagocytosed FITC-labeled latex beads were counted by flow cytometry and changes in the phagocytic activity were compared between control and MCDD KCs. Note that there was an almost 50% decrease in phagocytic activity in KCs from MCDD, compared to KCs from controls. aP < 0.05 vs control.
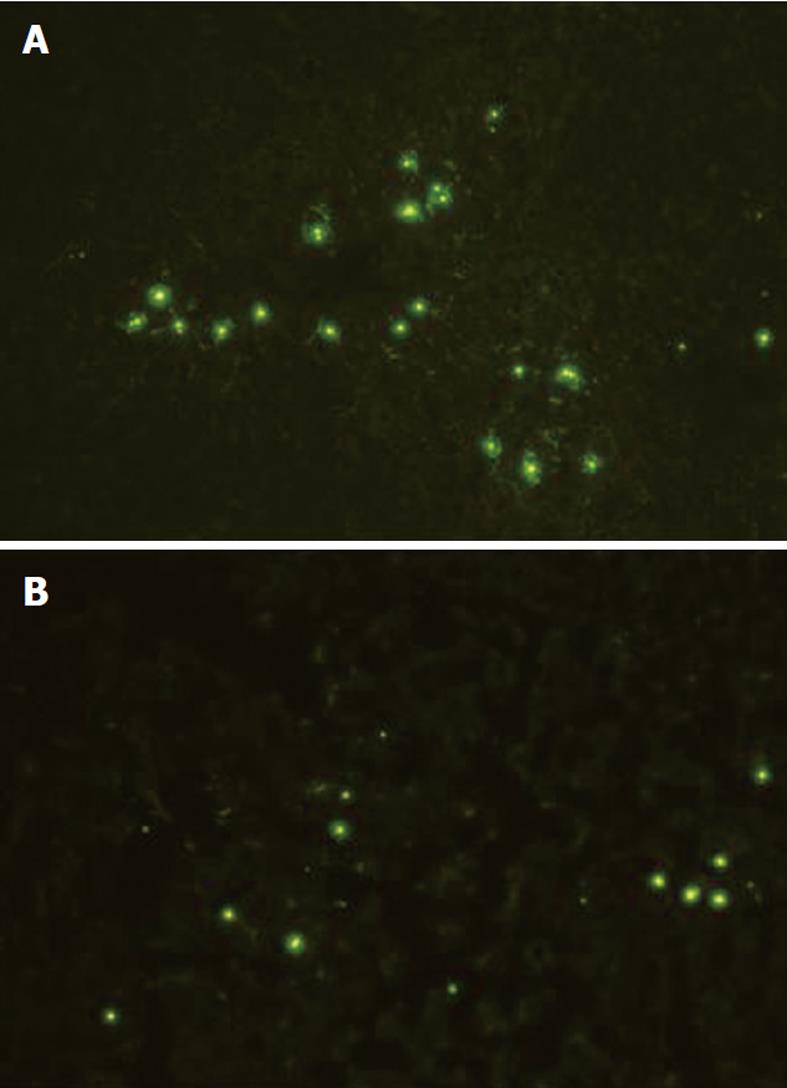
Figure 6 Fluoresceinisothiocyanate-labeled latex beads were injected through the tail veins of control and methionine choline-deficient diet rats.
One hour later, small samples of the liver were snap frozen and sectioned using a cryostat. After immediate drying, unfixed tissues were observed by fluorescence microscopy. Note that there were fewer fluoresceinisothiocyanate-labeled latex beads in the livers from methionine choline-deficient diet (B) compared to the controls (A). Magnification: x 200.
- Citation: Miyata Y, Miyahara T, Moriyasu F. Decreased accumulation of ultrasound contrast in the liver of nonalcoholic steatohepatitis rat model. World J Gastroenterol 2011; 17(37): 4191-4198
- URL: https://www.wjgnet.com/1007-9327/full/v17/i37/4191.htm
- DOI: https://dx.doi.org/10.3748/wjg.v17.i37.4191


