Copyright
©2011 Baishideng Publishing Group Co.
World J Gastroenterol. Aug 21, 2011; 17(31): 3614-3622
Published online Aug 21, 2011. doi: 10.3748/wjg.v17.i31.3614
Published online Aug 21, 2011. doi: 10.3748/wjg.v17.i31.3614
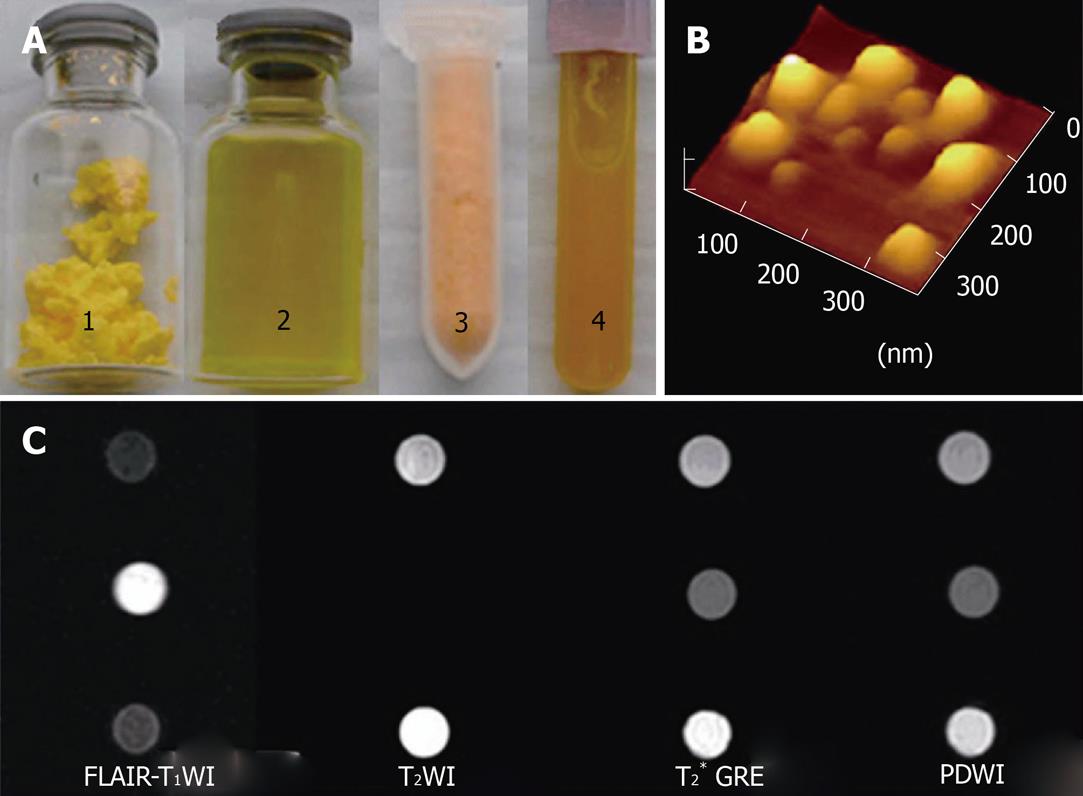
Figure 1 Characterization of solid lipid nanoparticles.
A: Gadopentetate dimeglumine and fluorescein isothiocyanate-loaded solid lipid nanoparticles (Gd-FITC-SLNs) freeze-dried powder (1) and dispersion (2); Fluorescein isothiocyanate solid lipid nanoparticles (FITC-SLNs) freeze-dried powder (3) and dispersion (4); B: Atomic force microscopy images of blank solid lipid nanoparticles; C: Magnetic resonance (MR) images of FITC-SLNs dispersions (top). Gd-FITC-SLN suspension (middle). Water (bottom) obtained with fluid attenuated inversion recovery (FLAIR) (left ), T2WI (middle left ), T2* GRE (middle right) and PDWI (right). FLAIR was obtained with the following parameters: 2000/11.1/750/2, TR/TE/TI/NEX; T2WI: 3860/106/2 (TR/TE/NEX); T2* GRE: 550/14/2/200 (TR/TE/NEX/Flip); PDWI: 3220/12/1 (TR/TE/NEX). Both sequences used a 256 × 160 matrix, a 140 mm FOV, and 4-mm-thick sections.
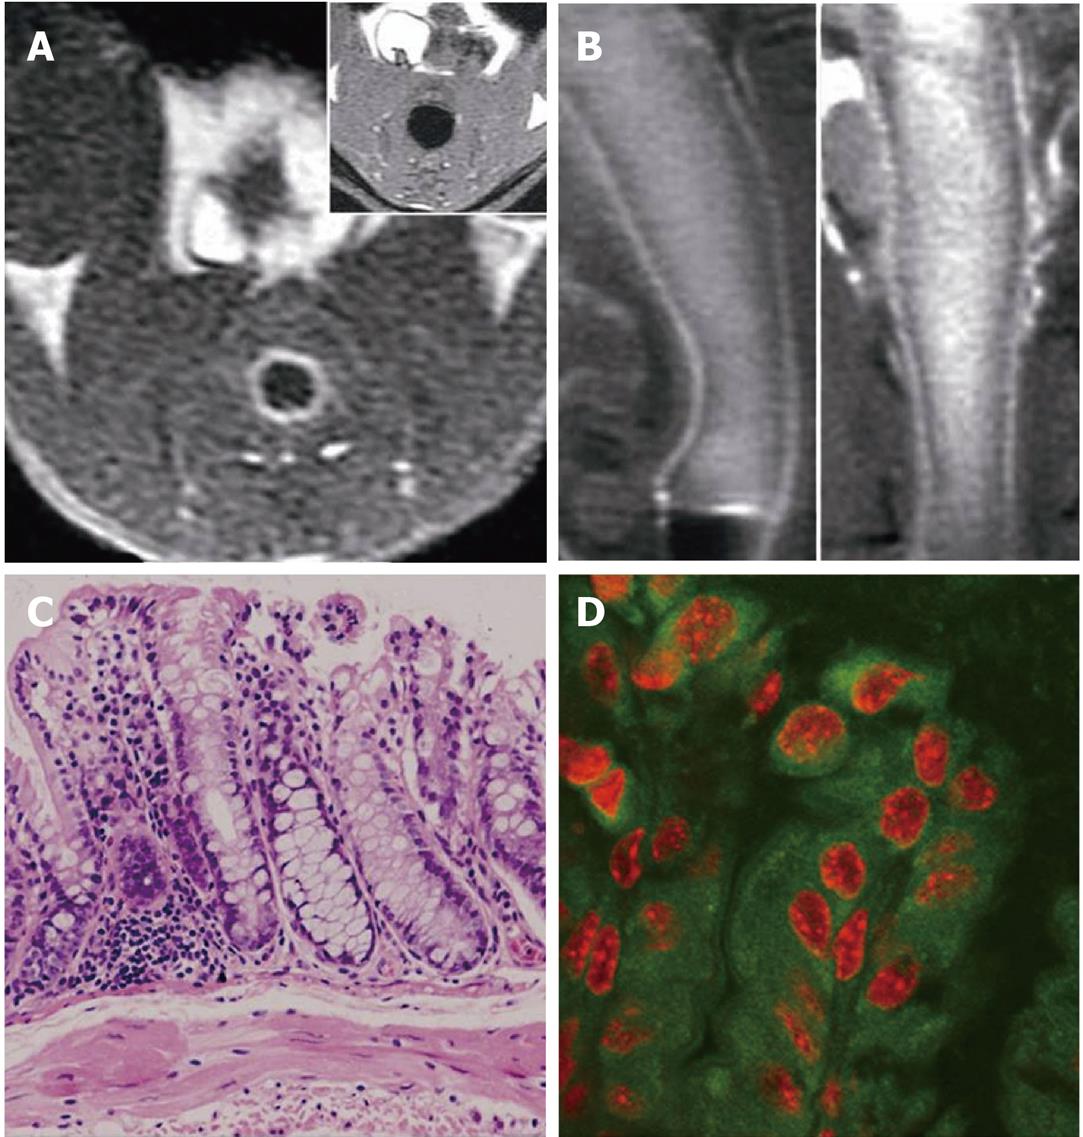
Figure 2 Magnetic resonance and fluorescent images of colorectal wall in normal mouse and bright rim sign in 1,2-dimethylhydrazine treated mouse.
A: Axial fluid attenuated inversion recovery (FLAIR) image 5 min after gadopentetate dimeglumine and fluorescein isothiocyanate (FITC)-loaded solid lipid nanoparticle enema, showing the homogeneous mural enhancement; B, C: No abnormity was found in hematoxylin and eosin slices of the mouse; D: Laser-scanning confocal fluorescence microscope image of the post-enema colorectal wall of normal mouse with diamidino-phenyl-indole (DAPI) stain, showing the dense cytoplastic FITC deposition and red DAPI-stained nucleus.
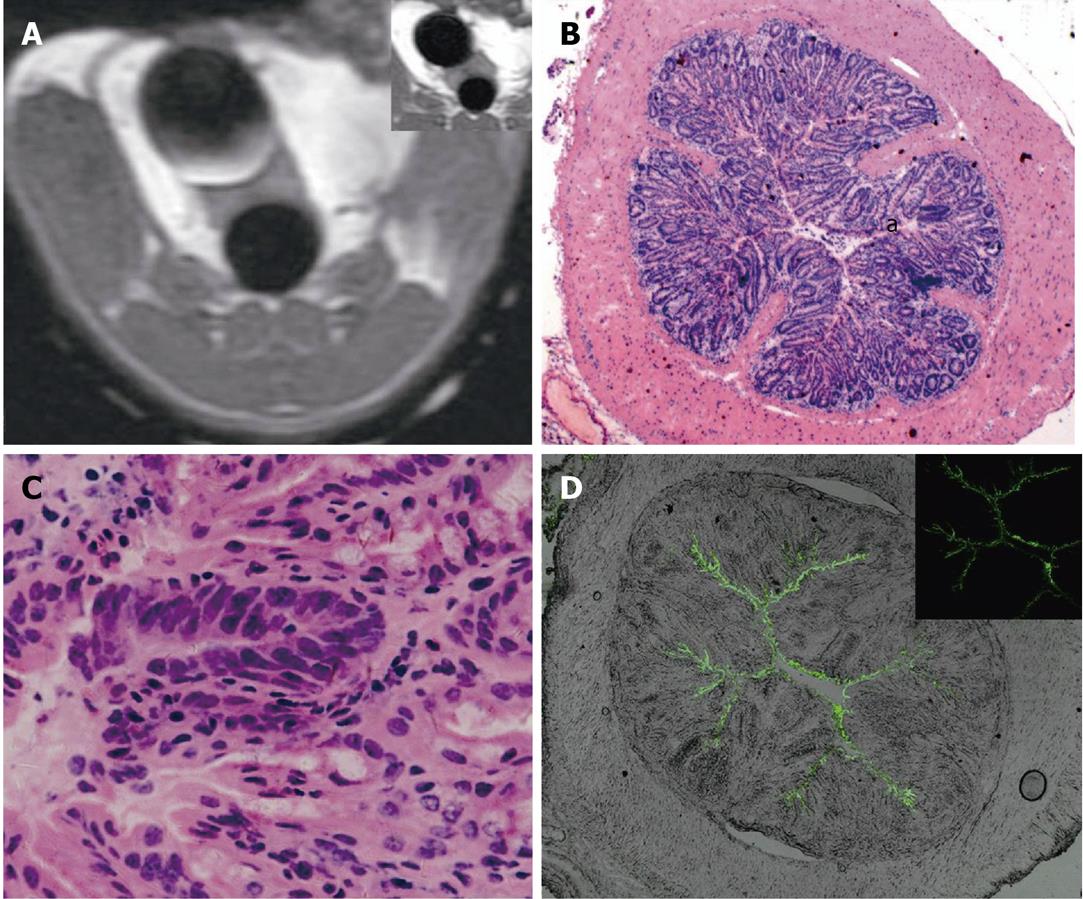
Figure 3 Magnetic resonance and fluorescent images of 1,2-dimethylhydrazine impaired colorectal wall.
A: Axial fluid attenuated inversion recovery (FLAIR) image 5 min after gadopentetate dimeglumine (Gd-DTPA) and fluorescein isothiocyanate (FITC)-loaded solid lipid nanoparticle enema. No mural enhancement was identified. Note the bladder Gd-DTPA deposition (top right: pre-enema FLAIR image ); B, C: Hematoxylin and eosin image of the same slice; nuclear atypia identified; B: × 40; C: × 400. D: Laser-scanning confocal fluorescence microscope image of the post-enema colorectal wall, showing the linear extracellular FITC deposition along the mucosa.
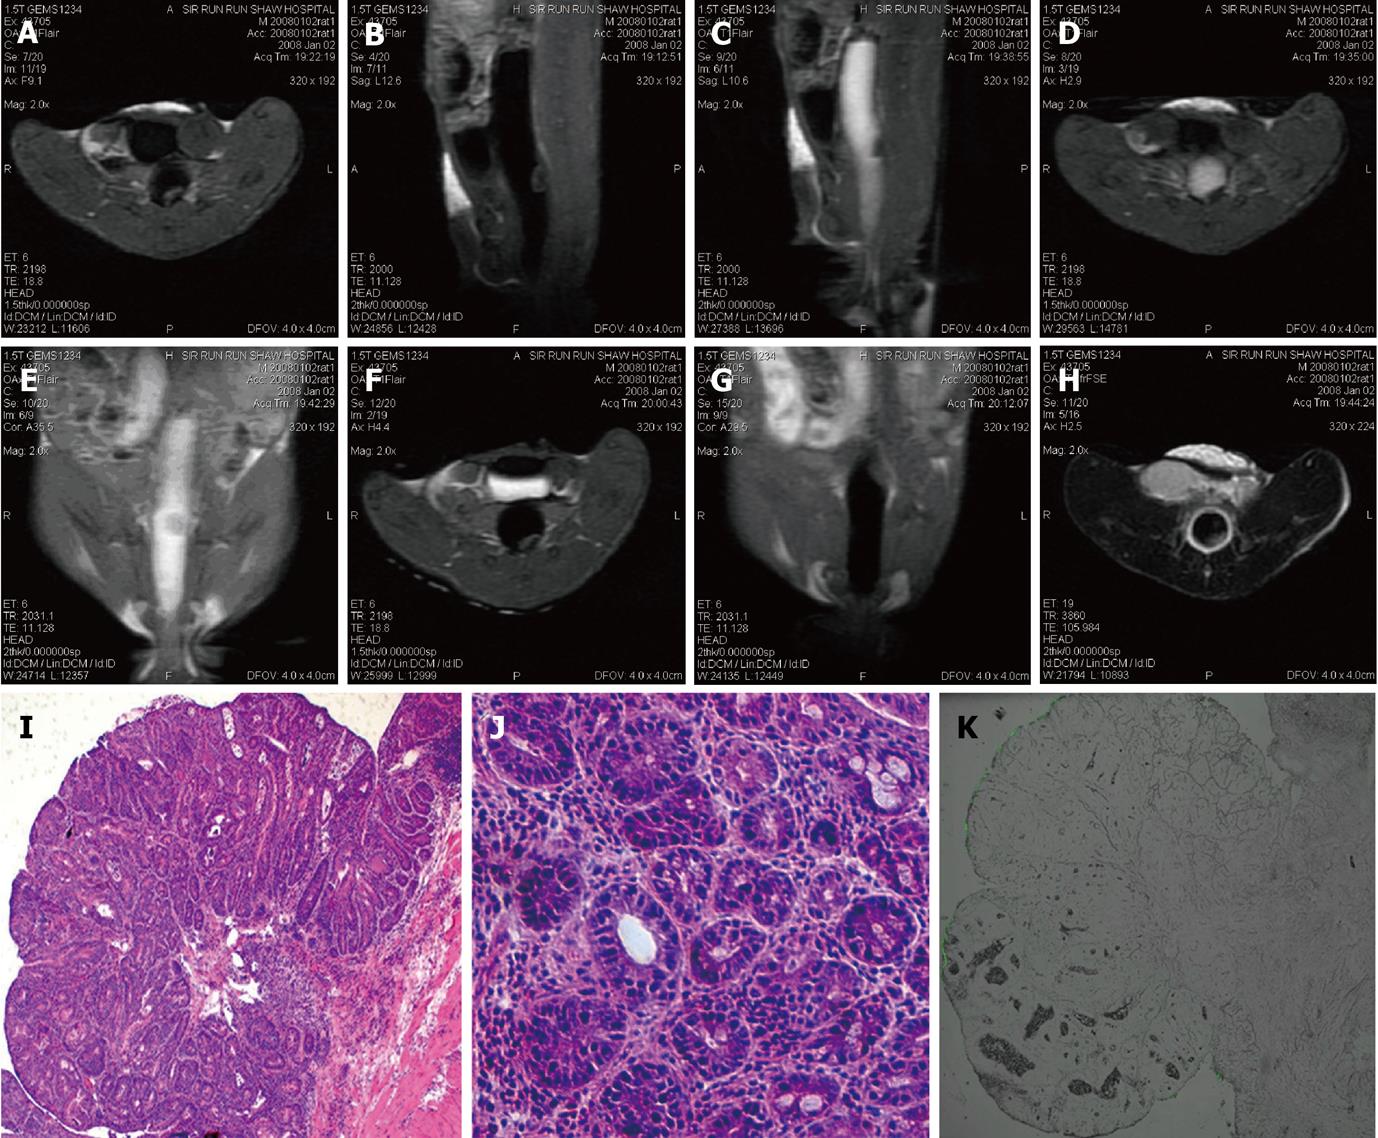
Figure 4 Magnetic resonance and fluorescent images of a non-enhanced adenoma.
A, B: Axial and sagittal pre-enema fluid attenuated inversion recovery (FLAIR) images, note the inner low signal of the mass; C-E: The mass manifests as a filling deficit in the gadopentetate dimeglumine (Gd-DTPA) and fluorescein isothiocyanate-loaded solid lipid nanoparticle (Gd-FITC-SLN) enema inflated FLAIR images; F, G: No enhancement identified after the enema. Note the bladder Gd-DTPA deposition; H: Axial T2 weighted image after the Gd-FITC-SLN enema. Iso-signal observed in the adenoma; high signal observed for the bowel wall; I-K: Hematoxylin and eosin and laser-scanning confocal fluorescence microscope images of the adenoma.
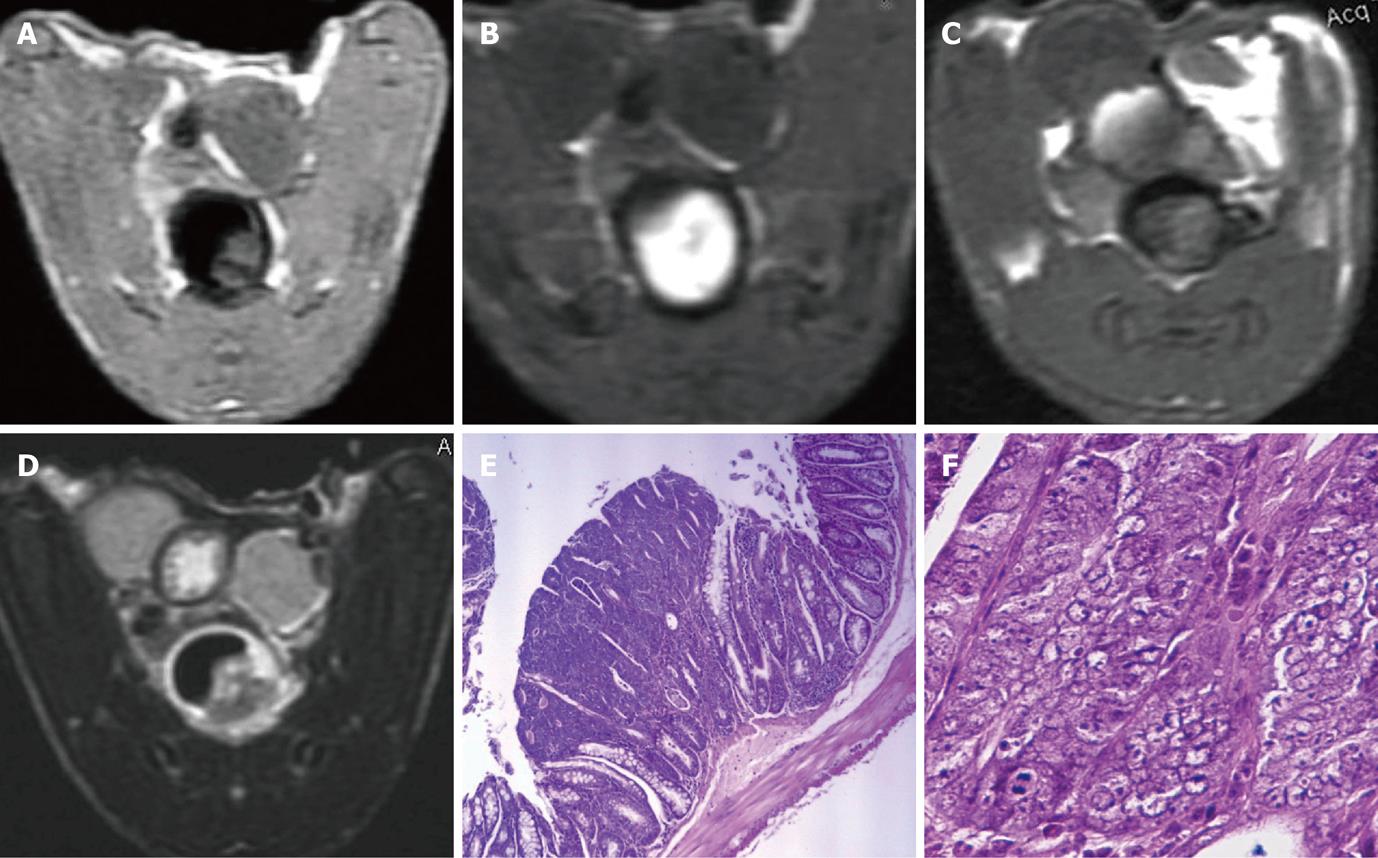
Figure 5 Magnetic resonance and histological images of adenocarcinoma.
A: An irregular-shaped mass in the pre-enema fluid attenuated inversion recovery (FLAIR) image; B: Low signal ring around the bright lumen (halo sing) in the in-enema FLAIR image; C: Tumor enhancement and bladder imaging agents accumulation both occurred in the post-enema FLAIR image; D: T2 weighted post-enema image, heterogeneous signal intensity within the tumor; E, F: Hematoxylin and eosin images of the tumor, adenocarcinoma cells identified.
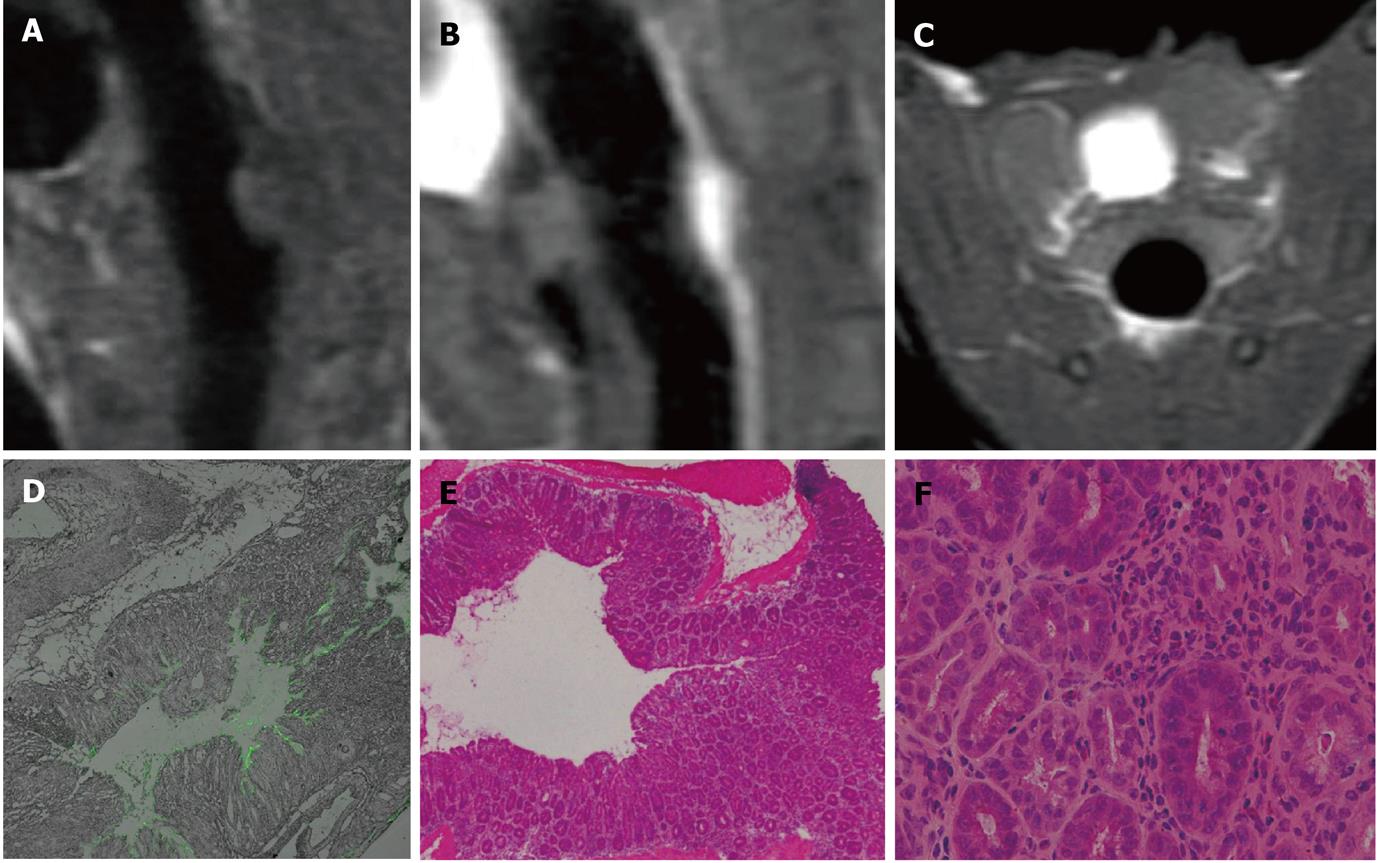
Figure 6 Peri-tumor interstitial fluorescein isothiocyanate deposition.
A: A broad-based mass (high-level adenoma) in the pre-enema fluid attenuated inversion recovery (FLAIR) image; B, C: Tumor and peri-tumor mural enhancement, together with bladder imaging agent accumulation, in the post-enema FLAIR image; D: Interstitial linear fluorescein isothiocyanate deposition in the peri-tumor colorectal wall; E, F: Hematoxylin and eosin images at the same slice, obvious nuclear atypia identified.
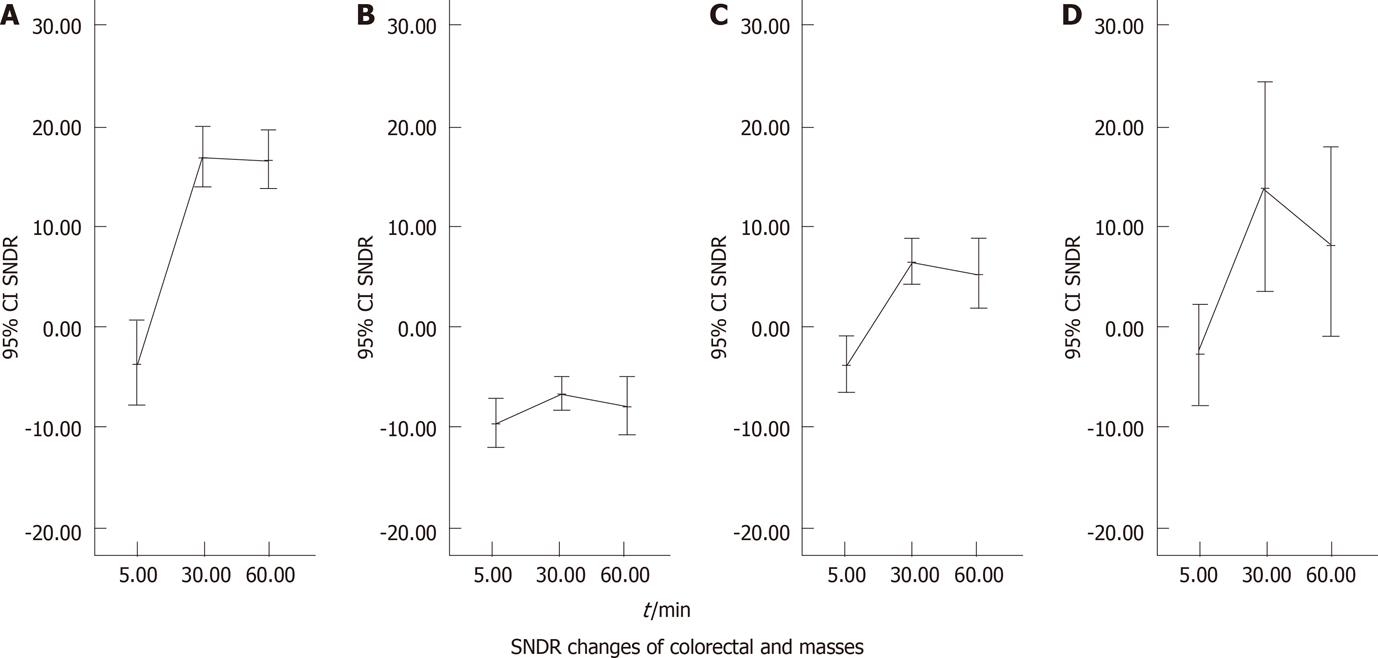
Figure 7 The signal intensity difference-to-noise ratios changes of colorectal wall and masses before and after the gadopentetate dimeglumine and fluorescein isothiocyanate-loaded solid lipid nanoparticle enema.
A: The signal intensity difference-to-noise ratios (SDNRs) of colorectal wall in normal mice increased sharply after 20 min of the gadopentetate dimeglumine and fluorescein isothiocyanate-loaded solid lipid nanoparticle (Gd-FITC-SLN) enema (P < 0.01) and remain at a high level in the following 30 min with a minimum decrease (P > 0.05); B: The SDNRs of colorectal wall in group 1 [1,2-dimethylhydrazine (DMH) treated for 10 wk] increased significantly, with about one half of the amplitude compared with that of the normal mice, after the Gd-FITC-SLN enema; a visible decrease with no statistical significance (P > 0.05) of SDNRs occurred in the following 30 min; C: The SDNRs of colorectal wall in group 2 (DMH treated for 16 wk) increased and decreased non-significantly in post-enema images (P > 0.01); D: The SDNRs of intraluminal masses in DMH treated mice increased significantly (P < 0.01) and decreased non-significantly in the post-enema images (P > 0.01). SDNR: The Signal Intensity Difference–to-noise ratios.
- Citation: Wu T, Zheng WL, Zhang SZ, Sun JH, Yuan H. Bimodal visualization of colorectal uptake of nanoparticles in dimethylhydrazine-treated mice. World J Gastroenterol 2011; 17(31): 3614-3622
- URL: https://www.wjgnet.com/1007-9327/full/v17/i31/3614.htm
- DOI: https://dx.doi.org/10.3748/wjg.v17.i31.3614


