©2011 Baishideng Publishing Group Co.
World J Gastroenterol. Jul 7, 2011; 17(25): 3012-3019
Published online Jul 7, 2011. doi: 10.3748/wjg.v17.i25.3012
Published online Jul 7, 2011. doi: 10.3748/wjg.v17.i25.3012
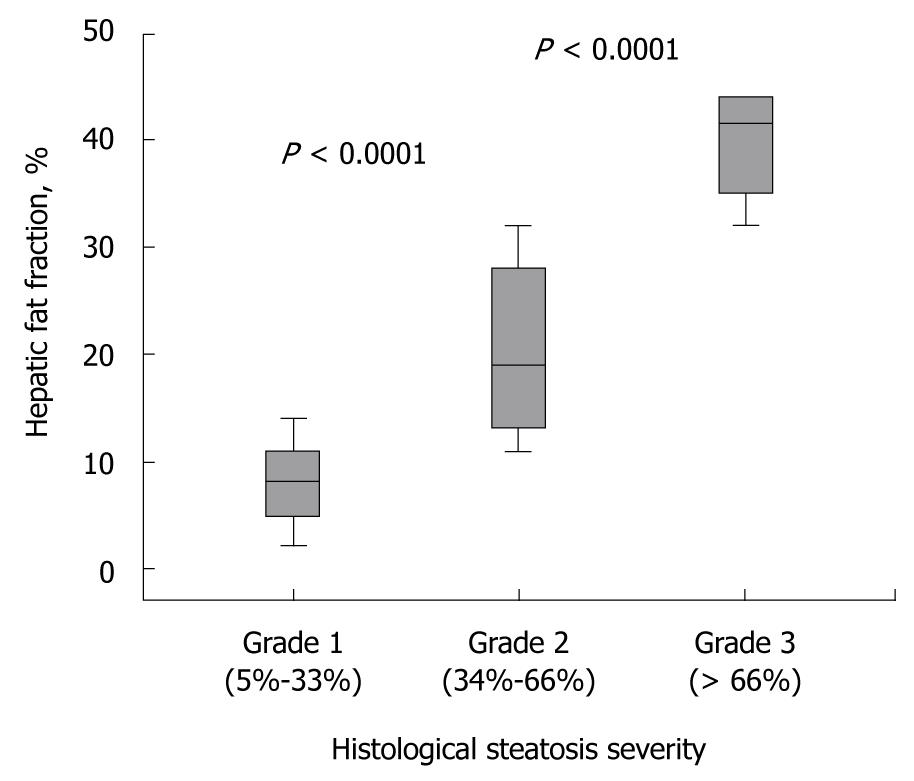
Figure 1 Magnetic resonance imaging hepatic fat fraction according to the histopathological results (grade of steatosis).
Boxplots give the median value (black), 25th and 75th percentiles (lower and upper limits of the box), and lower and upper adjacent values (whiskers).
- Citation: Pacifico L, Martino MD, Catalano C, Panebianco V, Bezzi M, Anania C, Chiesa C. T1-weighted dual-echo MRI for fat quantification in pediatric nonalcoholic fatty liver disease. World J Gastroenterol 2011; 17(25): 3012-3019
- URL: https://www.wjgnet.com/1007-9327/full/v17/i25/3012.htm
- DOI: https://dx.doi.org/10.3748/wjg.v17.i25.3012


