Copyright
©2011 Baishideng Publishing Group Co.
World J Gastroenterol. Apr 21, 2011; 17(15): 1982-1988
Published online Apr 21, 2011. doi: 10.3748/wjg.v17.i15.1982
Published online Apr 21, 2011. doi: 10.3748/wjg.v17.i15.1982
Figure 1 A sketch of the probe capable of measuring axial force and manometry simultaneously (see text for detailed explanation).
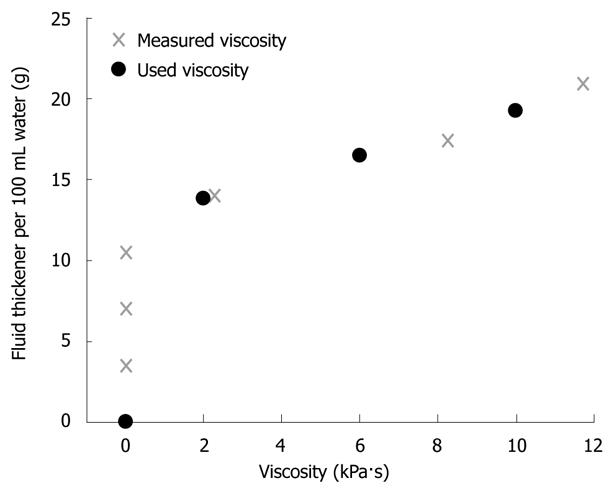
Figure 2 Viscosity recordings of the thickening powder in water.
The light grey marks were measured while the black marks are used in the study.
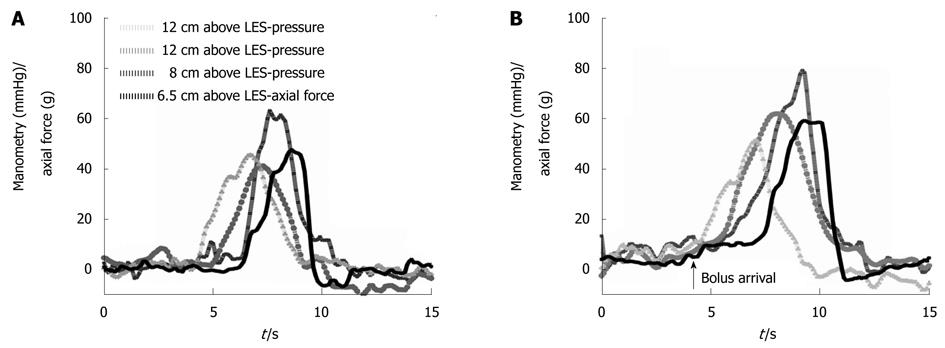
Figure 3 Two swallows (initiated at time = 0) from one subject.
One swallow of 5 mL water (A) and one swallow of 10 mL thickened fluid (B). The arrival of the fluid before the actual peristaltic wave was clear during swallowing of 10 mL thickened fluid. LES: Lower esophageal sphincter.
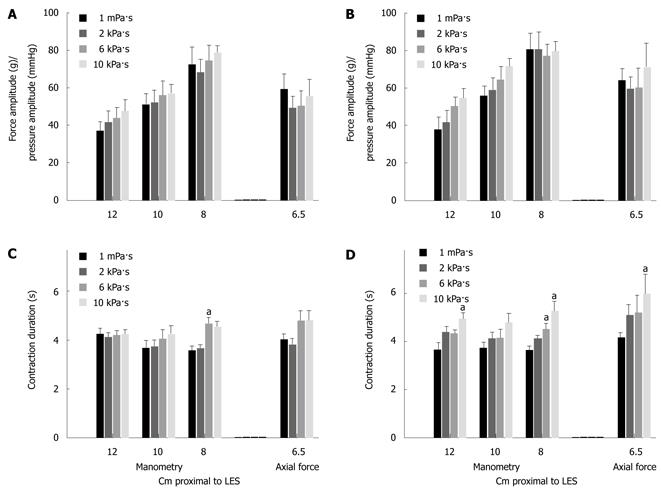
Figure 4 The mean ± SE amplitude (A, B) and duration (C, D) for manometry and axial force recordings during 5 mL swallows (A, C) and 10 mL swallows (B, D).
The color of the columns represents the viscosity from 1 to 10 kPa•s. The axial force amplitude was marginally affected by bolus size (F = 3.5, P = 0.069) while pressure recordings were unaffected. The duration of the contraction increased as the viscosity increased. aP < 0.05 vs water. LES: Lower esophageal sphincter.
Figure 5 The correlation between manometry amplitude recorded 8 cm proximal to LES and axial force recorded 6.
5 cm proximal to LES. The graphs from left to right are swallows of fluids with viscosities of 1 mPa•s, 2 kPa•s, 6 kPa•s and 10 kPa•s, respectively. LES : Lower esophageal sphincter.
- Citation: Gravesen F, Behan N, Drewes A, Gregersen H. Viscosity of food boluses affects the axial force in the esophagus. World J Gastroenterol 2011; 17(15): 1982-1988
- URL: https://www.wjgnet.com/1007-9327/full/v17/i15/1982.htm
- DOI: https://dx.doi.org/10.3748/wjg.v17.i15.1982


