Copyright
©2011 Baishideng Publishing Group Co.
World J Gastroenterol. Apr 14, 2011; 17(14): 1866-1873
Published online Apr 14, 2011. doi: 10.3748/wjg.v17.i14.1866
Published online Apr 14, 2011. doi: 10.3748/wjg.v17.i14.1866
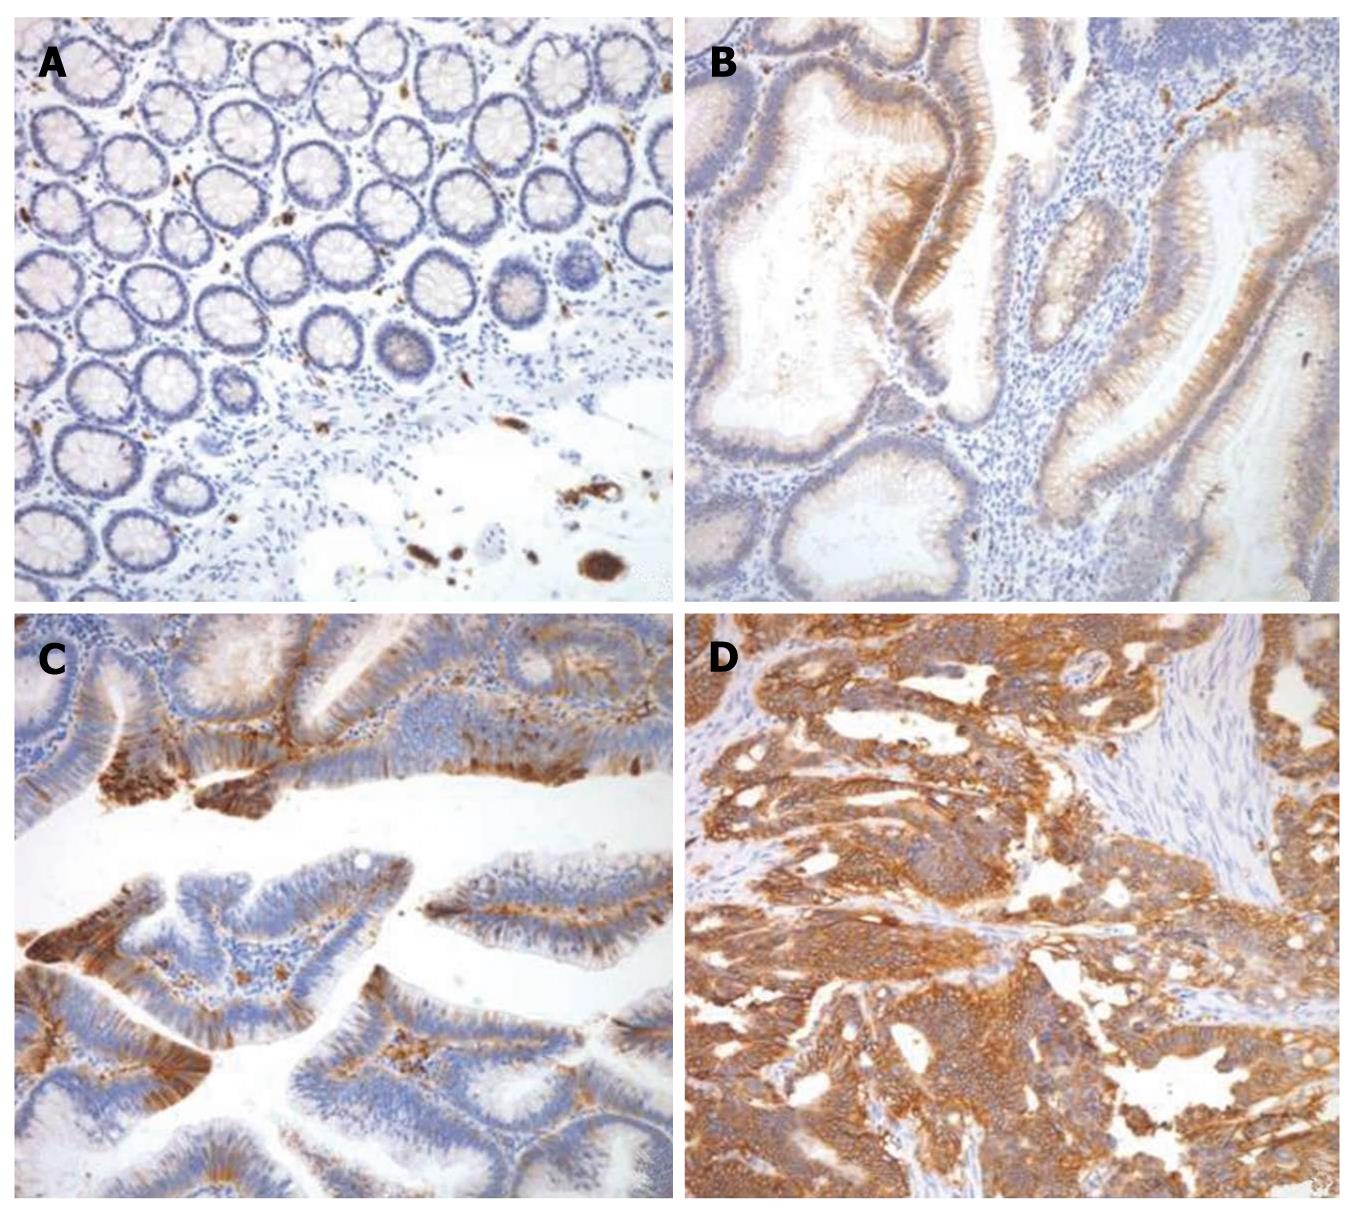
Figure 1 Representative photomicrograph of glucose transporter 1 immunostaining in normal mucosa (A), tubular adenoma with low grade dysplasia (B), tubular adenoma with high grade dysplasia (C), and adenocarcinoma (D).
The glucose transporter 1 was stained in the cytoplasmic membrane of the cells.
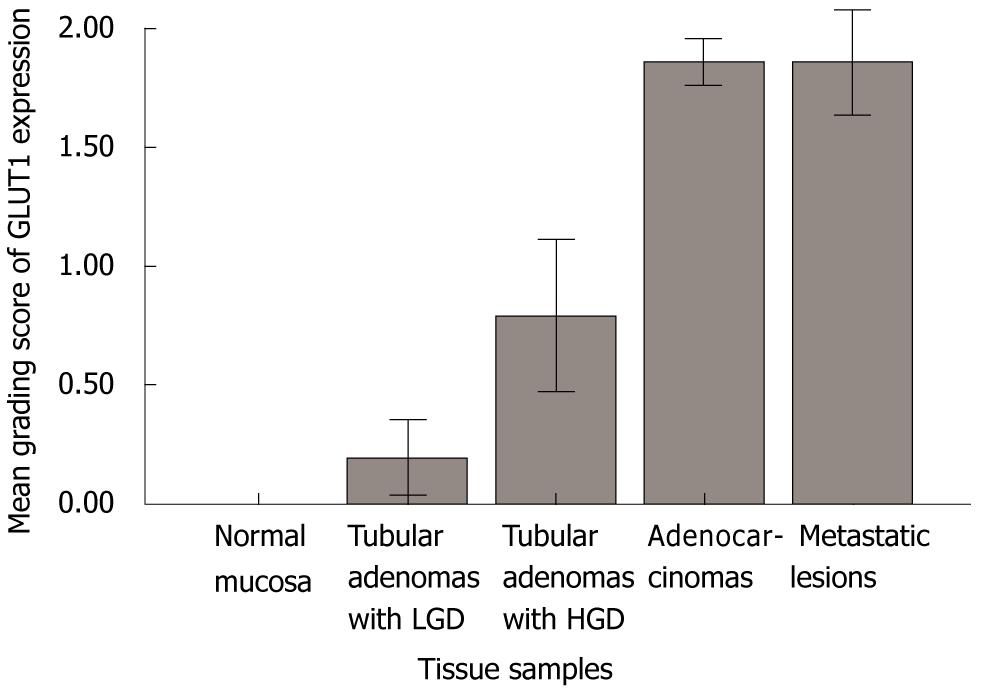
Figure 2 Representation showing the difference of mean grading score of glucose transporter 1 expression in normal mucosa, tubular adenomas with low grade dysplasia, tubular adenomas with high grade dysplasia, adenocarcinomas, and metastatic lesions (lymph nodes and distant organs).
One-way ANOVA test was used. GLUT1: Glucose transporter 1; LGD: Low grade dysplasia; HGD: High grade dysplasia.
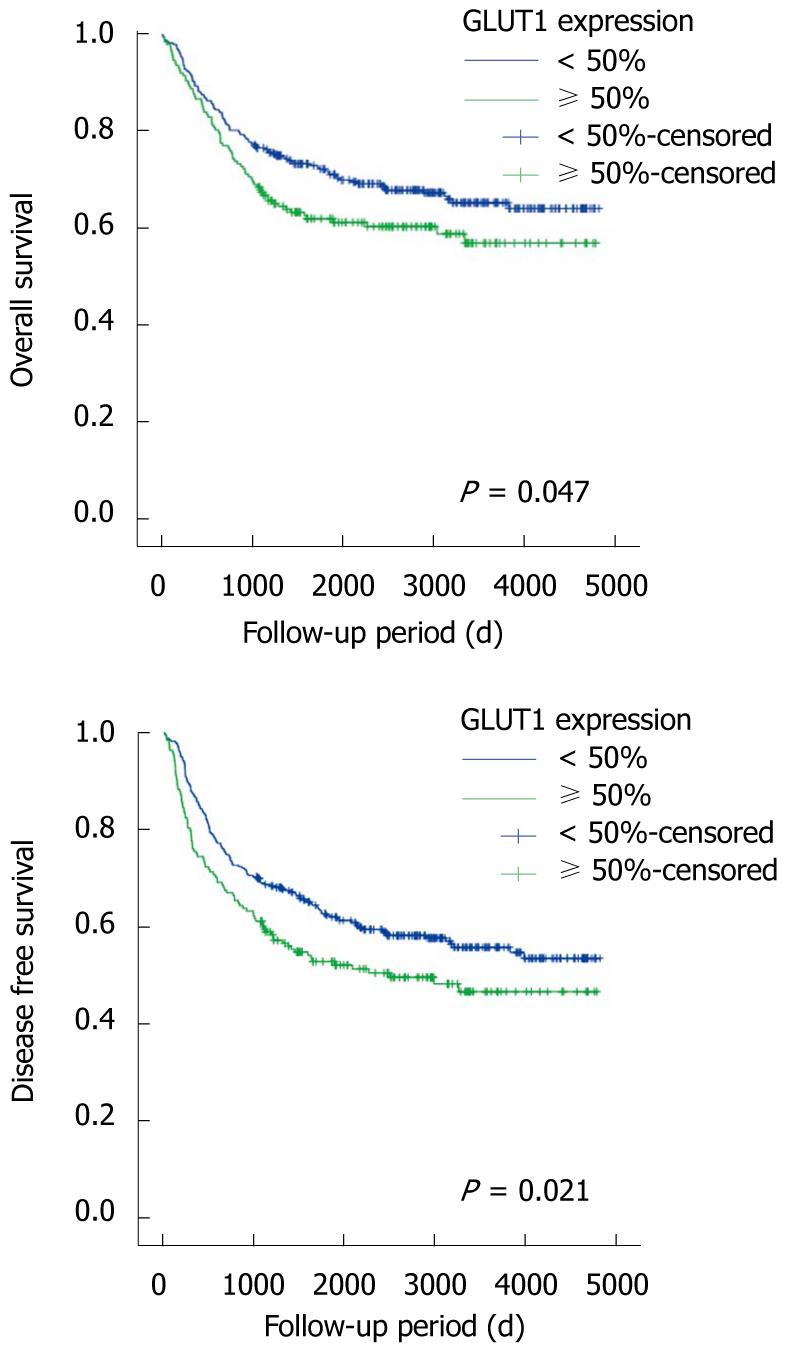
Figure 3 Cumulative overall survival curves (A) and disease-free survival curves (B) according to glucose transporter 1 expression in 515 colorectal cancer patients (Kaplan-Meier method with log-rank test).
GLUT1: Glucose transporter 1.
- Citation: Jun YJ, Jang SM, Han HL, Lee KH, Jang KS, Paik SS. Clinicopathologic significance of GLUT1 expression and its correlation with Apaf-1 in colorectal adenocarcinomas. World J Gastroenterol 2011; 17(14): 1866-1873
- URL: https://www.wjgnet.com/1007-9327/full/v17/i14/1866.htm
- DOI: https://dx.doi.org/10.3748/wjg.v17.i14.1866


