Copyright
©2011 Baishideng Publishing Group Co.
World J Gastroenterol. Jan 7, 2011; 17(1): 28-41
Published online Jan 7, 2011. doi: 10.3748/wjg.v17.i1.28
Published online Jan 7, 2011. doi: 10.3748/wjg.v17.i1.28
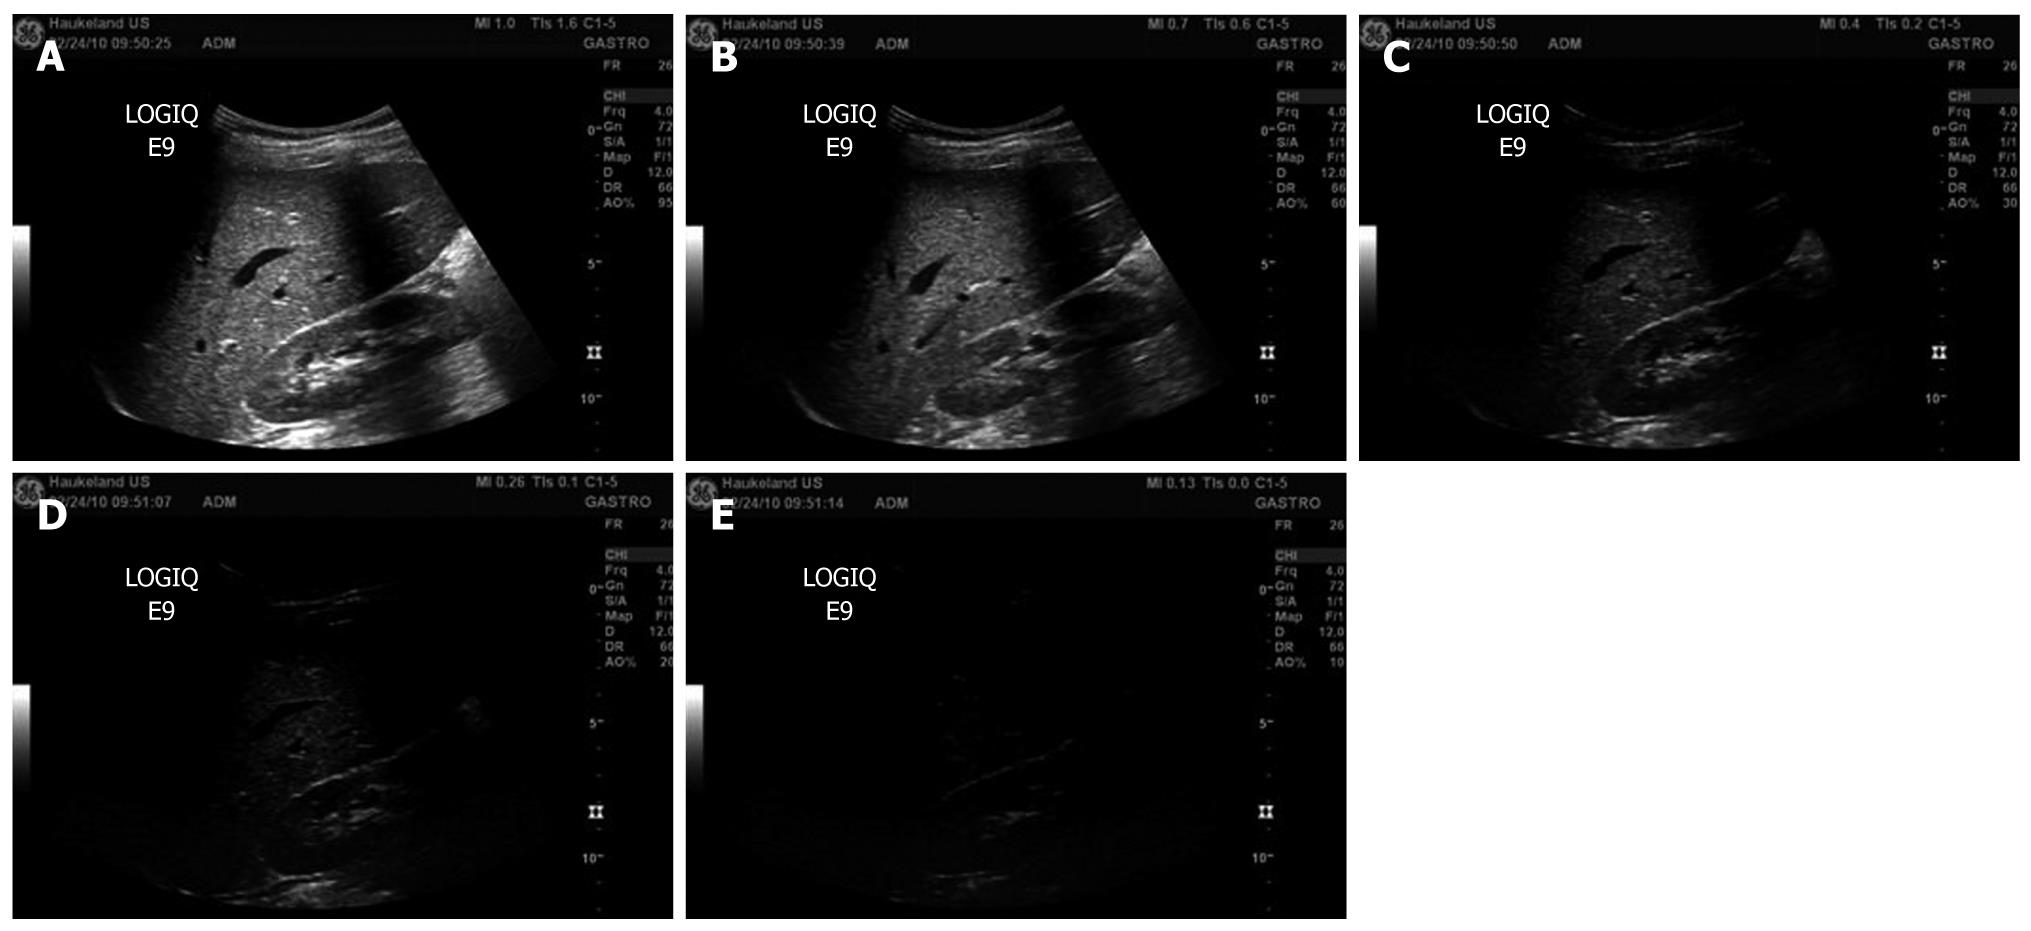
Figure 1 B-mode images of the liver recorded at decreasing mechanical index values (A-E).
A: Mechanical index (MI) = 1.0; B: MI = 0.7; C: MI = 0.4; D: MI = 0.26; E: MI = 0.13.
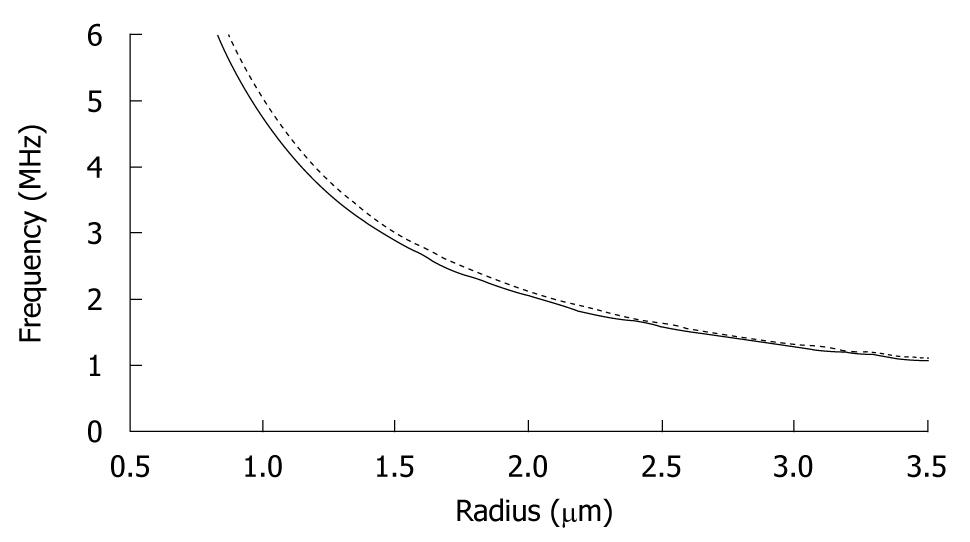
Figure 2 Resonance frequencies of free (unencapsulated) (solid line) and lipid-encapsulated (dotted line) microbubbles as a function of equilibrium radius.
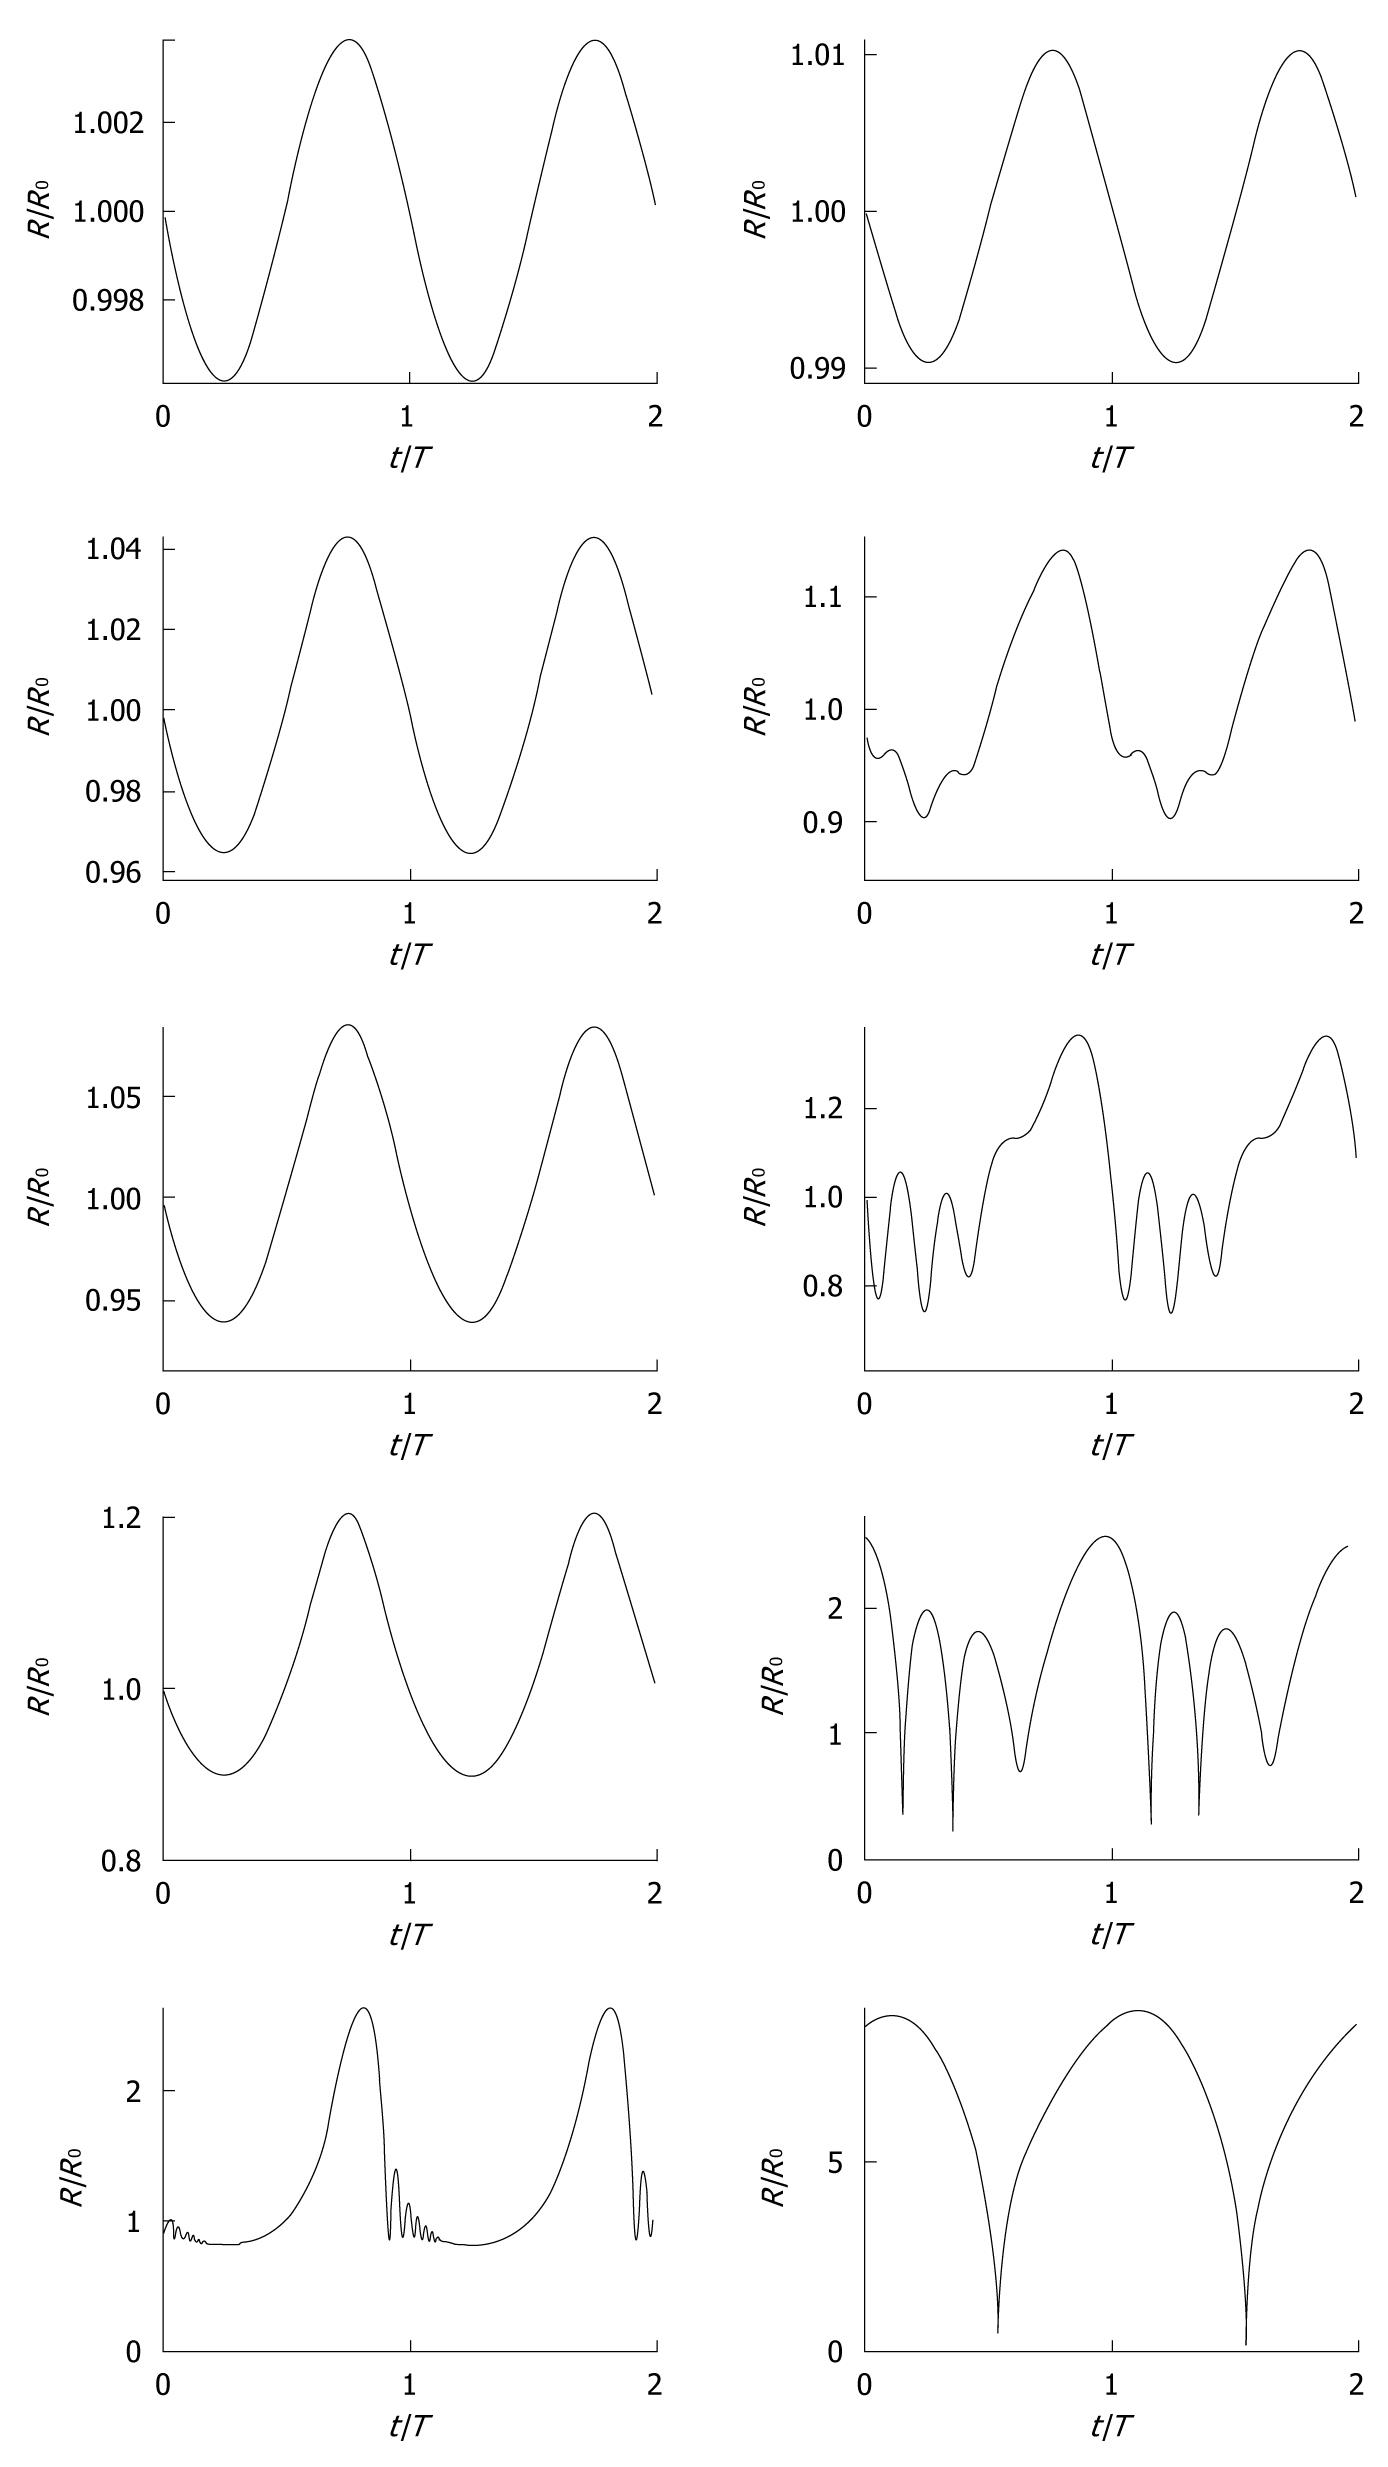
Figure 3 Simulated radius-time curves (radius R normalized with equilibrium radius R0, time t normalized with period T0) of ultrasound contrast microbubbles with 0.
55 μm (left column) and 2.3 μm (right column) equilibrium radii, respectively, modeled with a conservative Rayleigh-Plesset equation[3], using a conservative shell stiffness parameter[148]. The modeled ultrasound field was a continuous sine wave with a frequency of 0.5 MHz and acoustic amplitudes corresponding to (top-bottom) mechanical index = 0.01, 0.10, 0.18, 0.35, and 0.80, similar to the experiments by Karshafian et al[92].
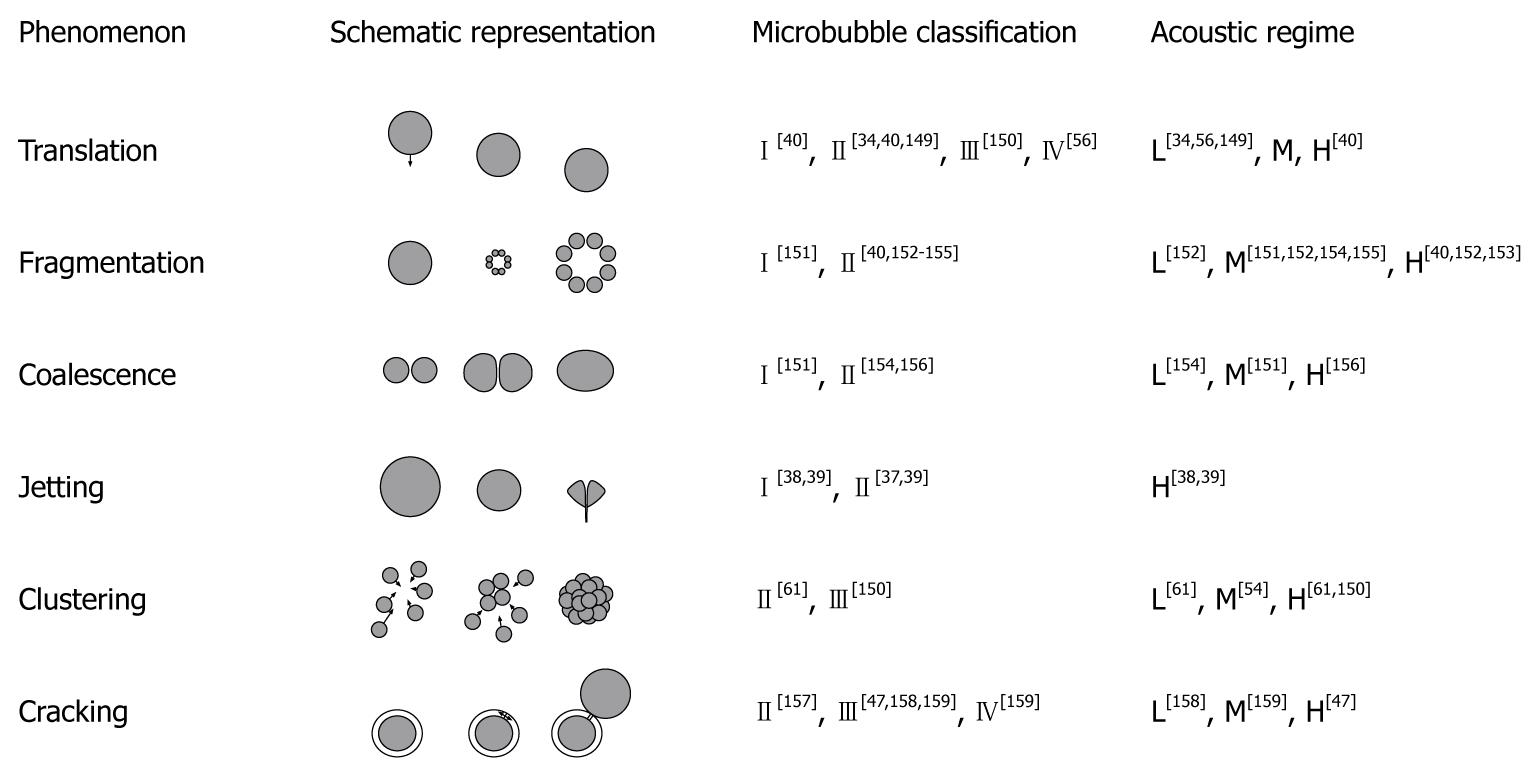
Figure 4 Nonlinear phenomena and the regimes for their occurrence.
Microbubble shell classes: (I) free or released gas; (II) thin shells < 10 nm; (III) thick shells < 500 nm; (IV) very thick shells > 500 nm. Acoustic regimes: low (L) for mechanical index (MI) < 0.3; medium (M) for 0.3 < MI < 0.7; high (H) for MI > 0.7. The figure has been based on Postema[12].
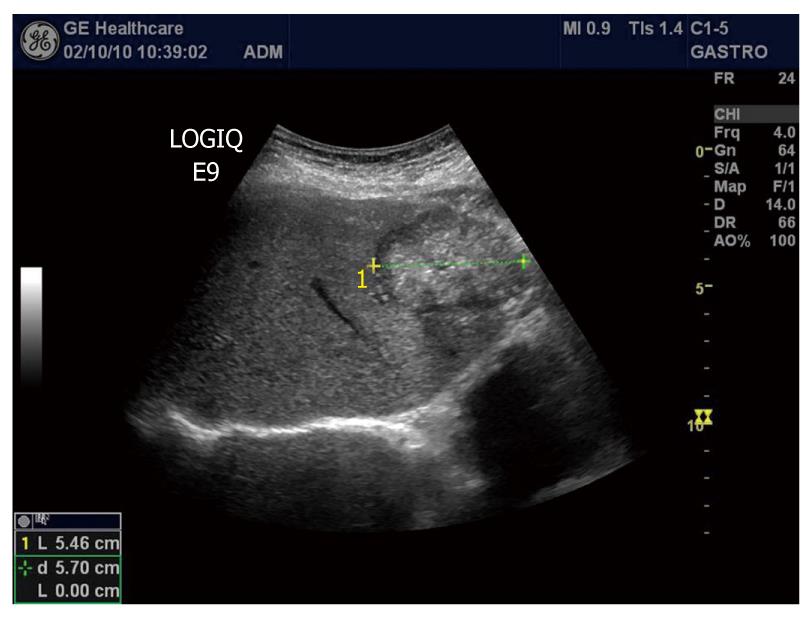
Figure 5 B-mode image of a metastasis from a colon cancer to the liver appearing hyperechoic with a dark halo.
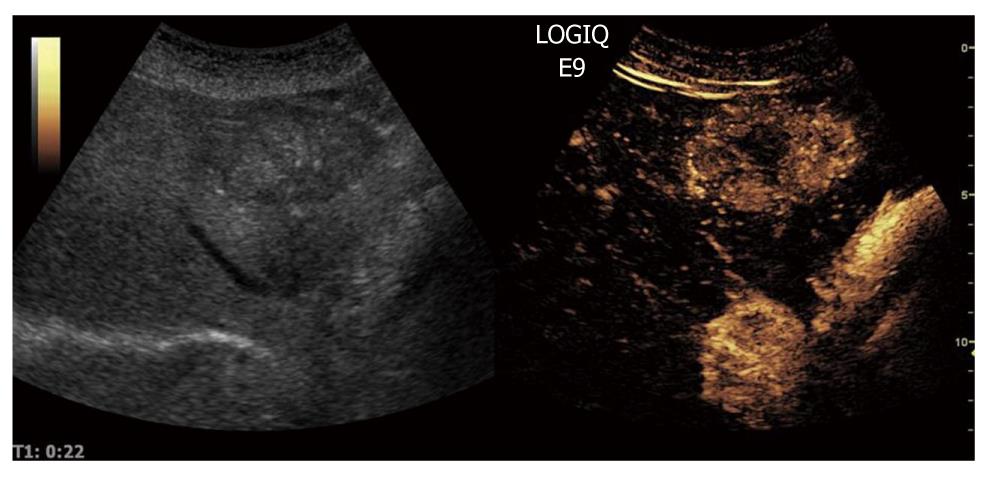
Figure 6 Contrast-enhanced ultrasound B-mode image of a colon cancer metastasis (same as in Figure 5) in the arterial phase showing marked hyperenhancement in the right panel.
Note also the dark centre of the tumor, indicating a necrotic portion of the metastasis.
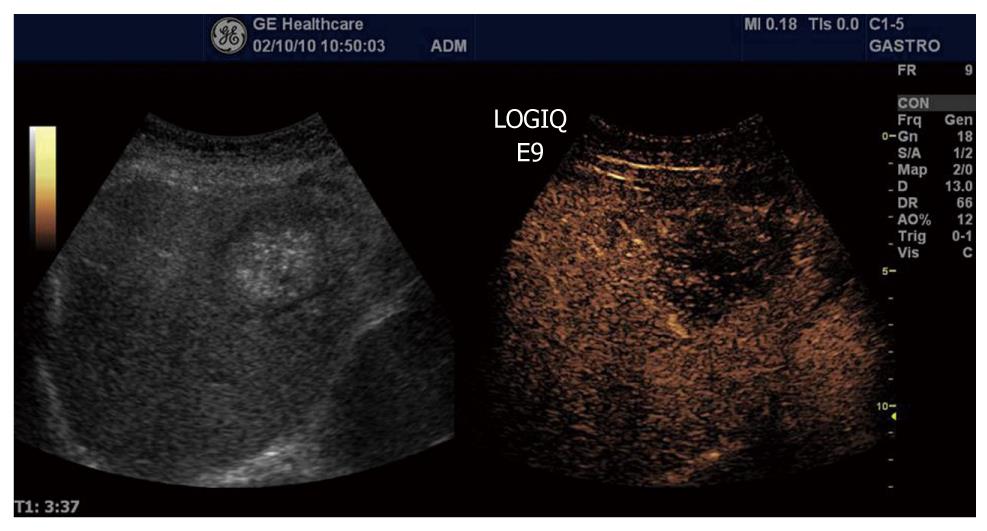
Figure 7 Contrast-enhanced ultrasound B-mode image of a colon cancer metastasis (same as in Figure 5) in the sinusoidal (late) phase, showing marked hypoenhancement in the right panel.
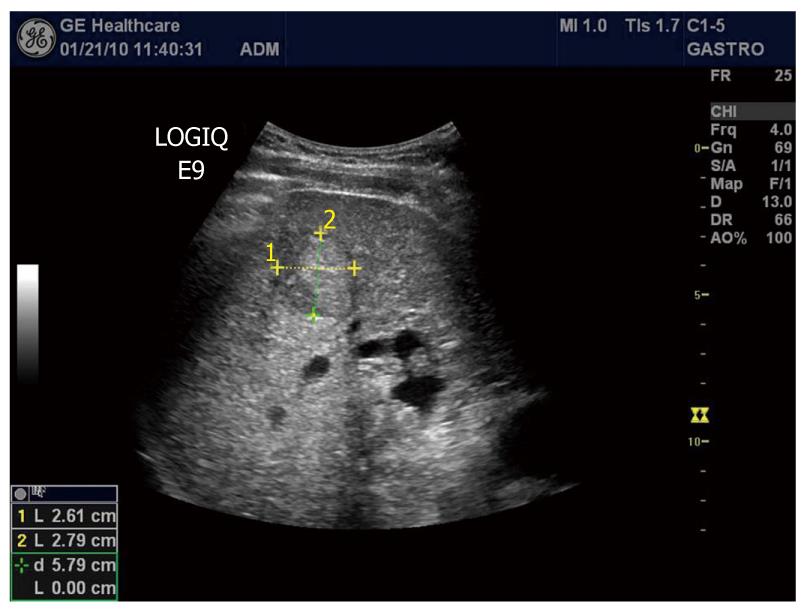
Figure 8 B-mode image of hepatocellular carcinoma with well-demarcated margins and a perilesional halo.
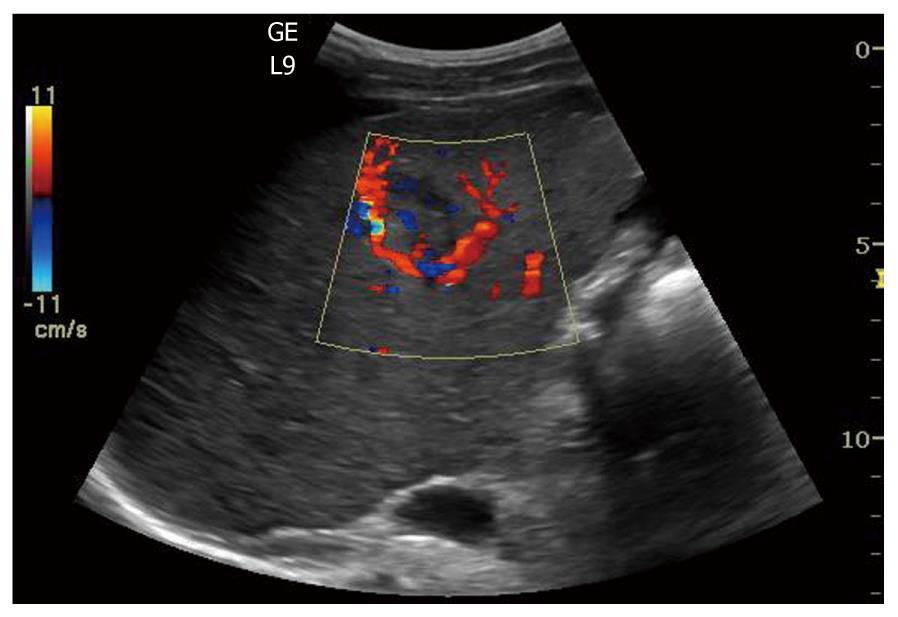
Figure 9 Color Doppler in hepatocellular carcinoma reveals a basket pattern around the tumor, illustrating the anatomy of the arterial tumor supply.
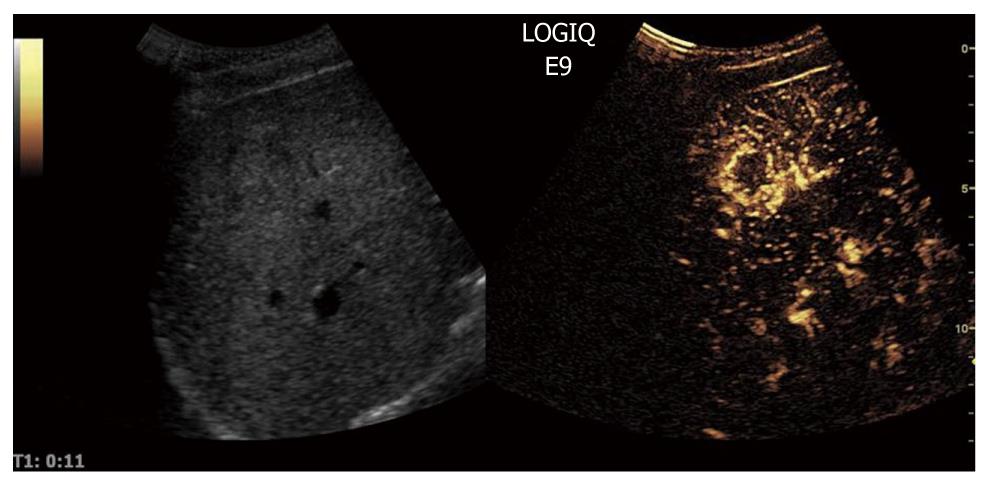
Figure 10 Contrast-enhanced ultrasound allows for visualization of the arteriogram of hepatocellular carcinoma in the early arterial phase.
The feeding vessel is visible on the tumor right side. Typically there is initial peripheral enhancement before the centripetal influx to the center of the tumor.
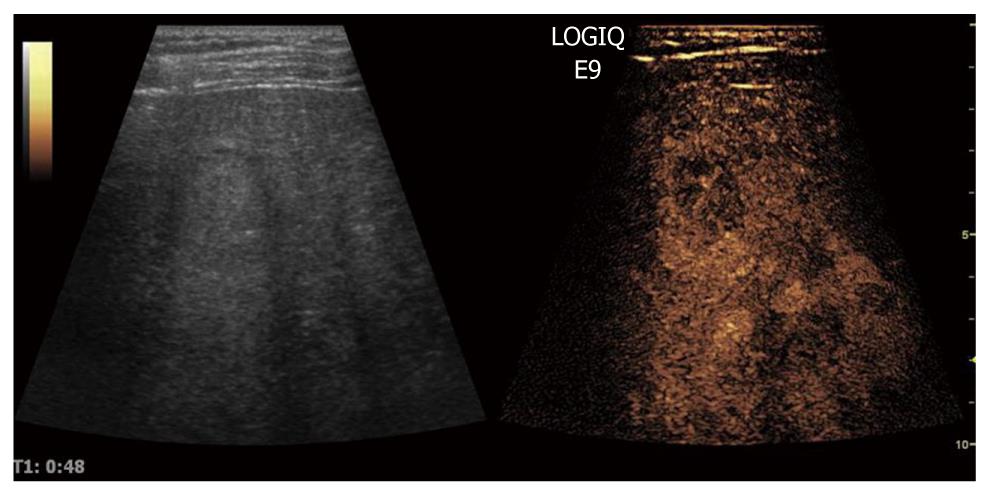
Figure 11 The portal phase of hepatocellular carcinoma.
Because of high circulation velocity within hepatocellular carcinoma, there is relatively rapid washout, often starting in the portal phase.
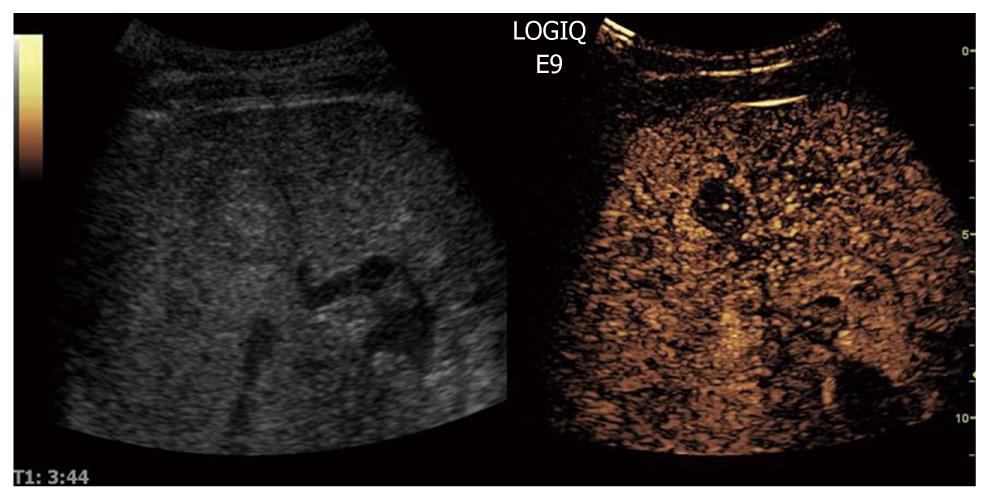
Figure 12 The sinusoidal (late) phase of hepatocellular carcinoma is shown.
Typically, hepatocellular carcinoma is hypovascular (hypoechoic) during the late phase of perfusion confirming the malignant nature of the tumor.
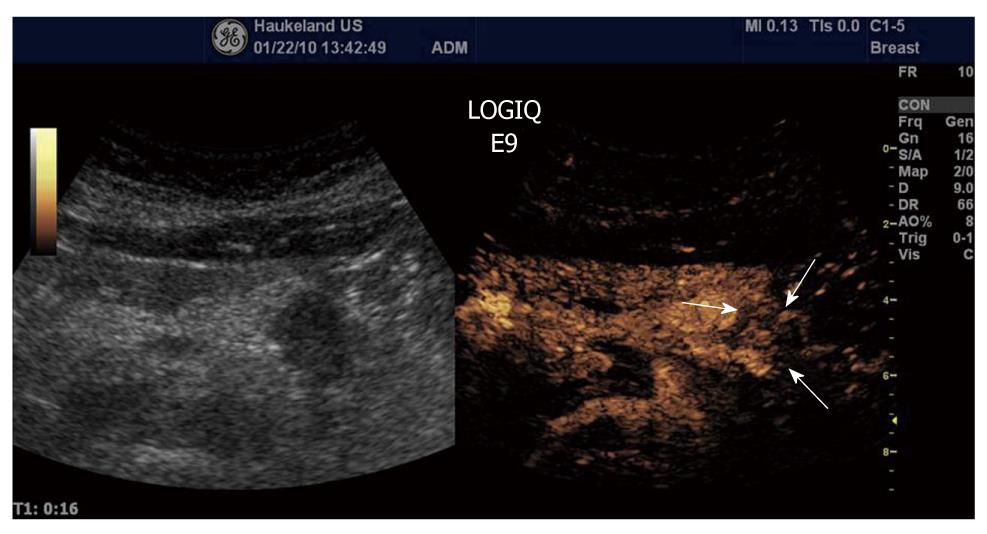
Figure 13 Ductal adenocarcinoma (between arrows) of the pancreas showing poor enhancement in the arterial phase.
The same is true for the late venous phase.
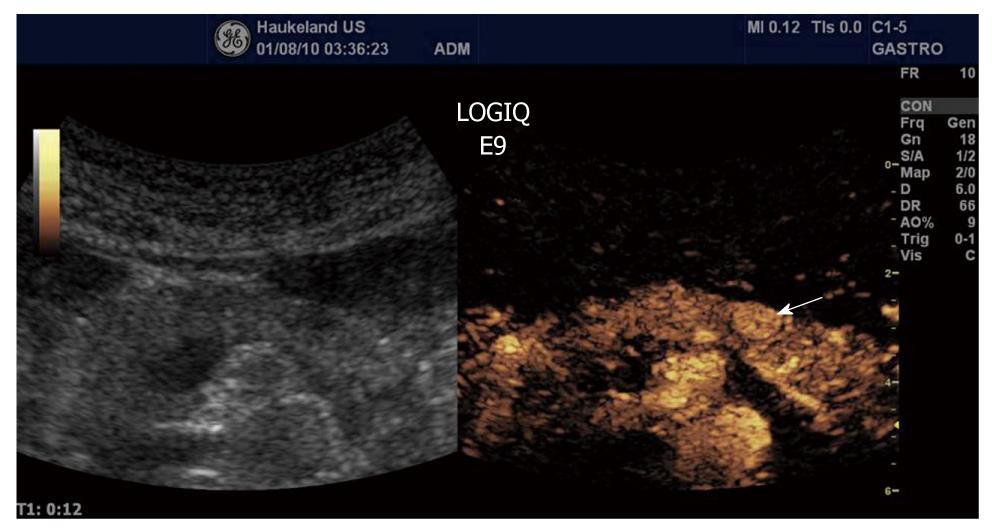
Figure 14 Neuroendocrine tumour (arrow) shows a rapid intense enhancement in the early arterial phase of contrast-enhanced ultrasound examination.
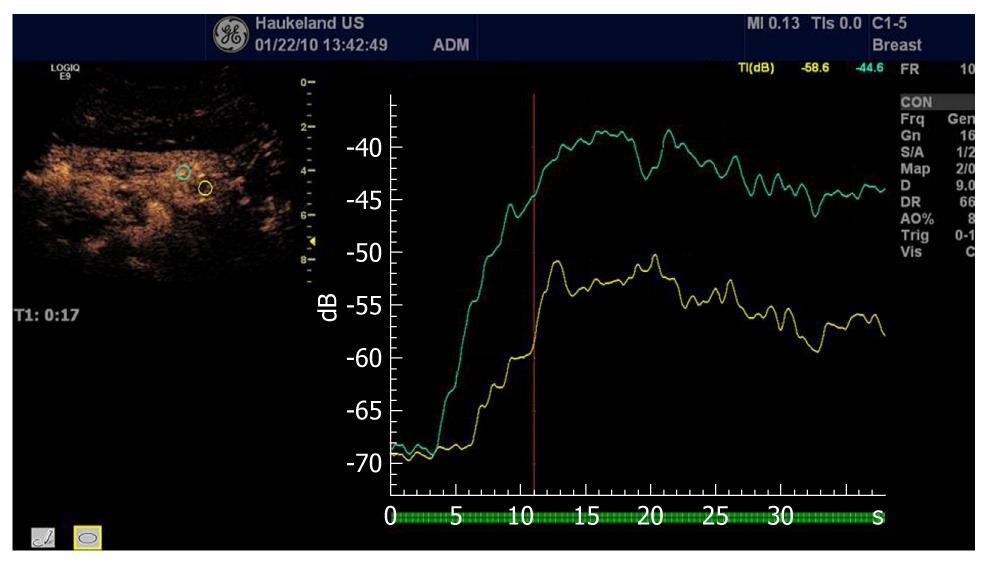
Figure 15 Analysis of time intensity curves after injection of contrast agents depicting a pancreatic carcinoma (same as Figure 13).
The green curve depicts the normal pancreatic perfusion whereas the red curve illustrates the hypoenhancing malignancy.
- Citation: Postema M, Gilja OH. Contrast-enhanced and targeted ultrasound. World J Gastroenterol 2011; 17(1): 28-41
- URL: https://www.wjgnet.com/1007-9327/full/v17/i1/28.htm
- DOI: https://dx.doi.org/10.3748/wjg.v17.i1.28


