Copyright
©2010 Baishideng.
World J Gastroenterol. Mar 7, 2010; 16(9): 1129-1137
Published online Mar 7, 2010. doi: 10.3748/wjg.v16.i9.1129
Published online Mar 7, 2010. doi: 10.3748/wjg.v16.i9.1129
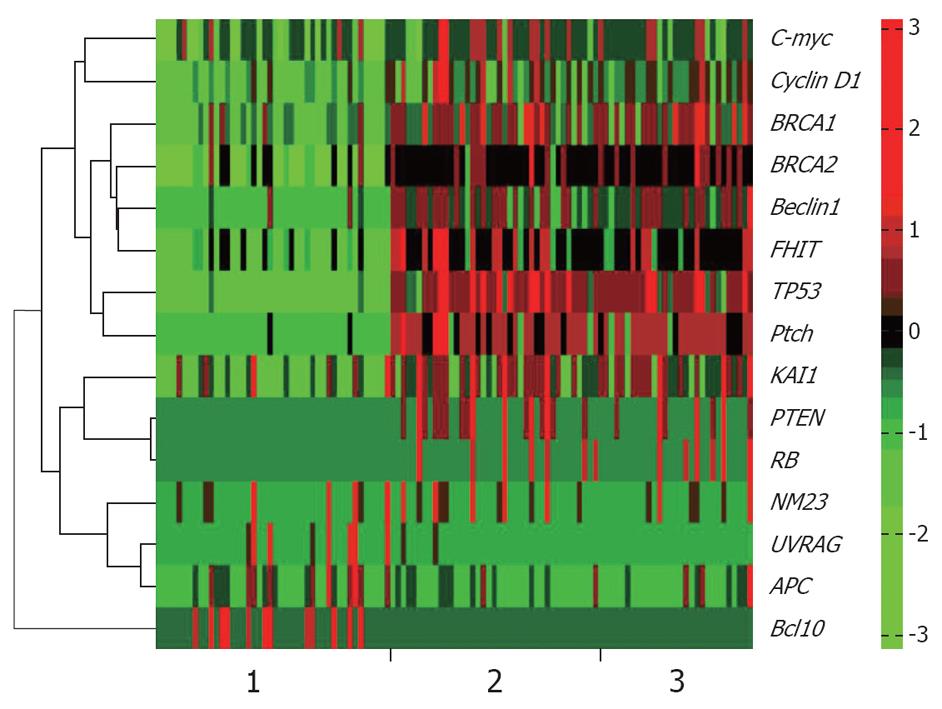
Figure 1 Gene expression levels of three different tissues.
1: Normal tissues; 2: Well differentiated gastric adenocarcinoma (GA); 3: Poorly differentiated GA. X-axis represents samples, and each unit represents a gene expression level of the corresponding sample. Y-axis represents genes, whose name marked at the right side of the figure. Green color indicates the low-expression level of corresponding gene, and red represents over-expression.
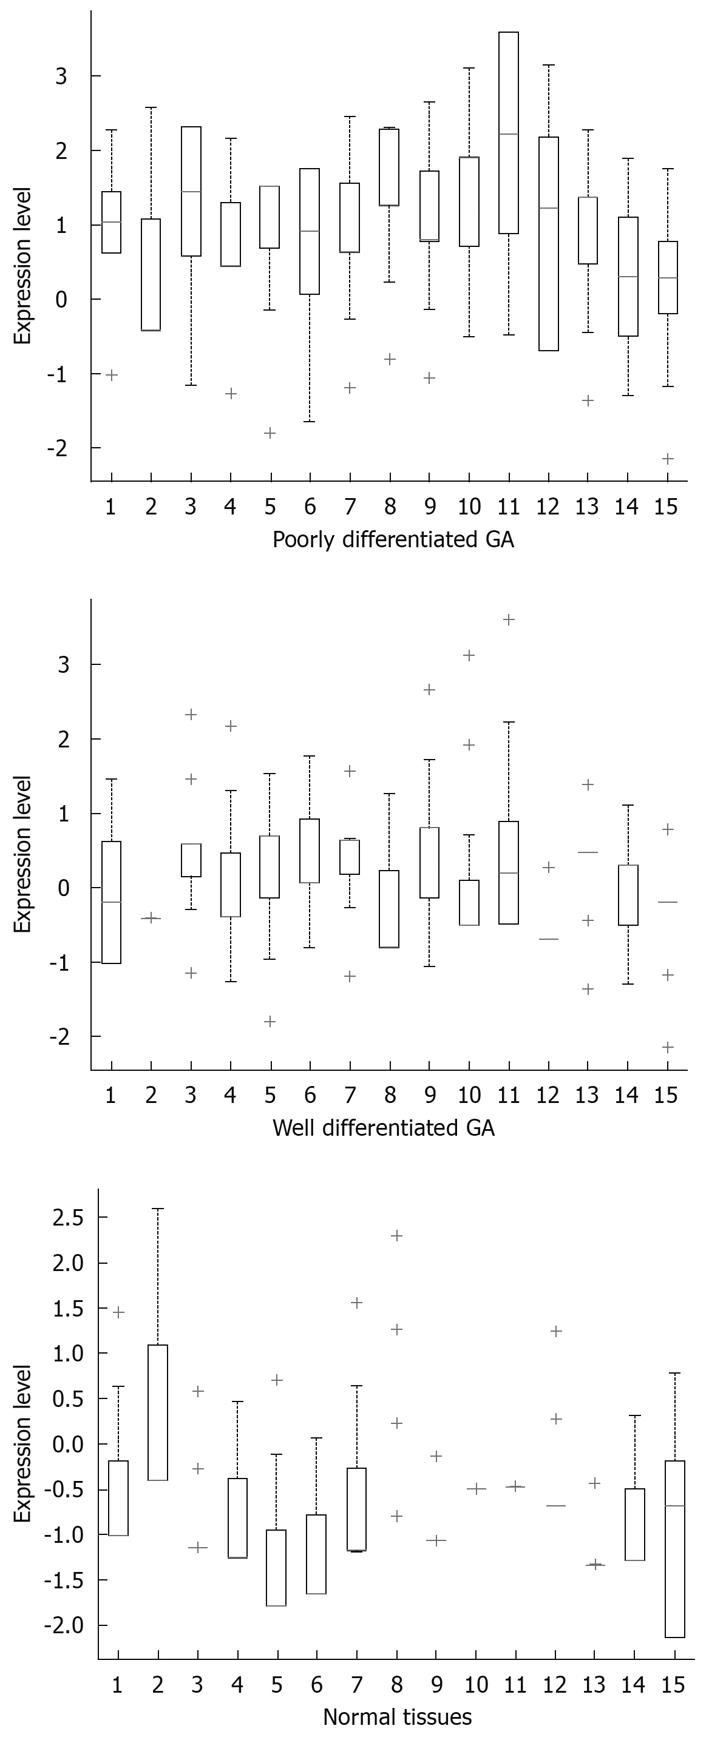
Figure 2 Distribution of gene expression levels.
1: APC; 2: Bcl10; 3: Beclin1; 4: BRCA1; 5: BRCA2; 6: FHIT; 7: KAI1; 8: NM23; 9: Ptch; 10: PTEN; 11: RB; 12: UVRAG; 13: TP53; 14: Cyclin D1; 15: C-myc.
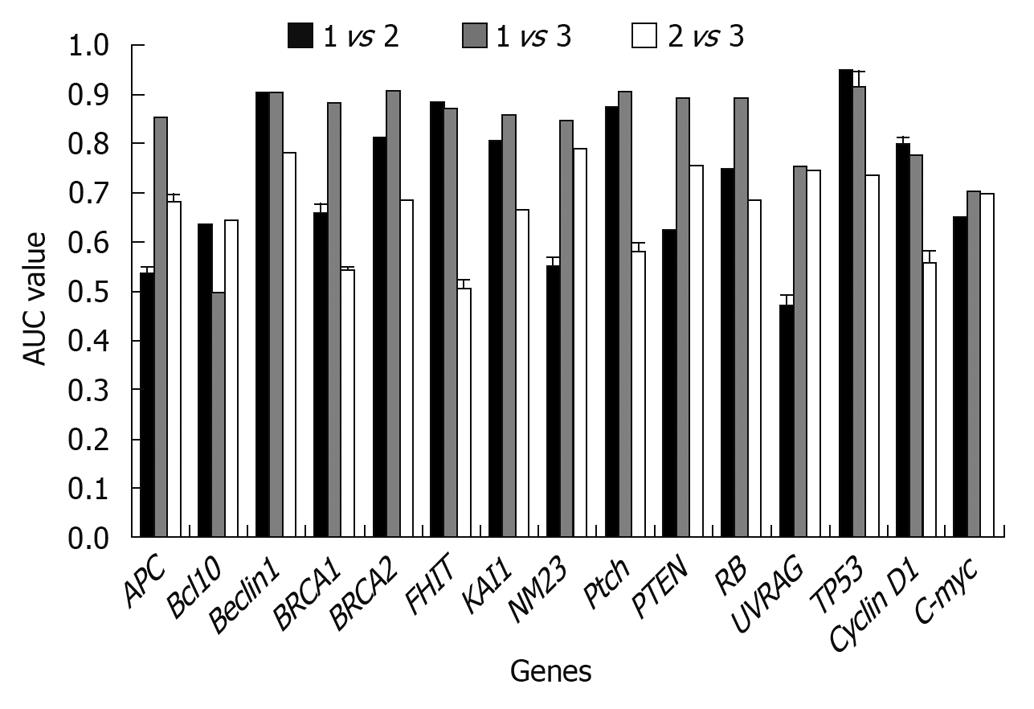
Figure 3 Classification of two sample groups with a single gene.
1: Normal tissues; 2: Well differentiated GA; 3: Poorly differentiated GA. AUC: Area Under Curve.
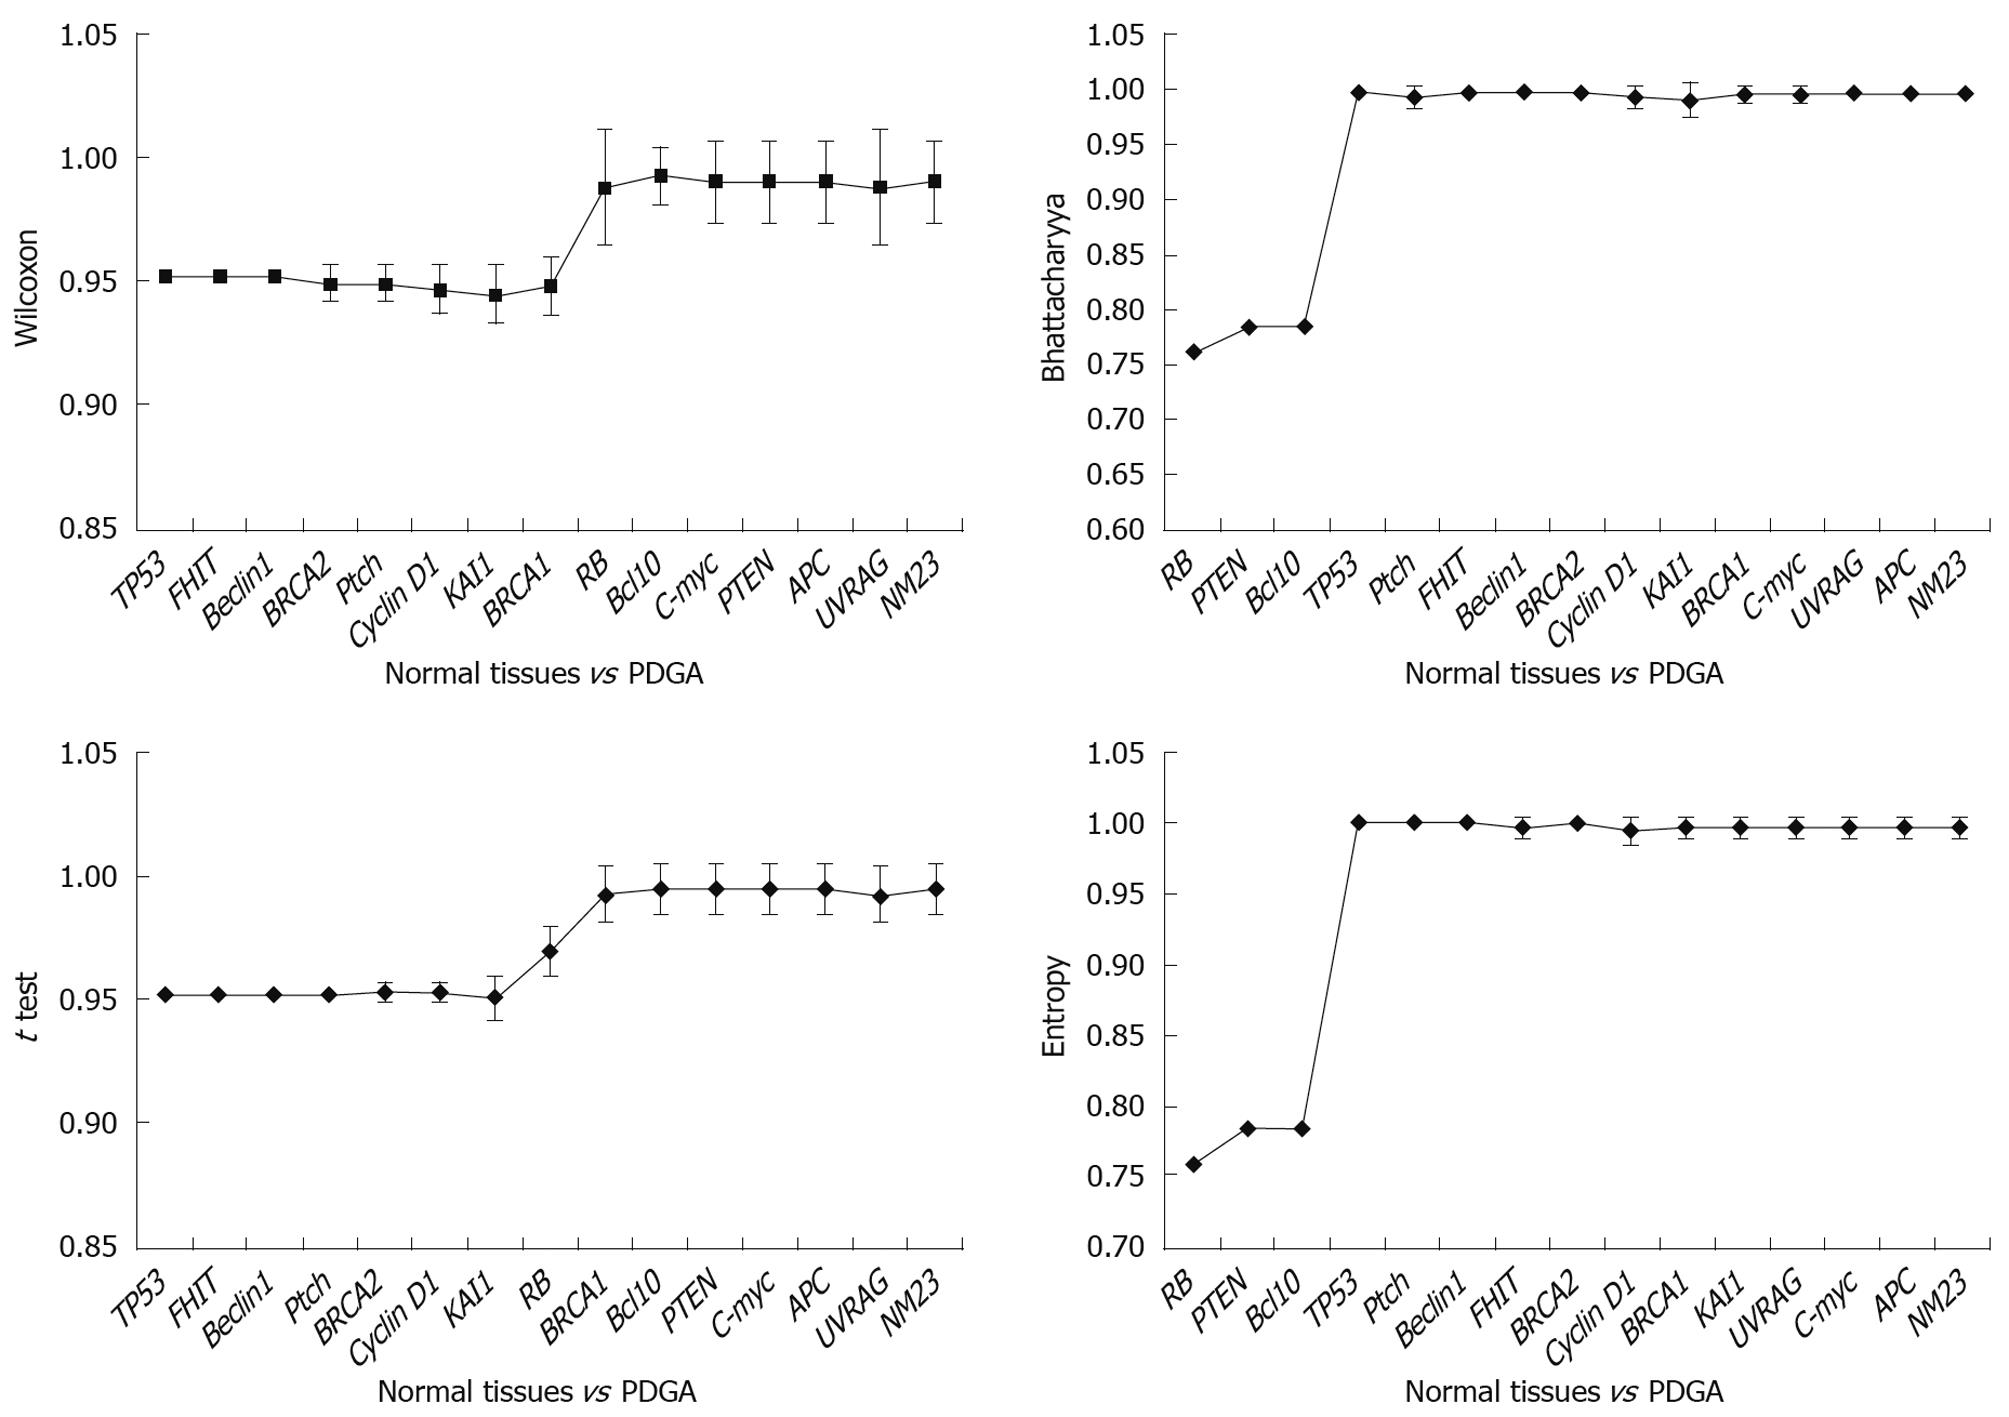
Figure 4 Comparison of normal tissues and poorly differentiated GA (PDGA).
X-axis represents the sequence of selected genes, and Y-axis represents the average and standard deviation of the AUC scores obtained in the ten 10-fold cross-validation (CV) with the corresponding gene groups.
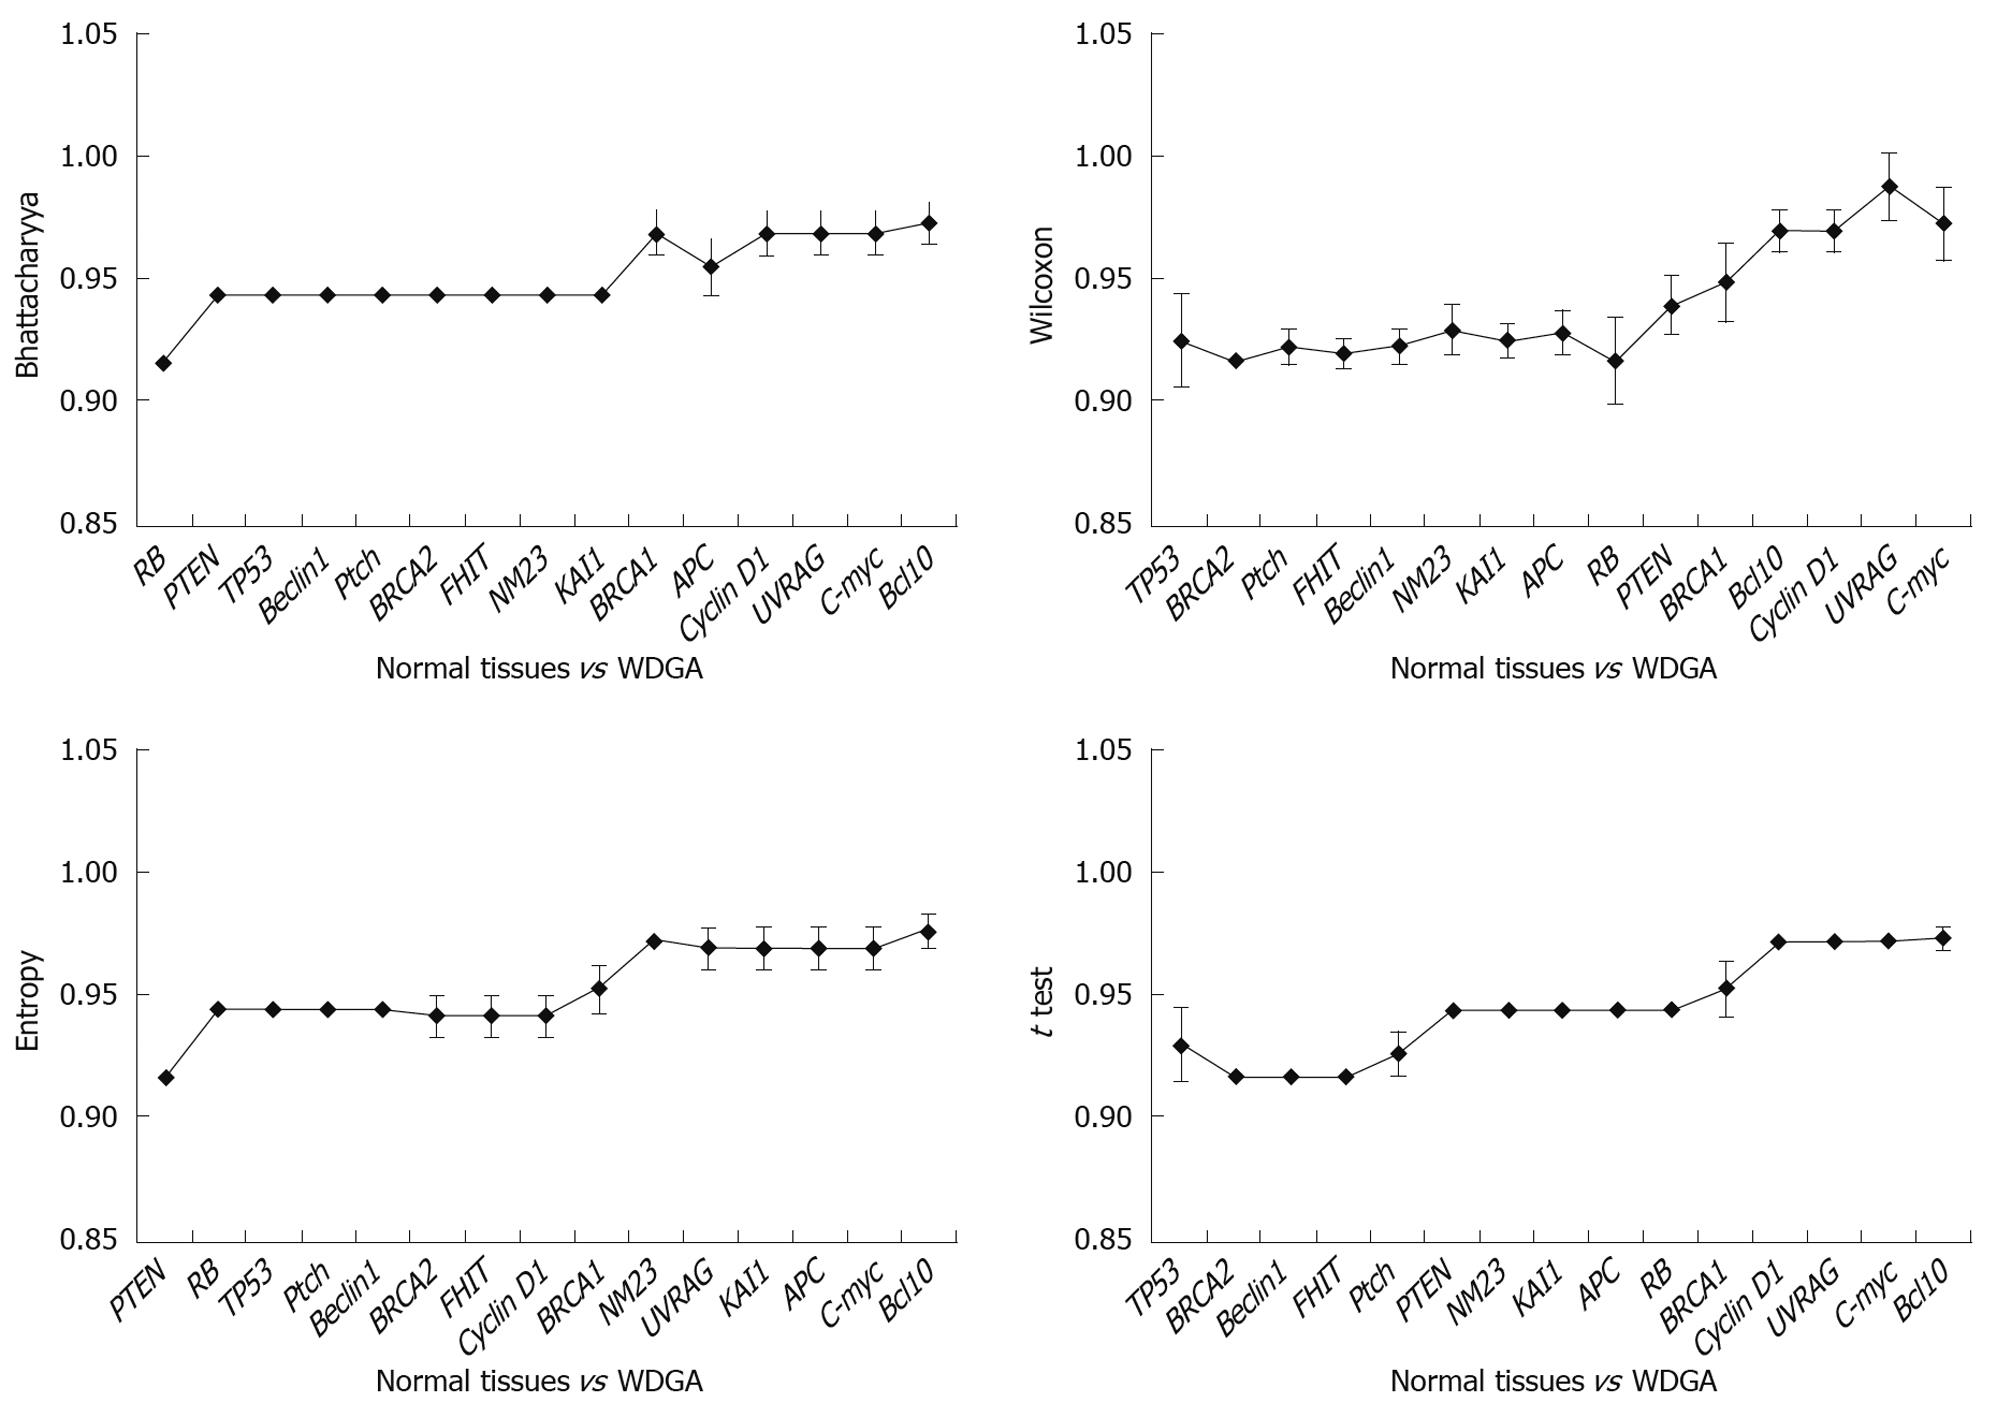
Figure 5 Comparison of normal tissues and well differentiated GA (WDGA).
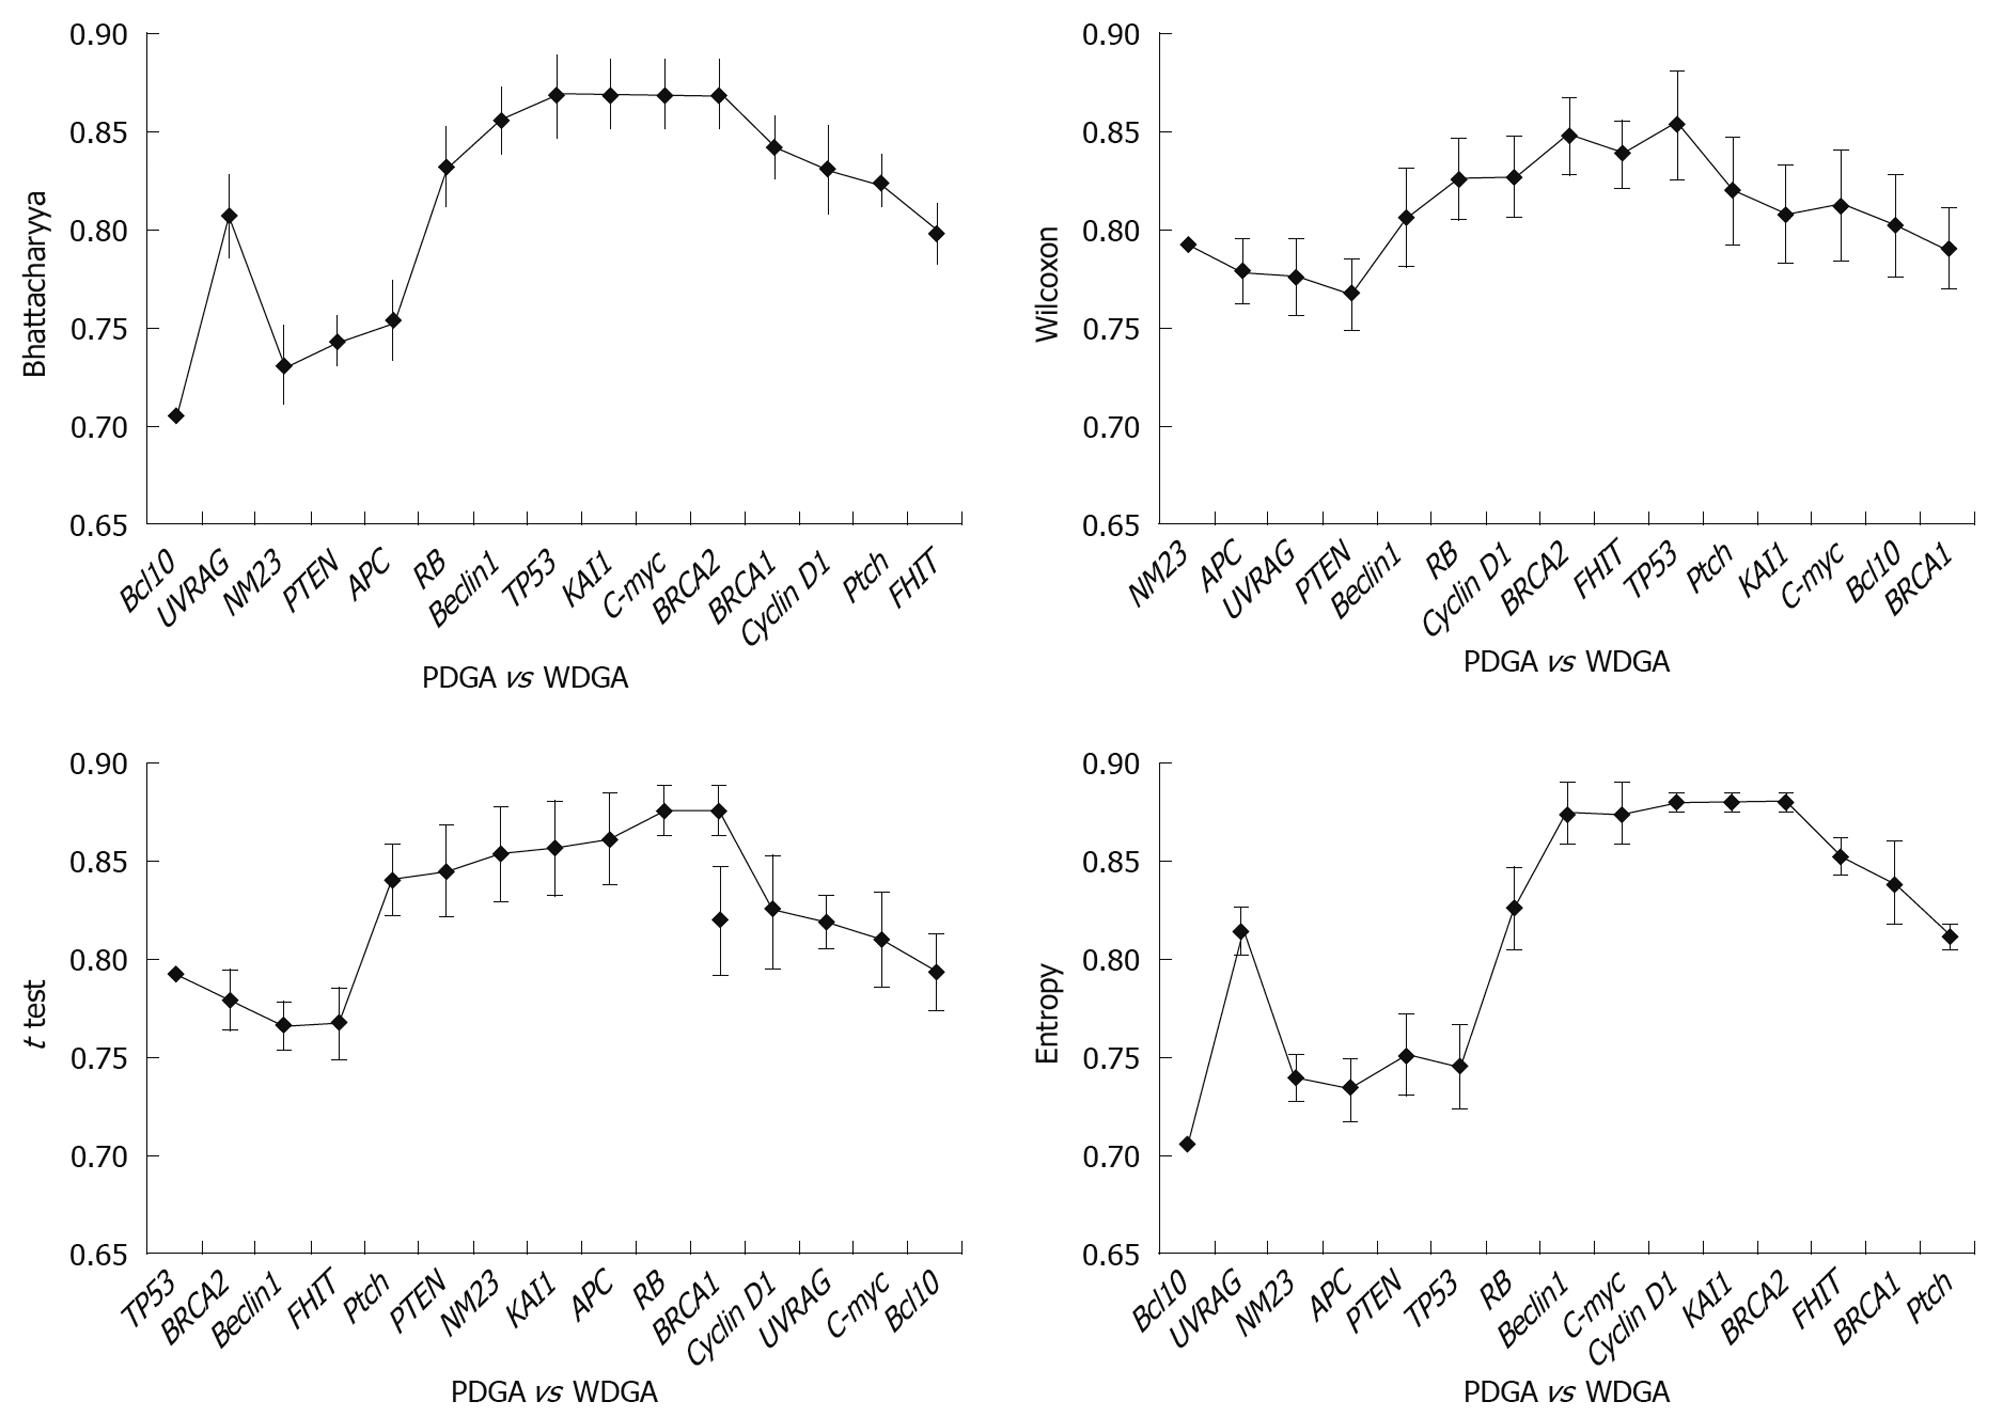
Figure 6 Comparison of WDGA and PDGA.
- Citation: Liu GY, Liu KH, Zhang Y, Wang YZ, Wu XH, Lu YZ, Pan C, Yin P, Liao HF, Su JQ, Ge Q, Luo Q, Xiong B. Alterations of tumor-related genes do not exactly match the histopathological grade in gastric adenocarcinomas. World J Gastroenterol 2010; 16(9): 1129-1137
- URL: https://www.wjgnet.com/1007-9327/full/v16/i9/1129.htm
- DOI: https://dx.doi.org/10.3748/wjg.v16.i9.1129


