©2010 Baishideng.
World J Gastroenterol. Feb 21, 2010; 16(7): 886-896
Published online Feb 21, 2010. doi: 10.3748/wjg.v16.i7.886
Published online Feb 21, 2010. doi: 10.3748/wjg.v16.i7.886
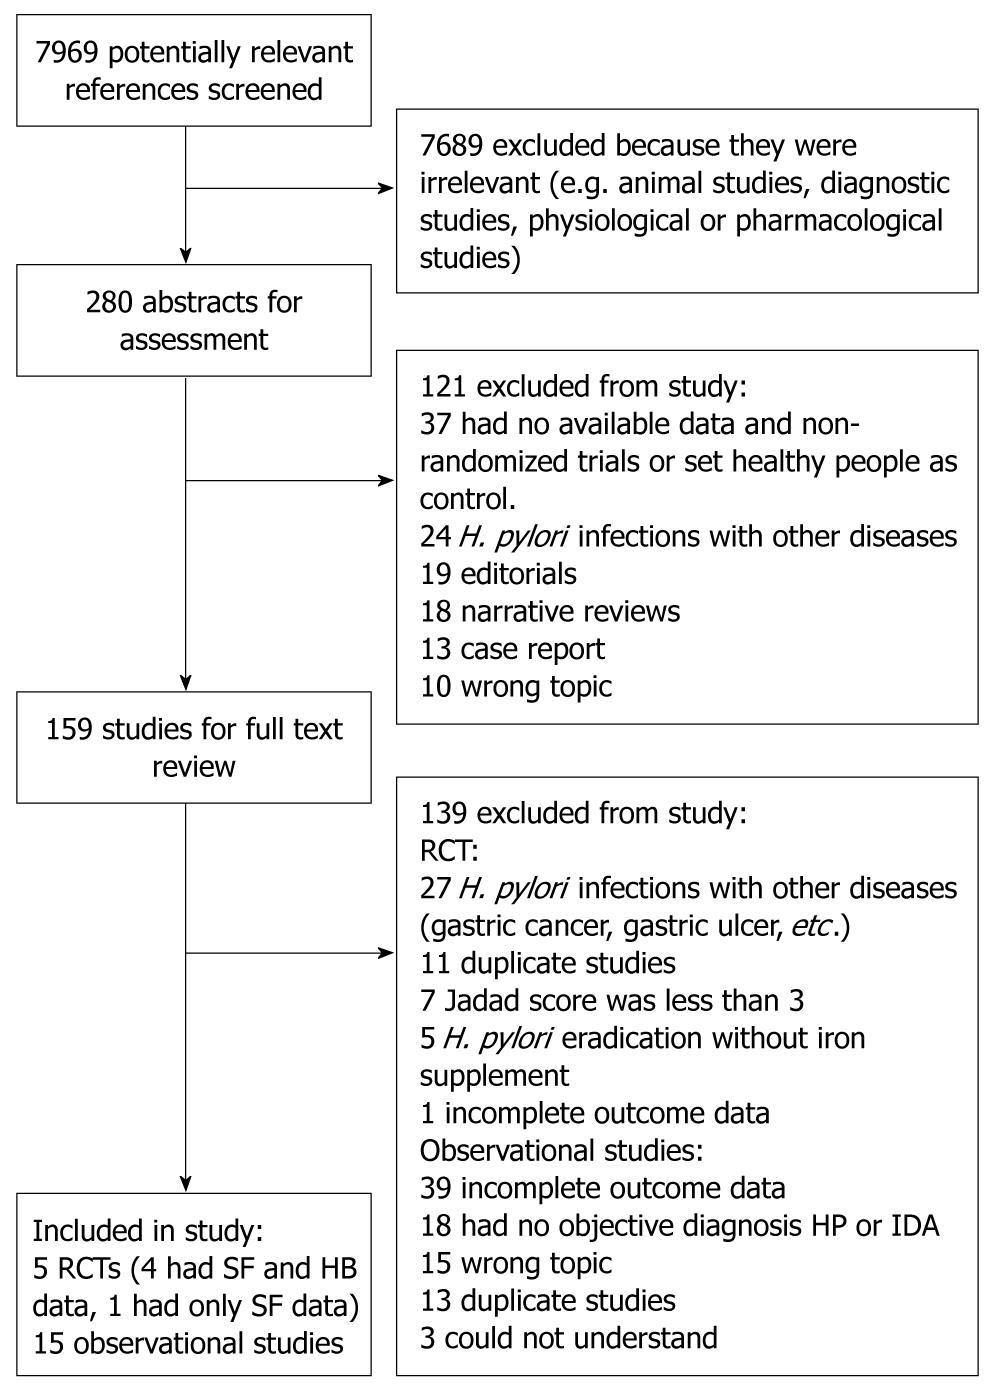
Figure 1 Flow chart showing the trial flow for selection of RCTs and observational studies to be included.
RCT: Randomized controlled trial; HP: H. pylori; IDA: Iron deficiency anemia; HB: Hemoglobin; SF: Serum ferritin.
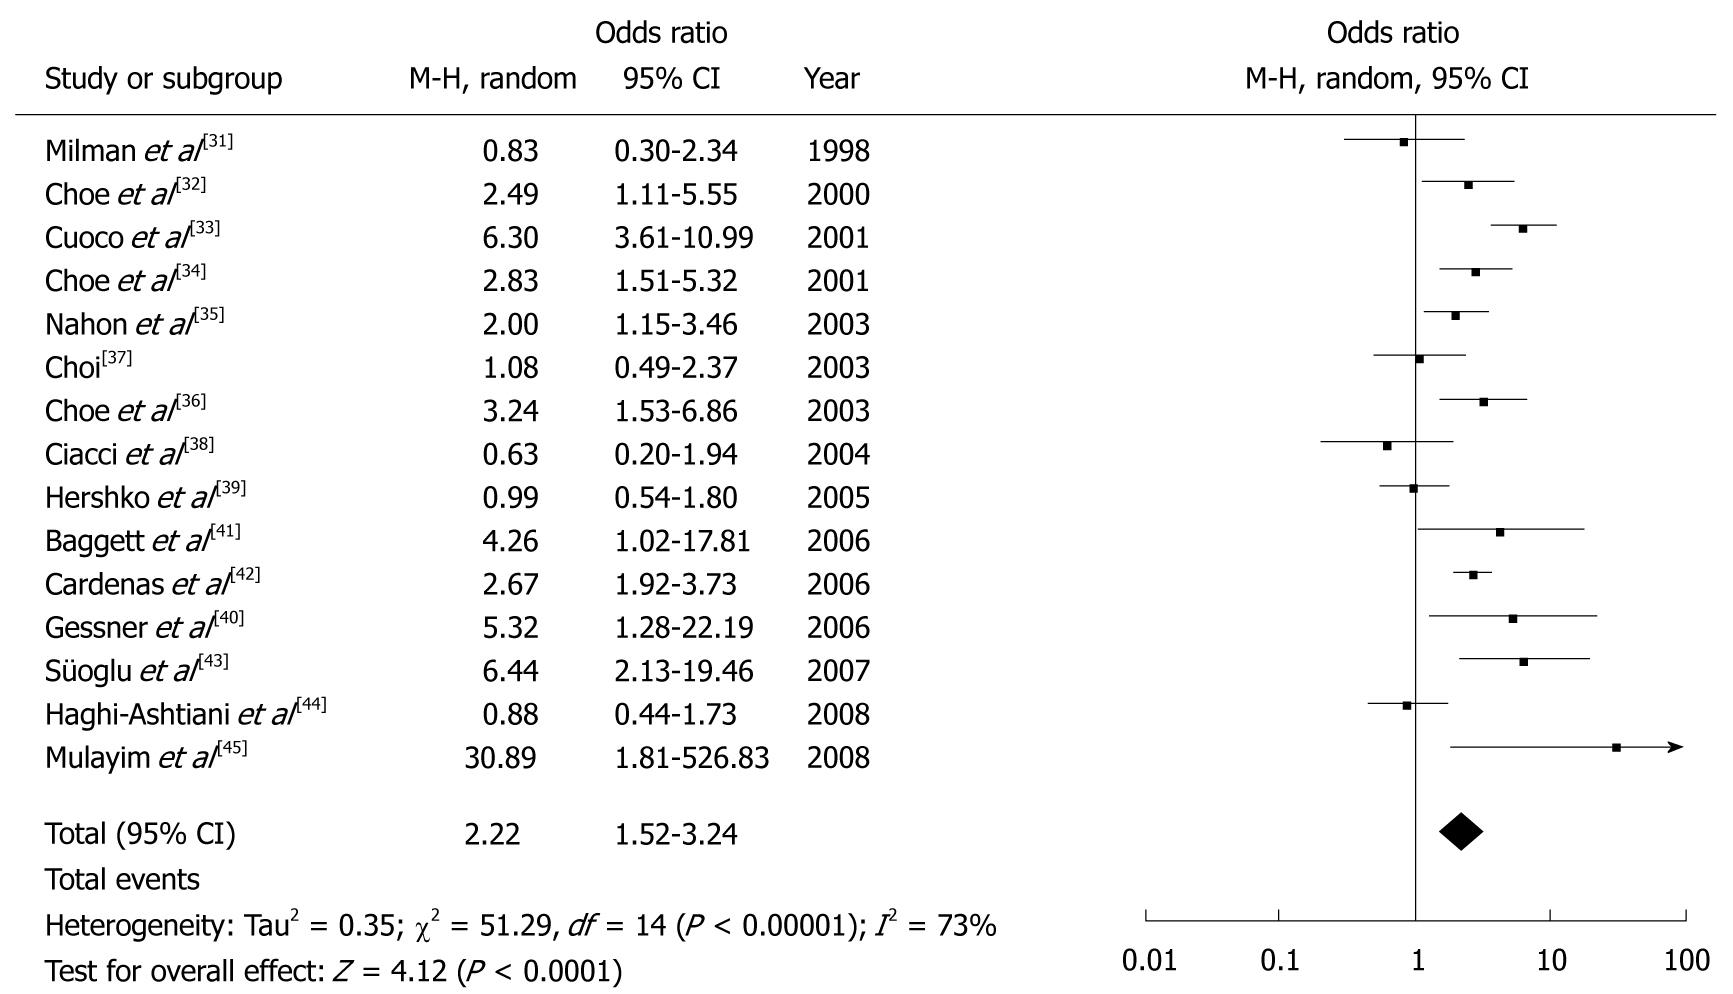
Figure 2 Forest plot of the observational studies.
M-H, Random: Mantel-Haenszel heterogeneity random effects model. Horizontal lines = 95% CI. The rectangles represent the point estimates of the study and the size of the rectangle represents the weight given to each study in the meta-analysis. The diamond represents the summary estimate; the size of the diamond represents the CIs of the summary estimate.
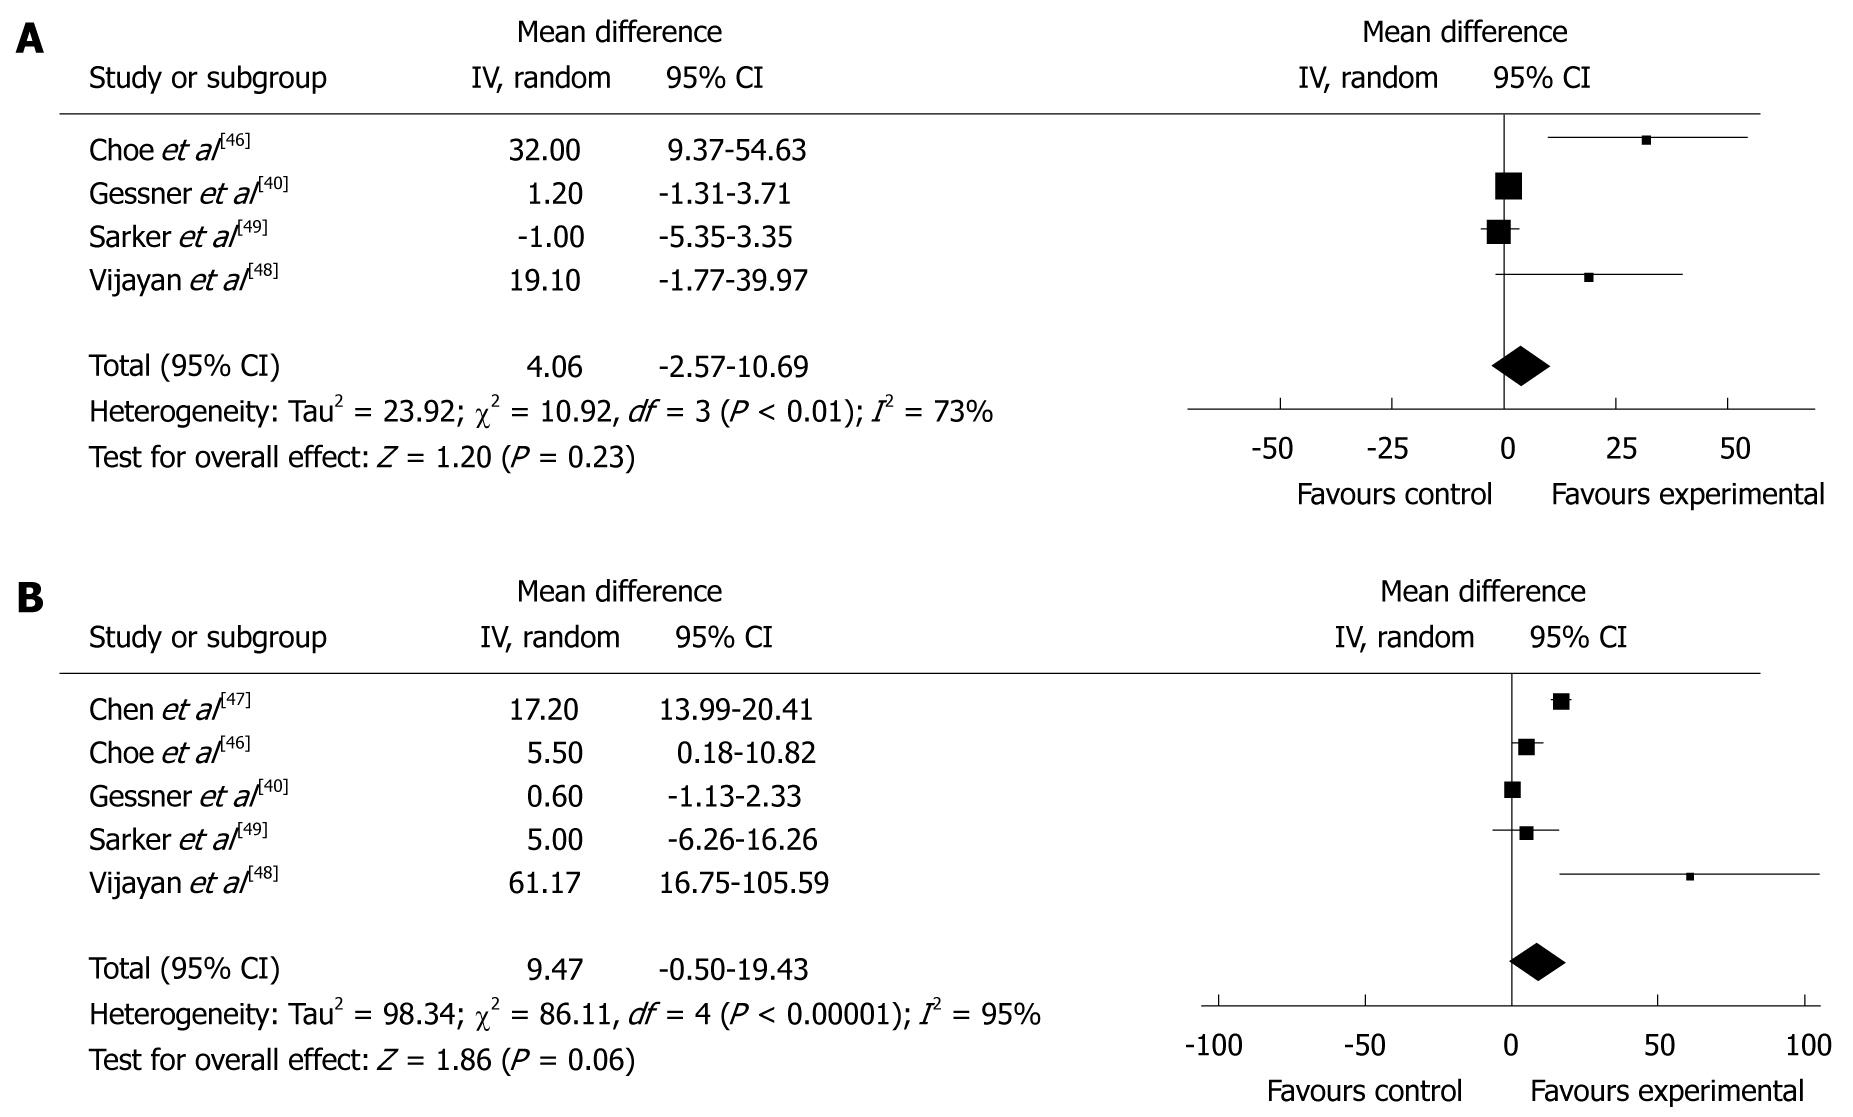
Figure 3 The treatment effect and underlying connection between H.
pylori and IDA. A: Weighted mean difference (WMD) forest plots of HB (g/L) involved in the meta-analysis; B: Forest plots of studies estimate changes in SF (μg/L) level. IV, Random: Inverse variance heterogeneity random effects model. Horizontal lines = 95% CI. The size of the data marker corresponds to the weight of that study. The diamond represents the summary estimate. The result favors experimental groups.
Figure 4 Funnel plots without (A) and with (B) trim and fill.
The pseudo 95% CI is computed as part of the analysis that produces the funnel plot, and corresponds to the expected 95% CI for a given standard error (SE). OR: Odds ratio.
-
Citation: Qu XH, Huang XL, Xiong P, Zhu CY, Huang YL, Lu LG, Sun X, Rong L, Zhong L, Sun DY, Lin H, Cai MC, Chen ZW, Hu B, Wu LM, Jiang YB, Yan WL. Does
Helicobacter pylori infection play a role in iron deficiency anemia? A meta-analysis. World J Gastroenterol 2010; 16(7): 886-896 - URL: https://www.wjgnet.com/1007-9327/full/v16/i7/886.htm
- DOI: https://dx.doi.org/10.3748/wjg.v16.i7.886


