Copyright
©2010 Baishideng Publishing Group Co.
World J Gastroenterol. Dec 14, 2010; 16(46): 5861-5868
Published online Dec 14, 2010. doi: 10.3748/wjg.v16.i46.5861
Published online Dec 14, 2010. doi: 10.3748/wjg.v16.i46.5861
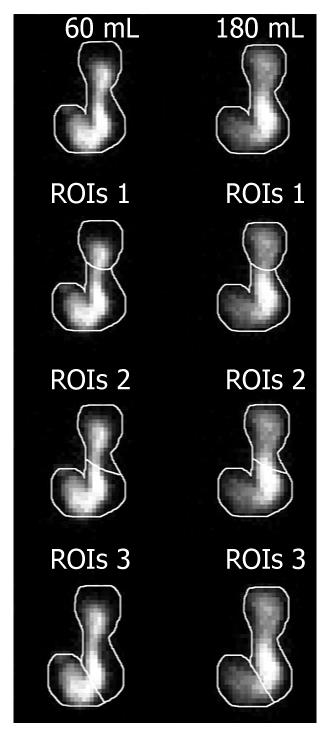
Figure 1 Scintigraphic images showing the composite images after meals with 60 mL and 180 mL, and the three proximal-distal image segmentations (ROIs) adopted.
ROIs: Regions of interest.
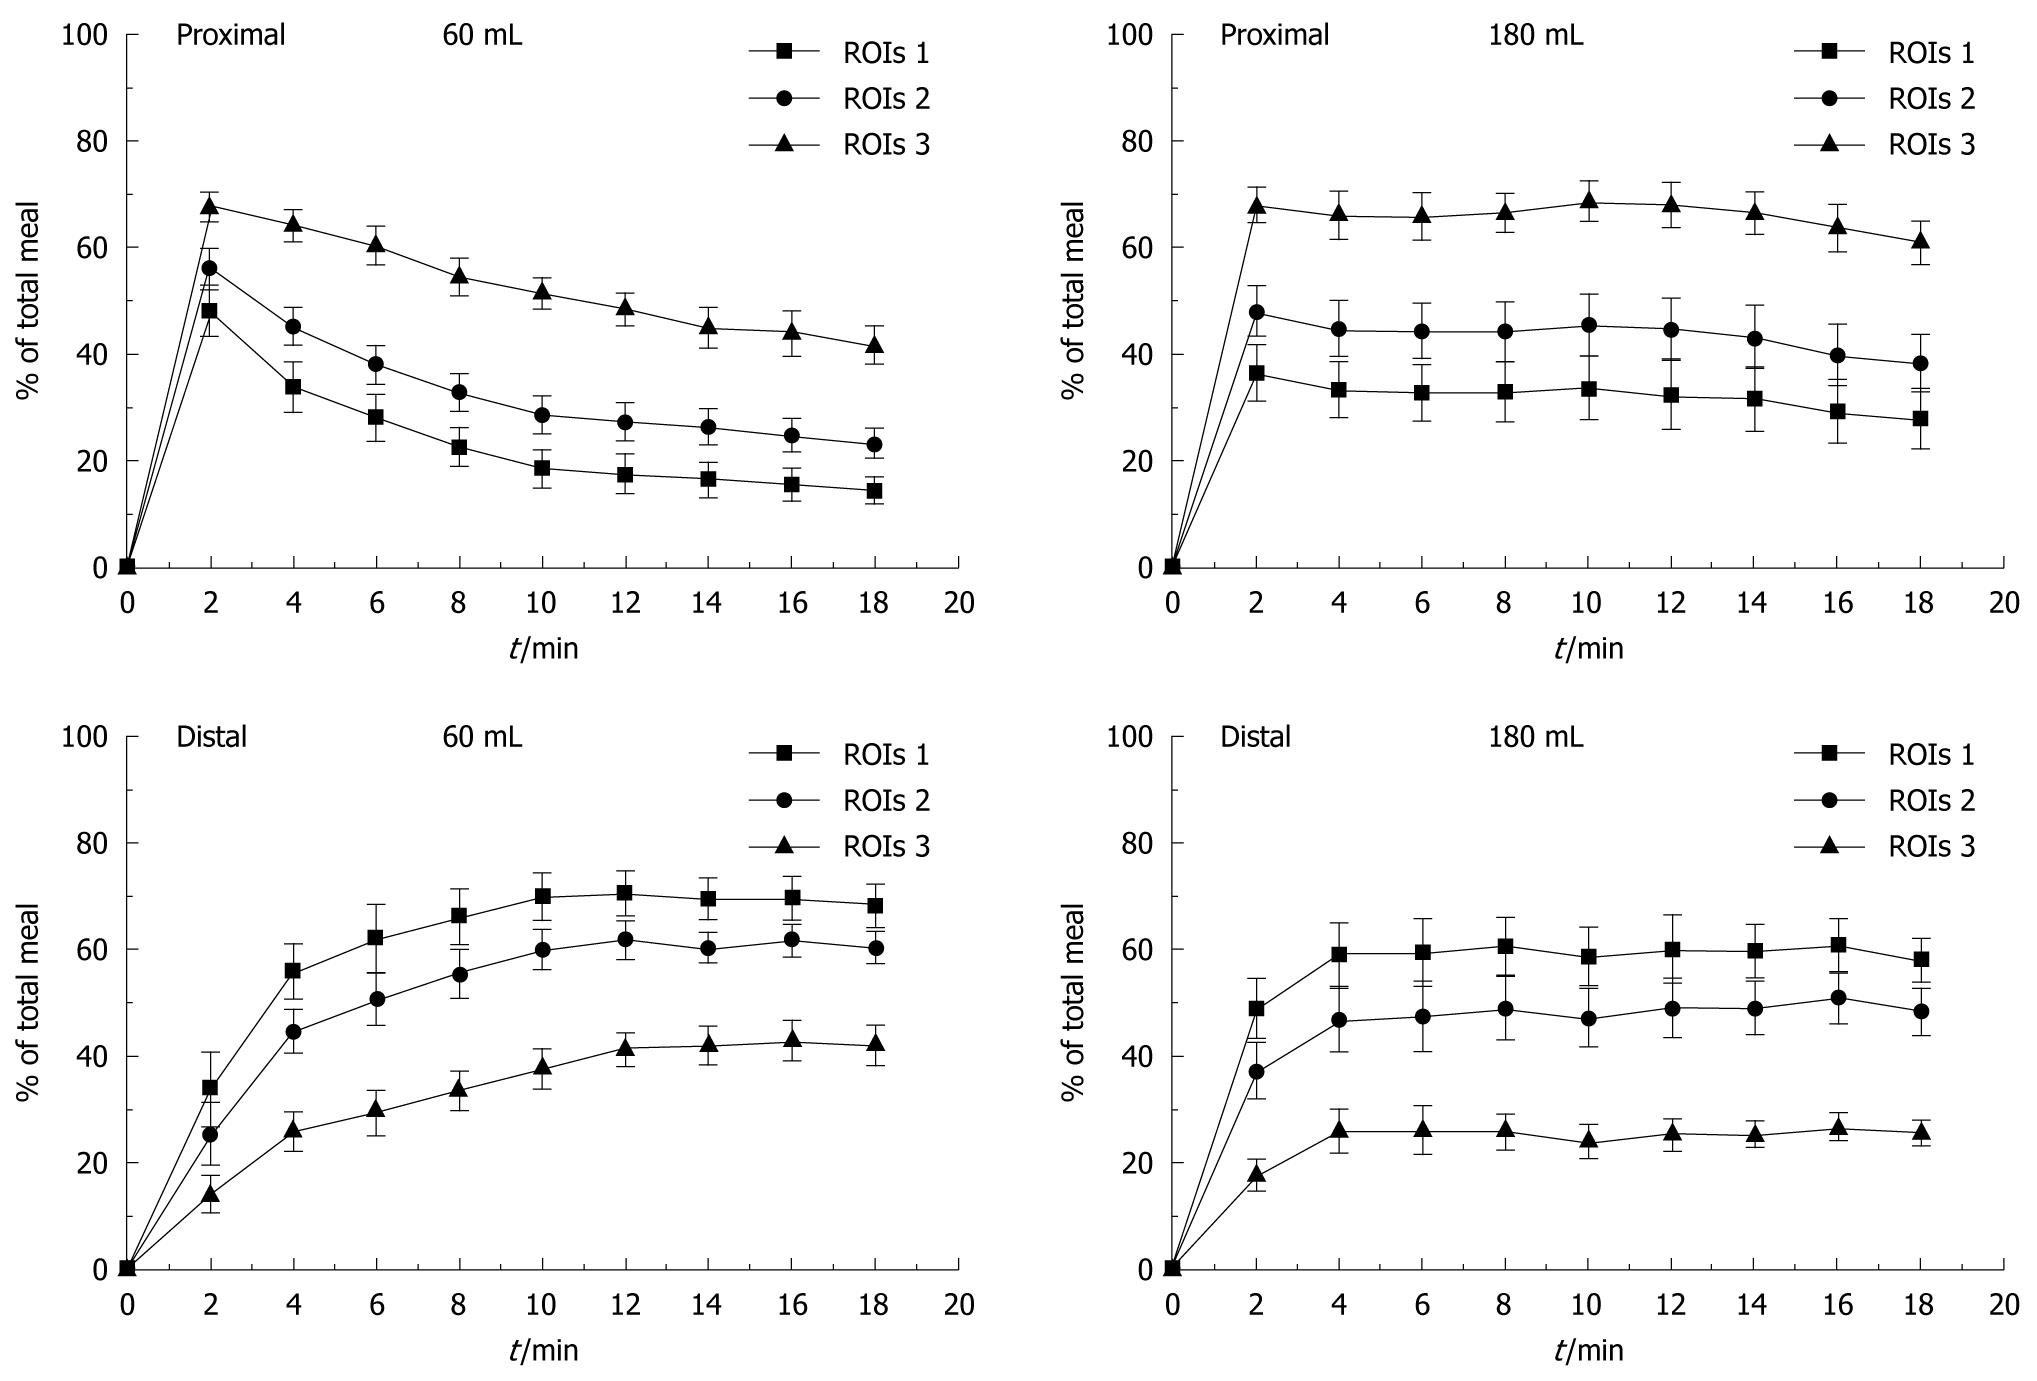
Figure 2 Proximal and distal stomach curves of intragastric distribution according to proximal-distal segmentation ROIs 1, ROIs 2 and ROIs 3 for meals with 60 and 180 mL.
Data are expressed as mean ± SE. ROIs: Regions of interest.
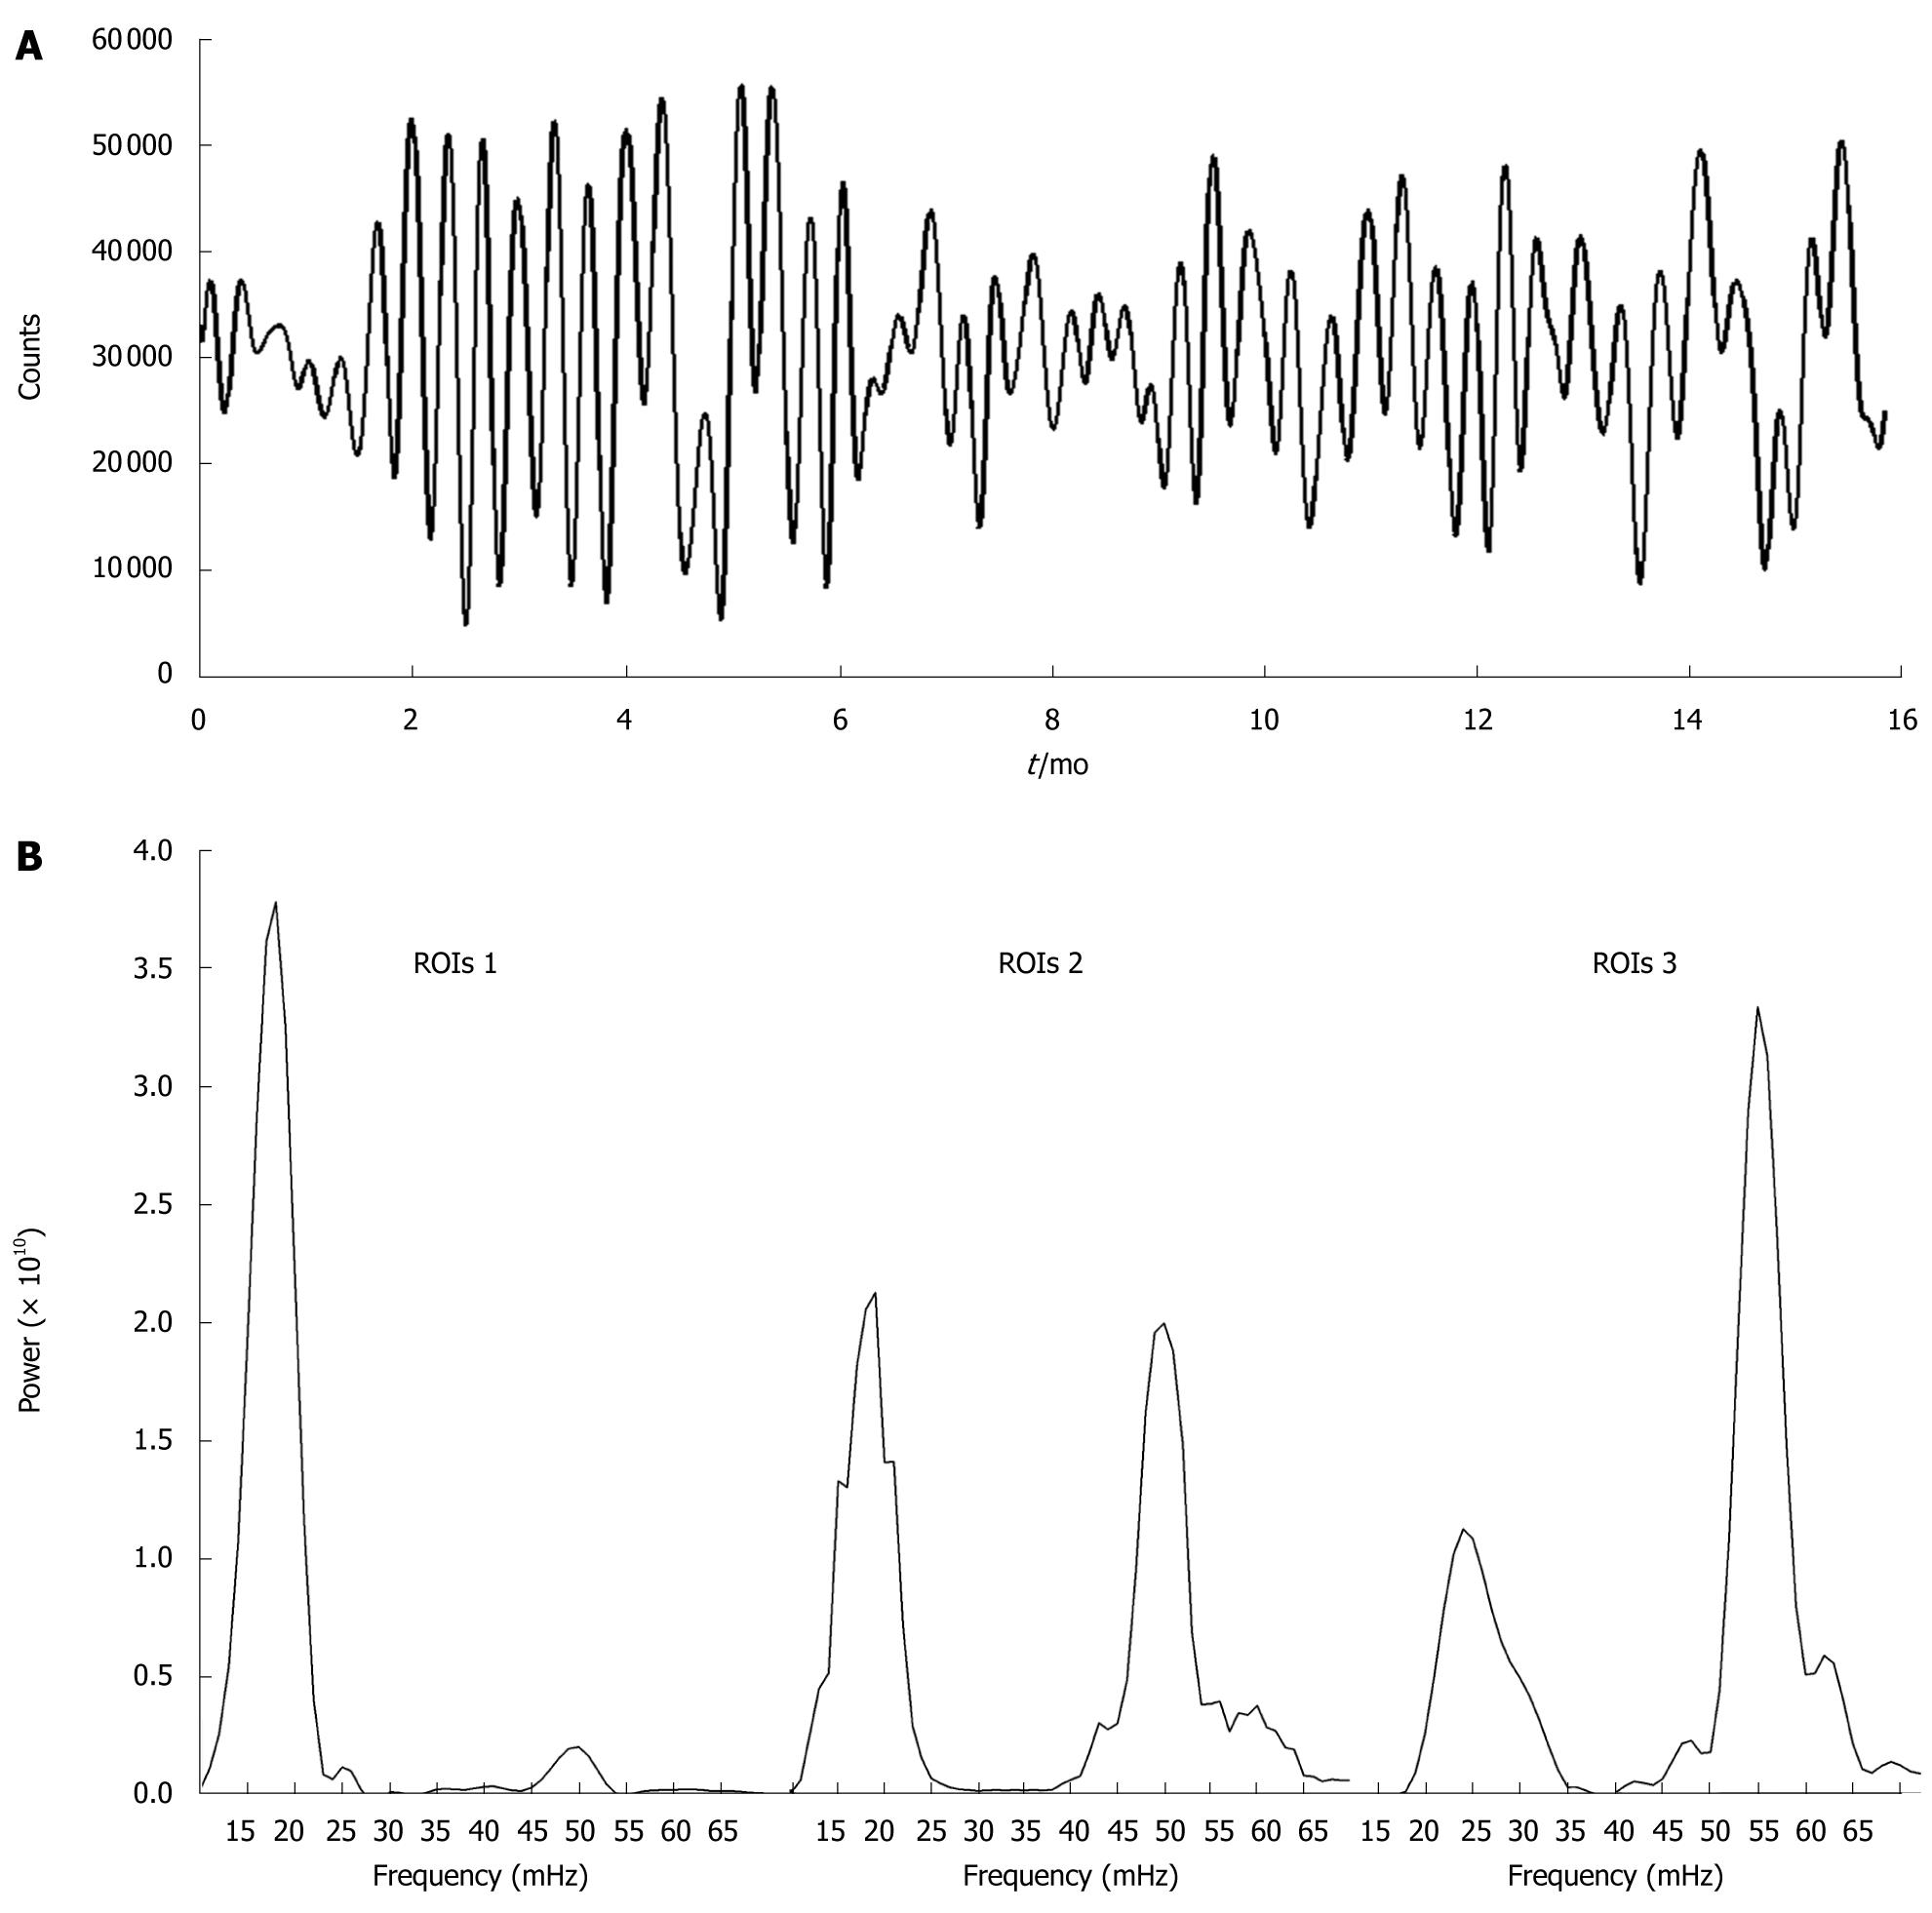
Figure 3 Both dominant frequencies (1 cpm or 17 mHz and 3 cpm or 50 mHz) can be observed overlapping in the signal of the proximal stomach (A), the power ratio of this signal indicated that there was a rearrangement of the maximum power of each of the frequencies (1 and 3 cpm) in agreement with the segmentation type B).
Figure 4 The power ratios showed the presence of both frequencies (1 cpm and 3 cpm) in the proximal and distal stomach, and that their intensities depend on the adopted proximal-distal segmentation and on the meal size ingested.
aP < 0.03 between 60 and 180 mL for both frequencies in distal region, cP < 0.005 between ROIs 1 and ROIs 3, eP < 0.05 between ROIs 1 and ROIs 3, gP < 0.05 between ROIs 2 and ROIs 3. ROIs: Regions of interest.
- Citation: Américo MF, Ietsugu MV, Romeiro FG, Corá LA, Oliveira RB, Miranda JRA. Effects of meal size and proximal-distal segmentation on gastric activity. World J Gastroenterol 2010; 16(46): 5861-5868
- URL: https://www.wjgnet.com/1007-9327/full/v16/i46/5861.htm
- DOI: https://dx.doi.org/10.3748/wjg.v16.i46.5861


