Copyright
©2010 Baishideng Publishing Group Co.
World J Gastroenterol. Nov 28, 2010; 16(44): 5565-5581
Published online Nov 28, 2010. doi: 10.3748/wjg.v16.i44.5565
Published online Nov 28, 2010. doi: 10.3748/wjg.v16.i44.5565
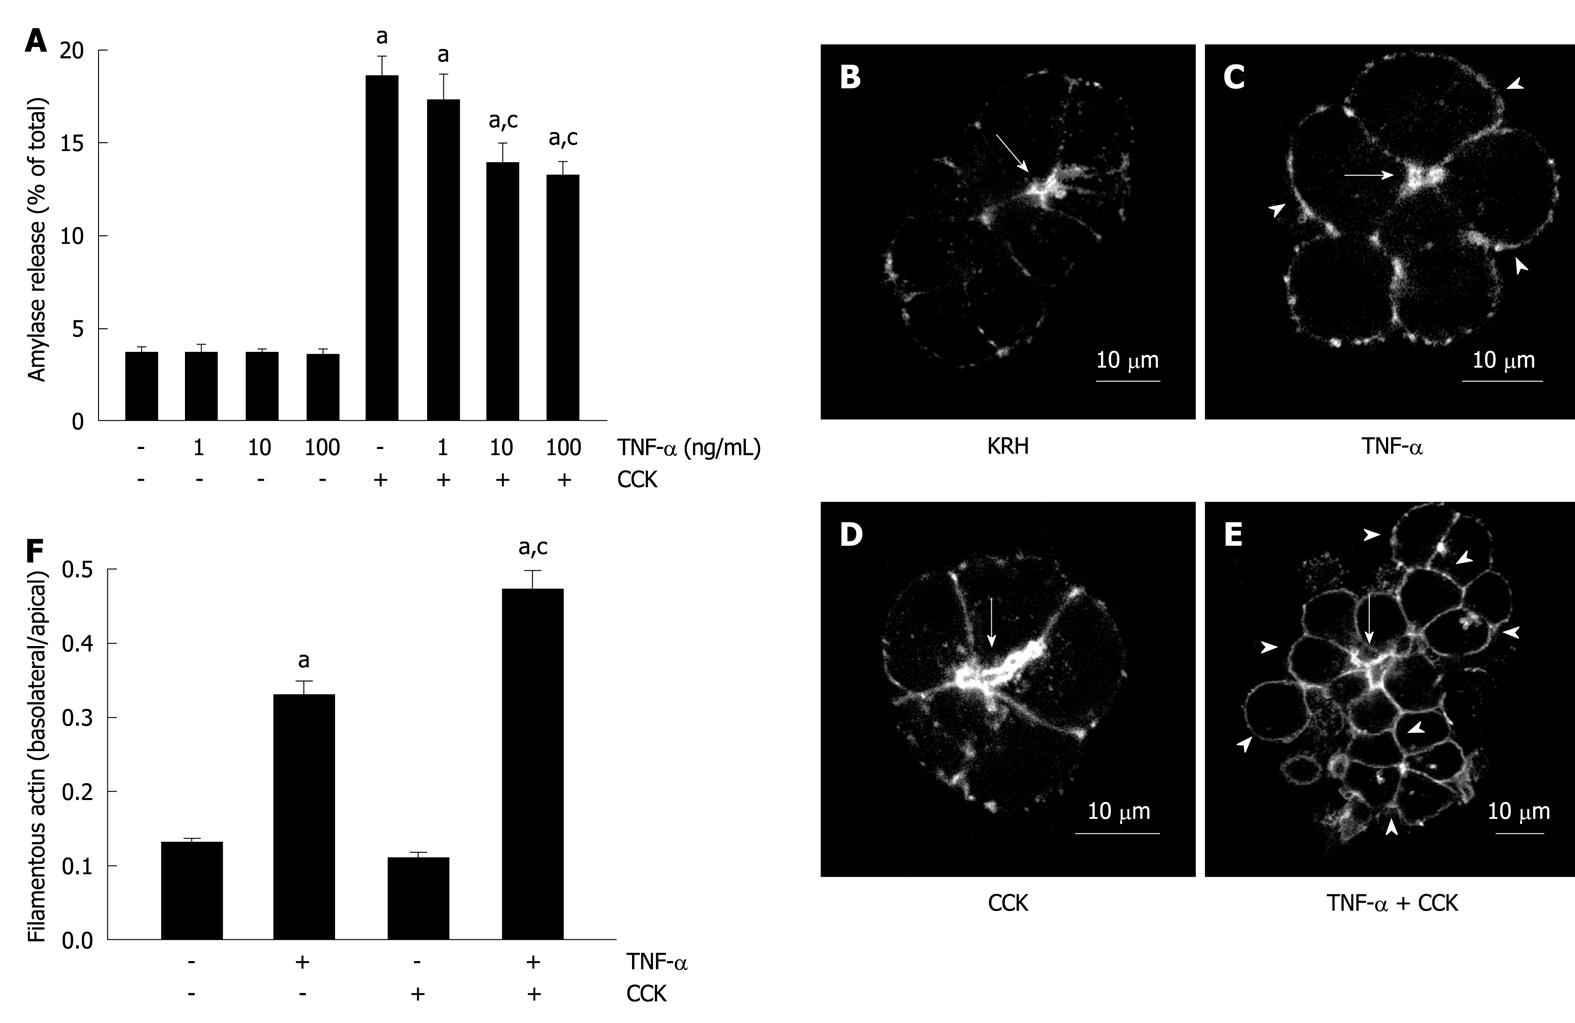
Figure 1 Tumor necrosis factor-α disorganizes the actin cytoskeleton and reduces submaximal cholecystokinin-stimulated amylase secretion.
A: Amylase secretion from pancreatic acini. Isolated pancreatic acini were stimulated with either the indicated concentrations of tumor necrosis factor-α (TNF-α) for 2 h, or 50 pmol/L cholecystokinin (CCK) for 1 h, or the indicated concentrations of TNF-α for 1 h followed by the indicated concentrations of TNF-α plus 50 pmol/L CCK for 1 h, or Krebs-Ringer-HEPES (KRH) (vehicle-control) for 2 h. Amylase secreted into the media was determined and expressed as a percentage of the total cellular amylase of the respective sample. Results correspond to the mean ± SE from four independent experiments, with samples performed in triplicate. aP < 0.05 vs KRH; cP < 0.05 vs CCK alone; B-F: Filamentous actin distribution; B-E: Confocal images of filamentous actin localization in pancreatic acinar cells. Isolated pancreatic acini were treated with either KRH for 2 h (B), or 10 ng/mL TNF-α for 2 h (C), or 50 pmol/L CCK for 1 h (D), or 10 ng/mL TNF-α for 1 h followed by 10 ng/mL TNF-α plus 50 pmol/L CCK for 1 h (E). Fixed and permeabilized acini were stained with Alexa Fluor 488-phalloidin. Arrows show apical lumens, and arrowheads show basolateral membranes. These are representative images selected from three independent experiments, with samples performed in triplicate; F: Quantification of filamentous actin distribution. Areas of the apical and basolateral membranes in acinar cells treated as in B-E were delineated and the fluorescence intensity was determined. Sixty cells from three independent experiments were analyzed per condition. Values correspond to the intensity in the basolateral area vs the apical area, and are expressed as the mean ± SE. aP < 0.05 vs KRH; cP < 0.05 vs TNF-α alone.
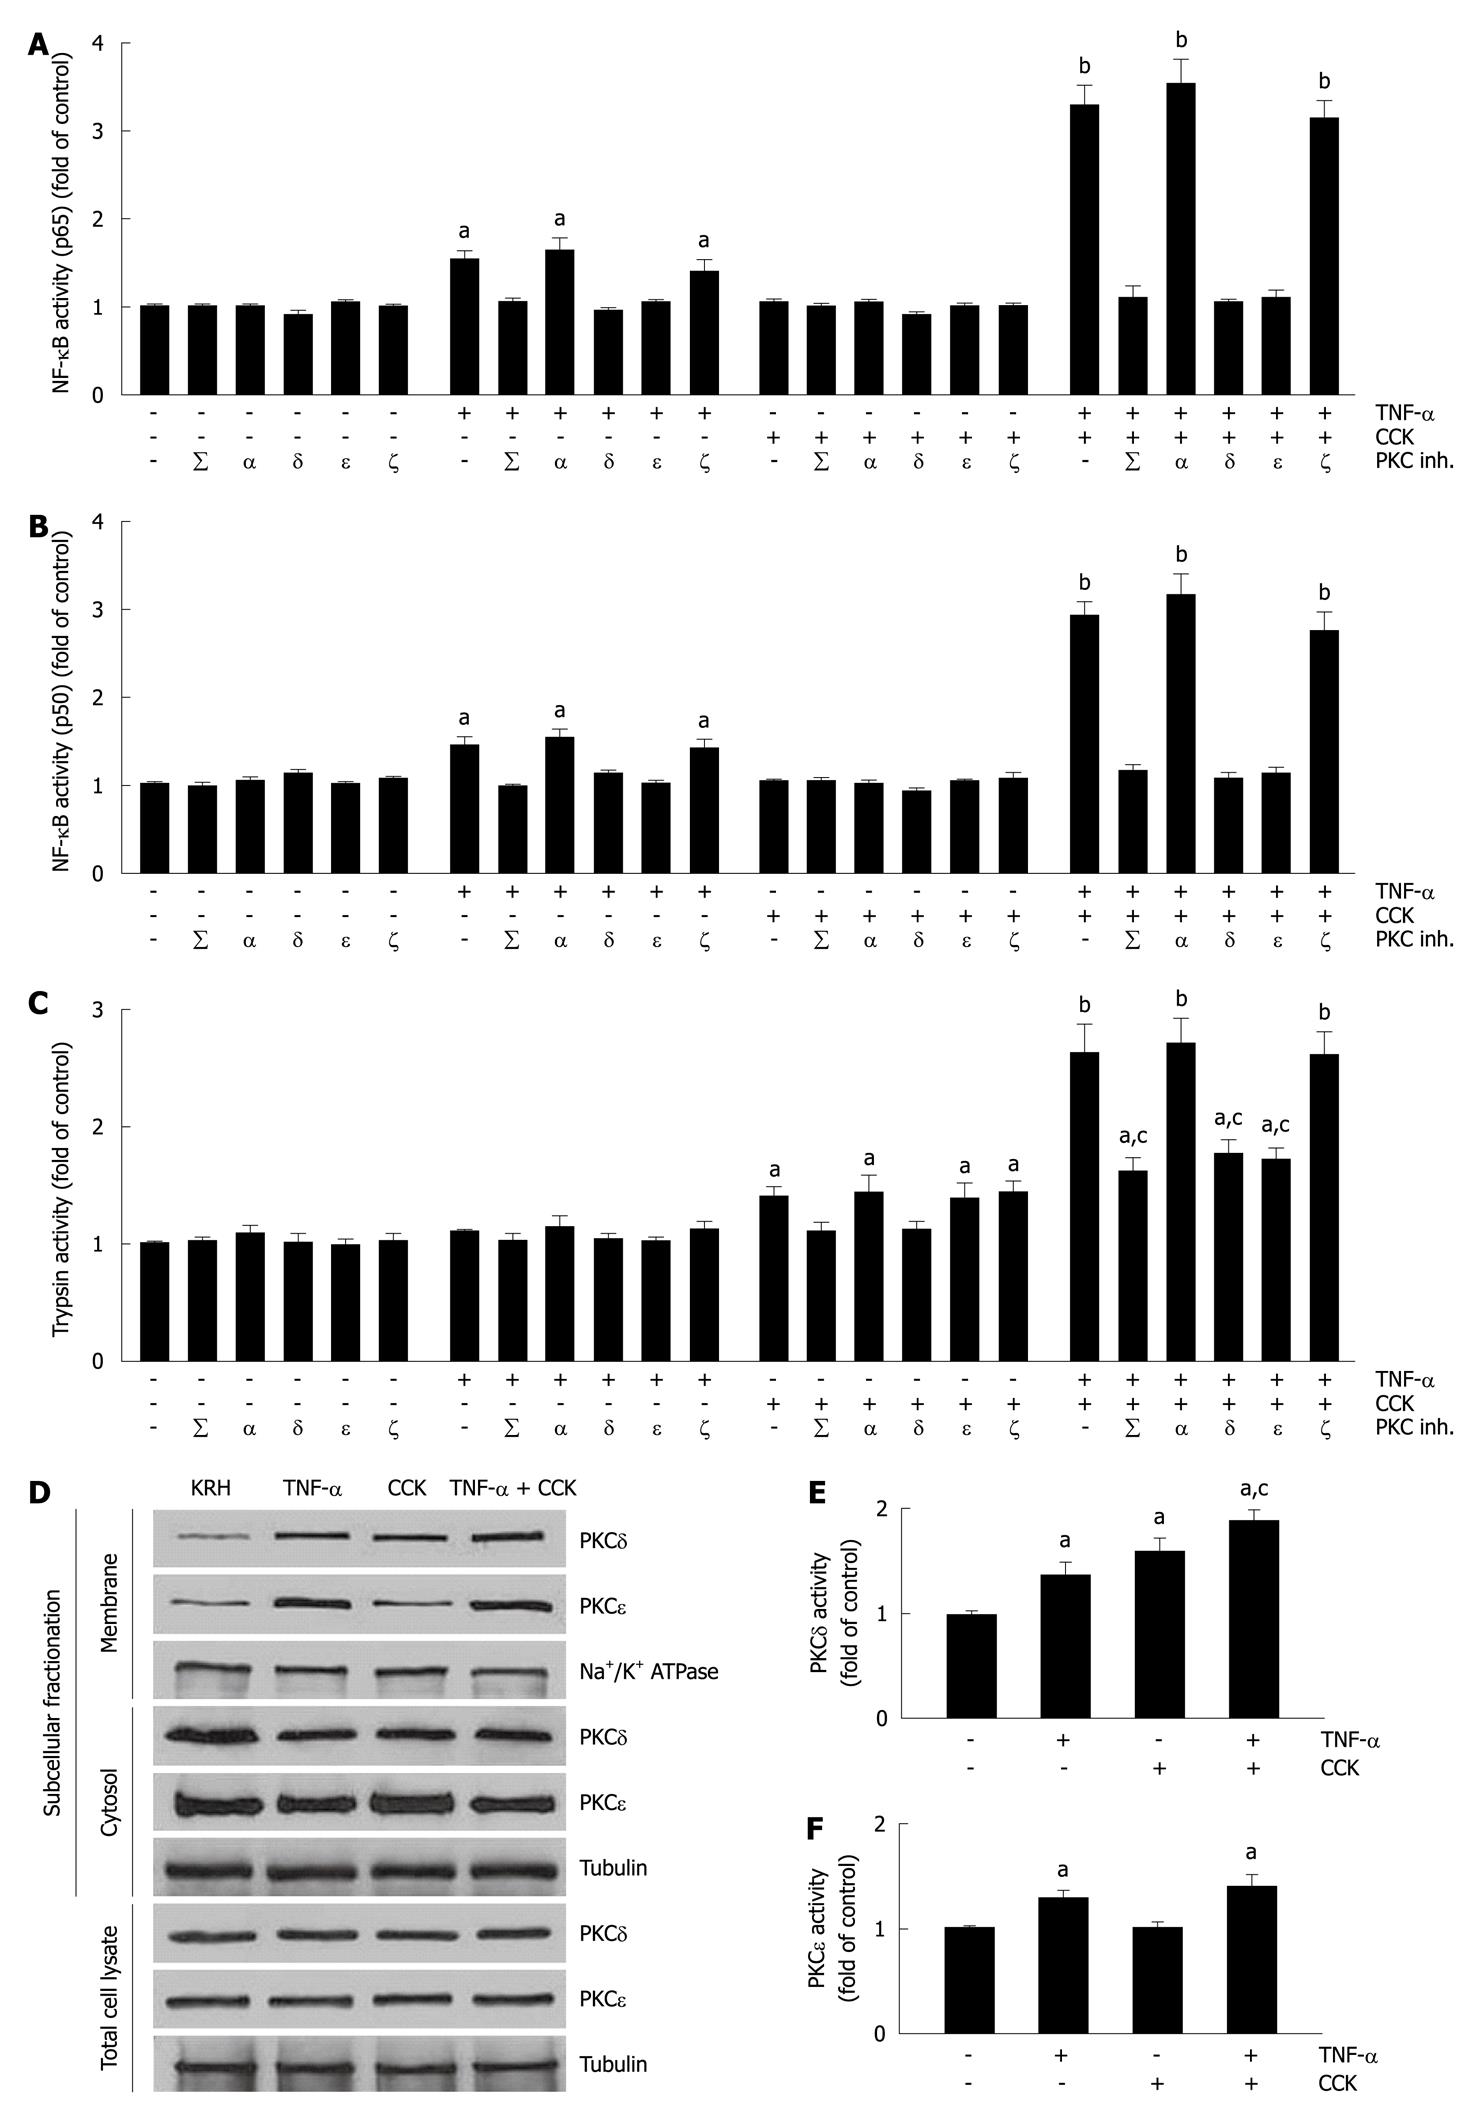
Figure 2 Mutual modulation of tumor necrosis factor-α-induced activation of nuclear factor-κB and cholecystokinin-induced trypsin activity by submaximal cholecystokinin and tumor necrosis factor-α, respectively, involves specific protein kinase C isoforms δ and ε.
A-C: Isolated pancreatic acini were incubated in Krebs-Ringer-HEPES (KRH) (vehicle-control, 3 h), or in KRH (2.5 h) followed by Calphostin C (iPKCΣ, 500 nmol/L, 30 min) or Gö6976 (iPKCα, 200 nmol/L, 30 min), or with the PKCδ translocation inhibitor δV1-1 (iPKCδ, 3 h, 10 μmol/L) or the PKCε translocation inhibitor εV1-2 (iPKCε, 3 h, 10 μmol/L) or the PKCζ myristoylated pseudosubstrate inhibitor (iPKCζ, 3 h, 10 μmol/L). The acini were then stimulated with either 10 ng/mL tumor necrosis factor-α (TNF-α) for 2 h, or 50 pmol/L cholecystokinin (CCK) for 1 h, or 10 ng/mL TNF-α for 1 h followed by 10 ng/mL TNF-α plus 50 pmol/L CCK for 1 h, or KRH for 2 h. Nuclear factor-κB (NF-κB) (p65) and NF-κB (p50) in nuclear extracts (A and B) were measured by enzyme-linked immunosorbent assay (ELISA) using the respective assay kit. Trypsin activity (C) was measured as described in Materials and Methods. A-C: Results are expressed as fold of control and correspond to the mean ± SE from four independent experiments, with samples performed in triplicate. aP < 0.05, bP < 0.01 vs KRH without inhibitors; cP < 0.05 vs TNF-α plus CCK without inhibitors; D-F: Dispersed acini were pre-incubated in KRH for 1 h and then stimulated with either 10 ng/mL TNF-α for 1.5 h, or 50 pmol/L CCK for 30 min, or 10 ng/mL TNF-α for 1 h followed by 10 ng/mL TNF-α plus 50 pmol/L CCK for 30 min, or KRH (vehicle-control) for 1.5 h; D: Subcellular fractionation showing PKCδ and ε translocation from the cytosol to the membrane upon TNF-α and/or CCK stimulation. After stimulation, acini were fractionated into membrane and cytosol fractions, and total cell lysates. 10 μg of protein of each fraction was separated on SDS-PAGE and immunoblotted with the antibodies to the indicated proteins. These blots are representative of three independent experiments; E, F: PKCδ and ε activity assays. Each well was loaded with 10 μg of protein. PKCδ and ε activities were measured by ELISA using the respective assay kit. Results are expressed as fold of control and correspond to the mean ± SE from four independent experiments, with samples performed in triplicate. aP < 0.05 vs vehicle-control; cP < 0.05 vs either TNF-α or CCK.
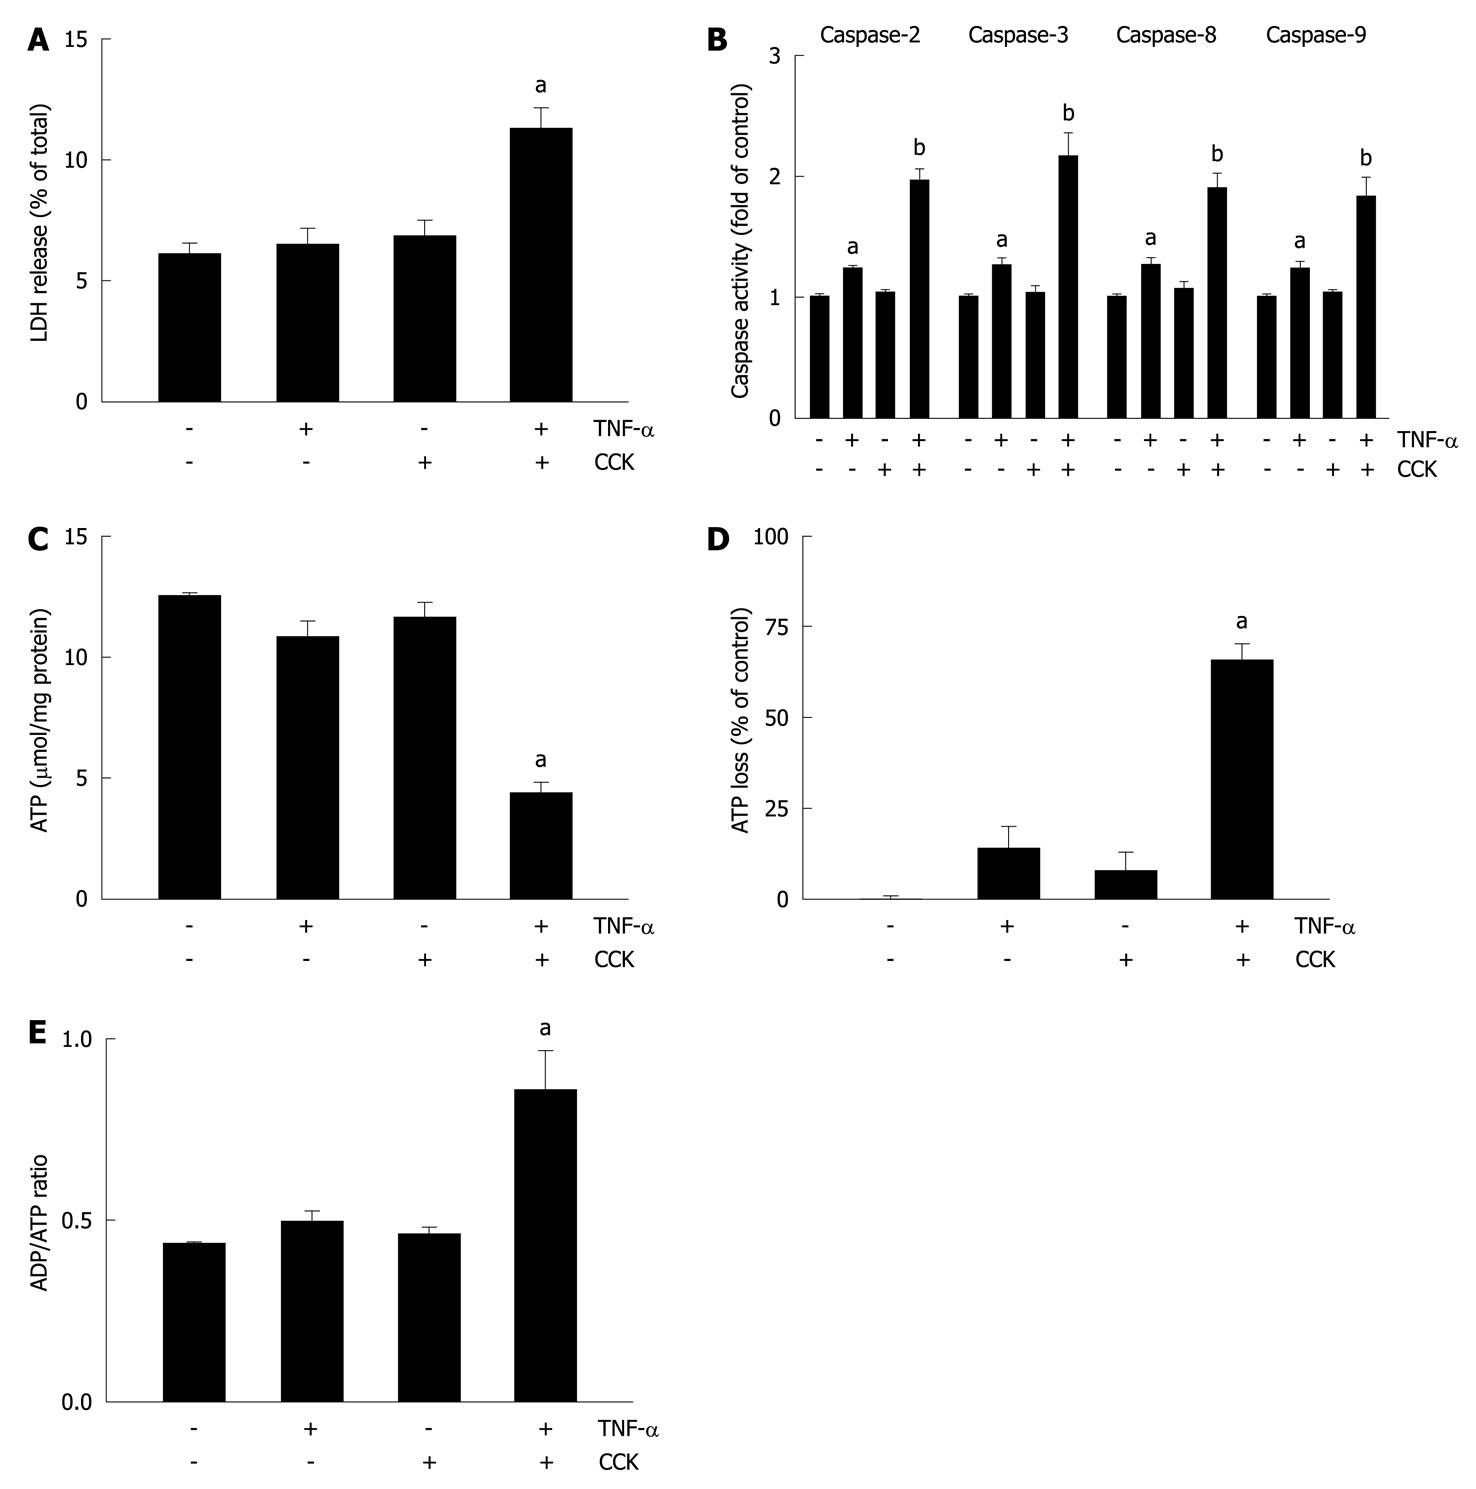
Figure 3 Tumor necrosis factor-α plus cholecystokinin induce apoptosis and necrosis in pancreatic acini.
A-E: Isolated pancreatic acini were stimulated with either 10 ng/mL tumor necrosis factor-α (TNF-α) for 2 h, or 50 pmol/L cholecystokinin (CCK) for 1 h, or 10 ng/mL TNF-α for 1 h followed by 10 ng/mL TNF-α plus 50 pmol/L CCK for 1 h, or vehicle-control for 2 h. A: Lactate dehydrogenase (LDH) was measured by the DGKC optimized kinetic method using the respective assay kit. Results are expressed as a percentage of total cellular LDH determined by permeabilizing cells with Triton X-100, and correspond to the mean ± SE from four independent experiments, with samples performed in triplicate. aP < 0.05 vs vehicle-control; B: Caspases 2, 3, 8, and 9 activity was measured by a colorimetric/fluorometric method using the respective assay kits. Results are expressed as fold of control and correspond to the mean ± SE from four independent experiments, with samples performed in triplicate. aP < 0.05, bP < 0.01 vs vehicle-control; C-E: ATP and ADP levels were measured by a bioluminescent method using the respective assay kits. ATP loss was calculated as a percentage of the decrease in values corresponding to vehicle-control. Results correspond to the mean ± SE from four independent experiments, with samples performed in triplicate. aP < 0.05 vs vehicle-control.
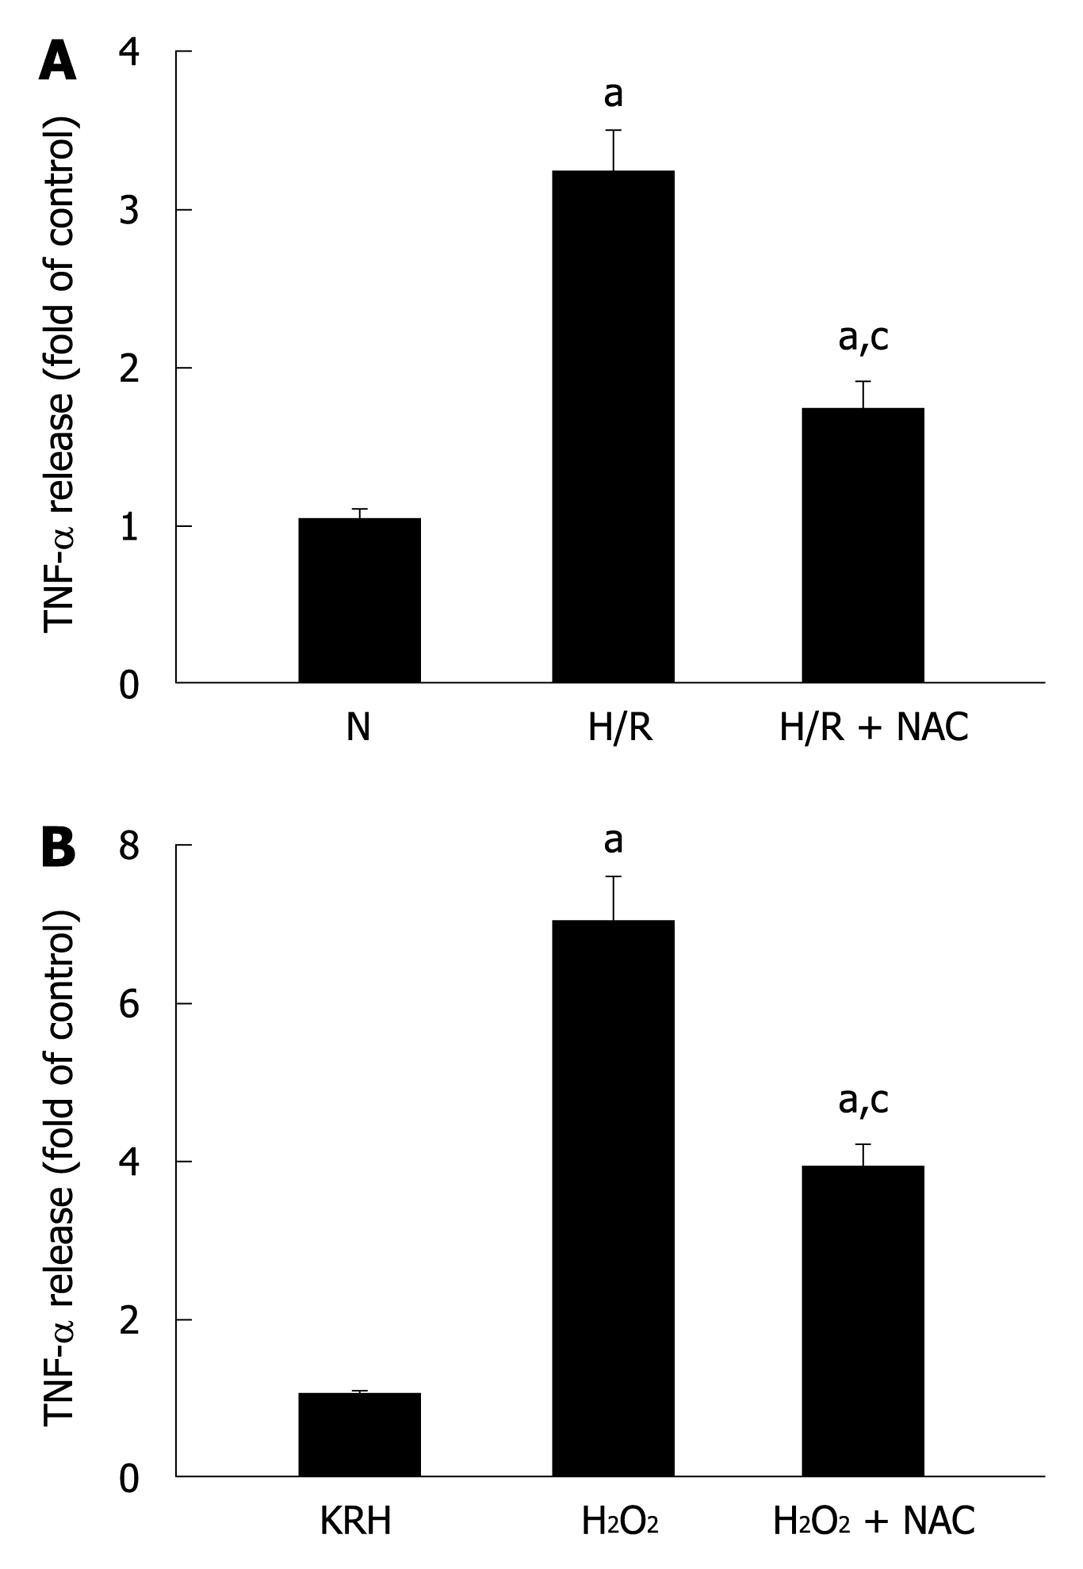
Figure 4 Pancreatic acinar cells secrete tumor necrosis factor-α in response to different stressful stimuli.
A: Isolated pancreatic acini were cultured in normoxic (N) conditions for 3.5 h or under hypoxia followed by normoxia-reoxygenation (H/R) for 30 min and 3 h, respectively, in the absence or presence of N-acetyl-cysteine (NAC) (30 mmol/L); B: Isolated pancreatic acini were cultured in Krebs-Ringer-HEPES (KRH) (vehicle-control) or stimulated with H2O2 (50 μmol/L) for 3 h in the absence or presence of NAC (30 mmol/L); A and B: TNF-α released into the supernatant was determined by enzyme-linked immunosorbent assay using the respective assay kit. Results are expressed as fold of control and correspond to the mean ± SE from four independent experiments, with samples performed in triplicate. aP < 0.05 vs normoxia (A) or to KRH (B); cP < 0.05 vs H/R (A) or H2O2 (B).
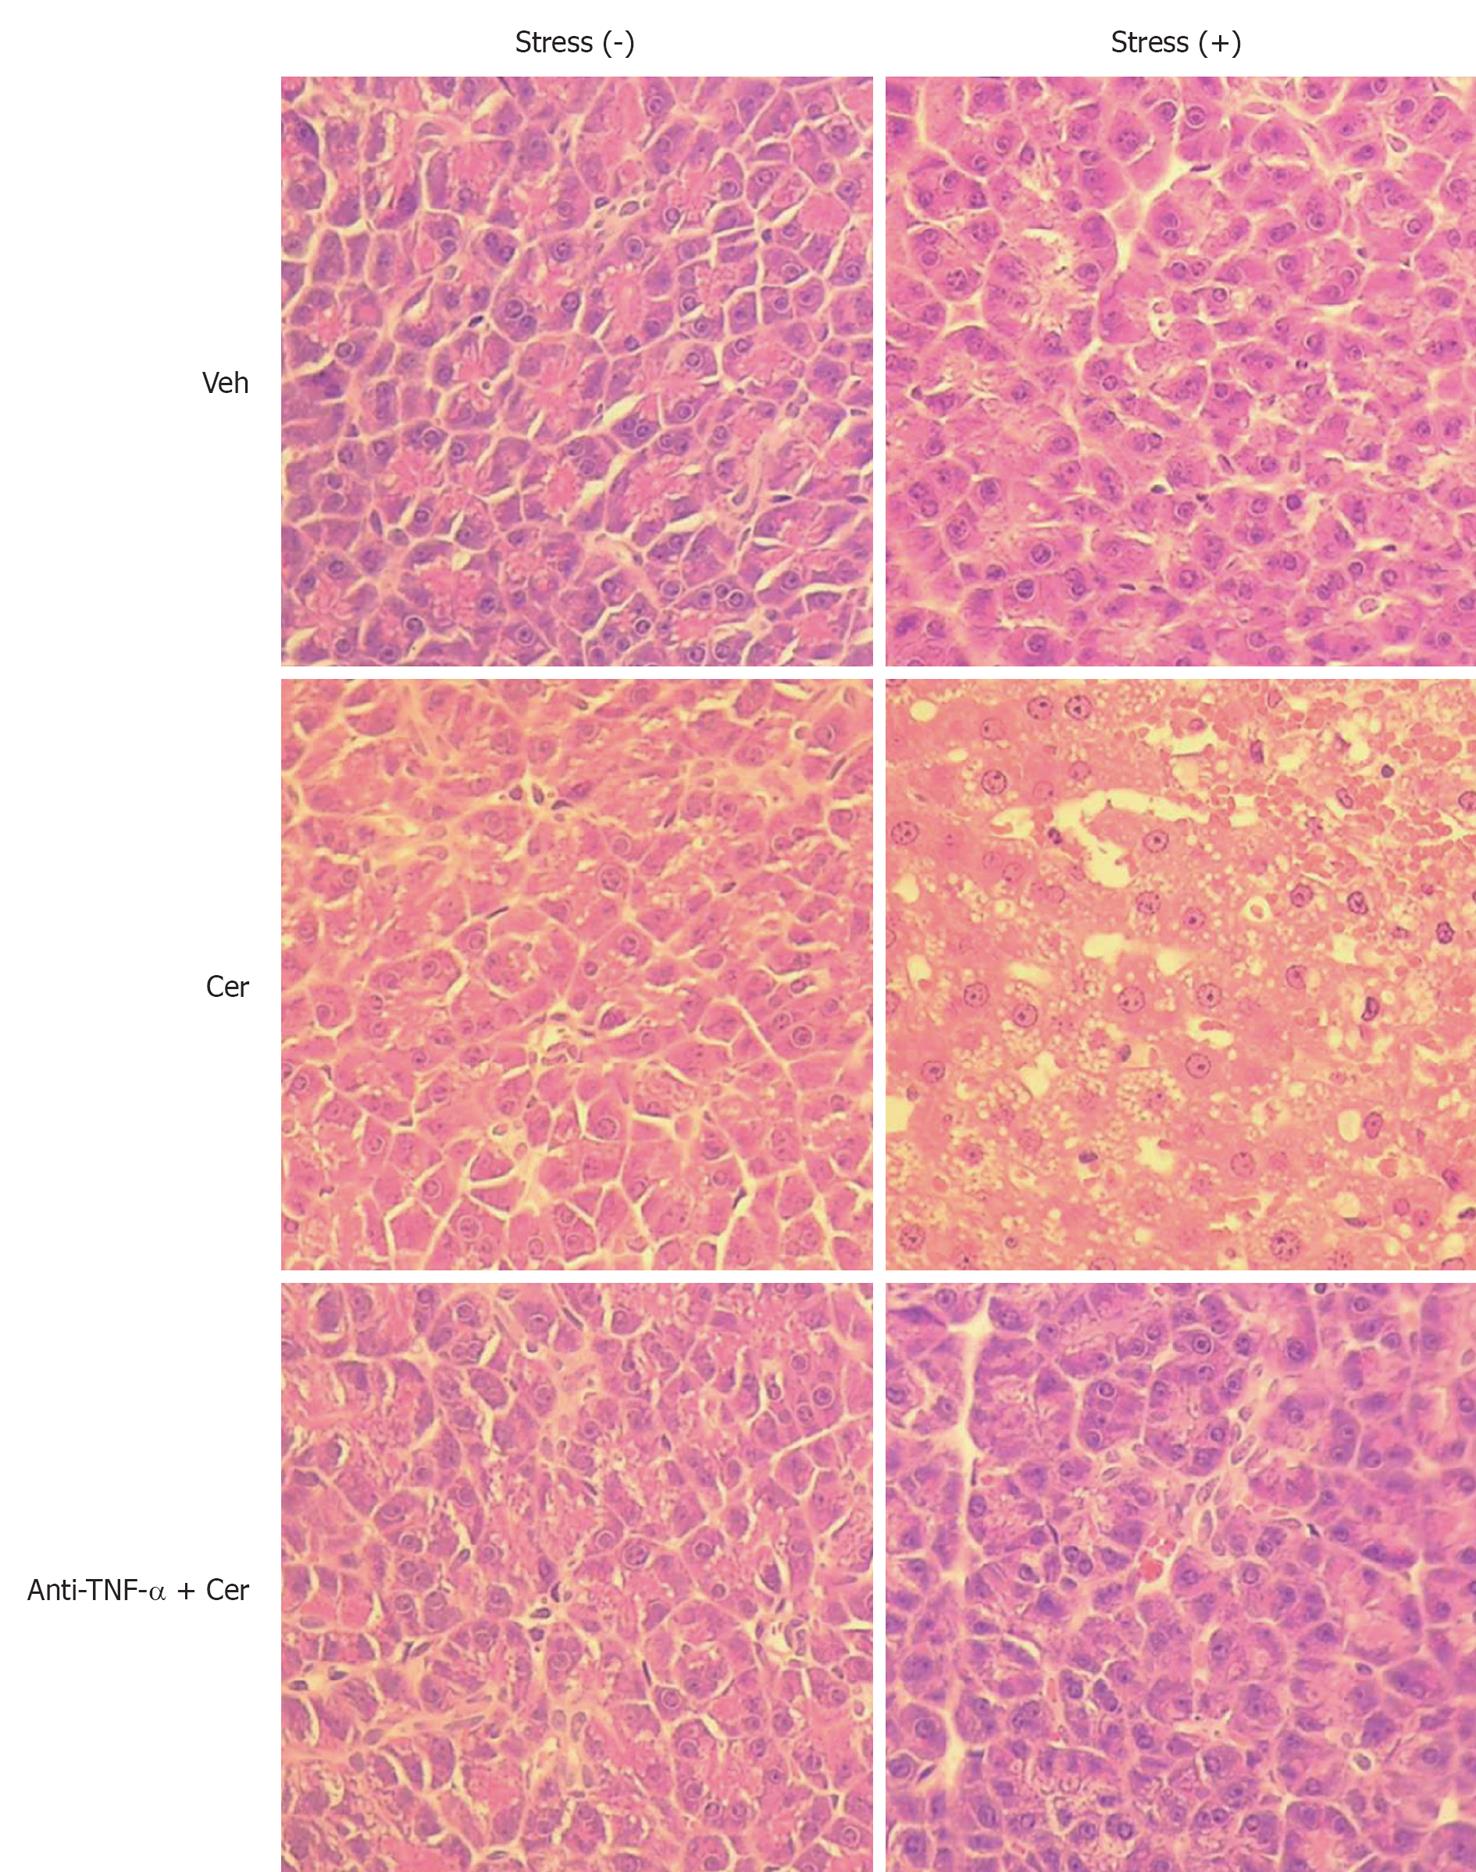
Figure 5 Chronic stress plus submaximal cerulein stimulation induces mild to moderate pancreatitis.
Rats exposed to sessions of restraint (4 h every day for 21 d), Stress (+) groups, and rats in the control, Stress (-) groups, received daily intraperitoneal (ip) injections of either tumor necrosis factor-α (TNF-α)-neutralizing antibody (50 μg/kg) or control IgG. Rats were then treated with six hourly ip injections of either saline or cerulein (Cer, 0.2 μg/kg). Representative histology images of pancreatic tissue. HE, original magnification, 40 ×.
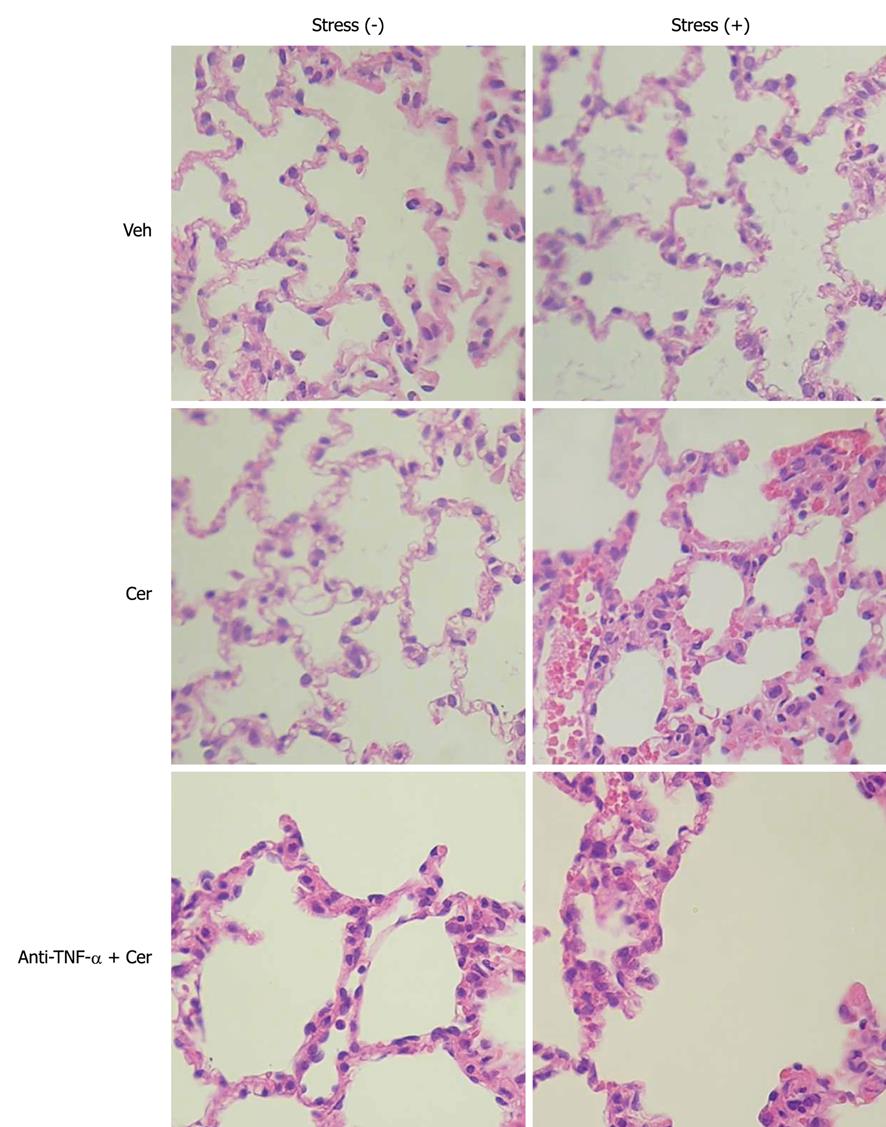
Figure 6 Chronic stress plus submaximal cerulein stimulation induces pancreatitis-associated lung injury.
Rats exposed to sessions of restraint (4 h every day for 21 d), Stress (+) groups, and rats in the control, Stress (-) groups, received daily intraperitoneal (ip) injections of either tumor necrosis factor-α (TNF-α)-neutralizing antibody (50 μg/kg) or control IgG, rats were then treated with six hourly ip injections of either saline or cerulein (Cer, 0.2 μg/kg). Representative histology images of lung tissue. HE, original magnification, 40 ×.
- Citation: Binker MG, Binker-Cosen AA, Richards D, Gaisano HY, de Cosen RH, Cosen-Binker LI. Chronic stress sensitizes rats to pancreatitis induced by cerulein: Role of TNF-α. World J Gastroenterol 2010; 16(44): 5565-5581
- URL: https://www.wjgnet.com/1007-9327/full/v16/i44/5565.htm
- DOI: https://dx.doi.org/10.3748/wjg.v16.i44.5565


