Copyright
©2010 Baishideng Publishing Group Co.
World J Gastroenterol. Nov 7, 2010; 16(41): 5162-5172
Published online Nov 7, 2010. doi: 10.3748/wjg.v16.i41.5162
Published online Nov 7, 2010. doi: 10.3748/wjg.v16.i41.5162
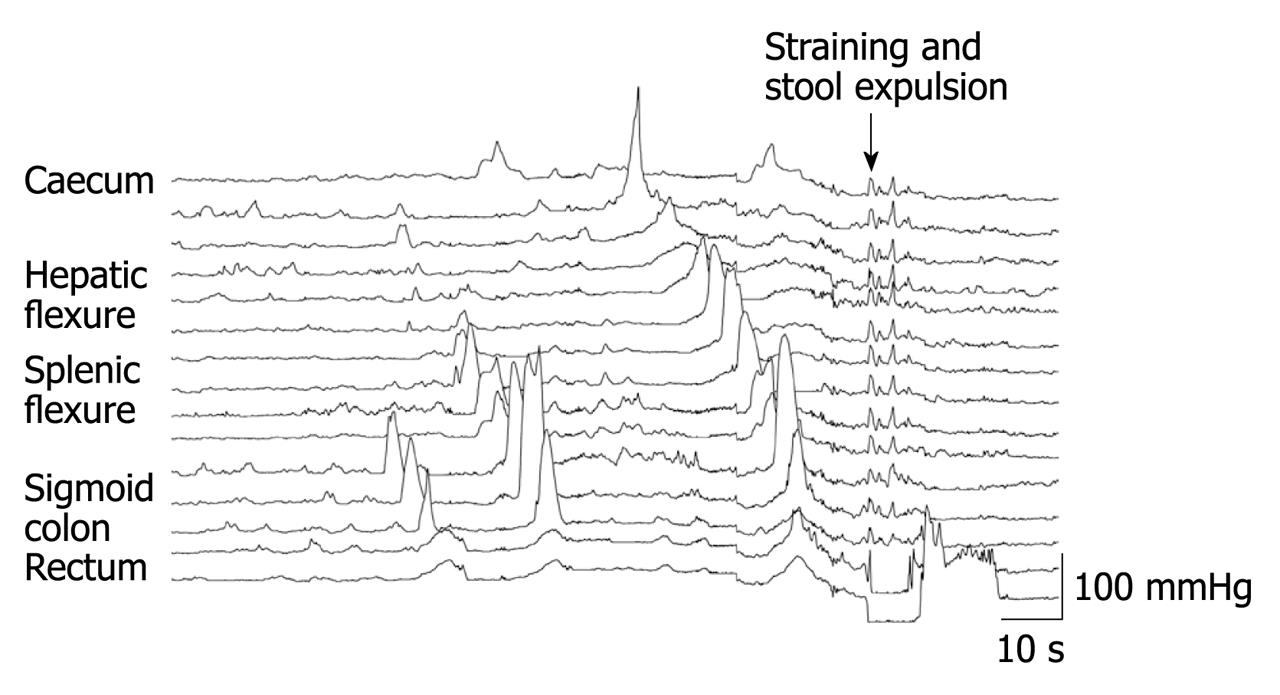
Figure 2 High amplitude propagating sequences are commonly associated with defaecation in healthy controls.
Note the series of three high amplitude propagating sequences (HAPSs) prior to stool expulsion. The first originates at the distal descending colon, and with each subsequent HAPS, the site of origin moves to a more proximal location with the final HAPS extending the entire length of the colon[34].
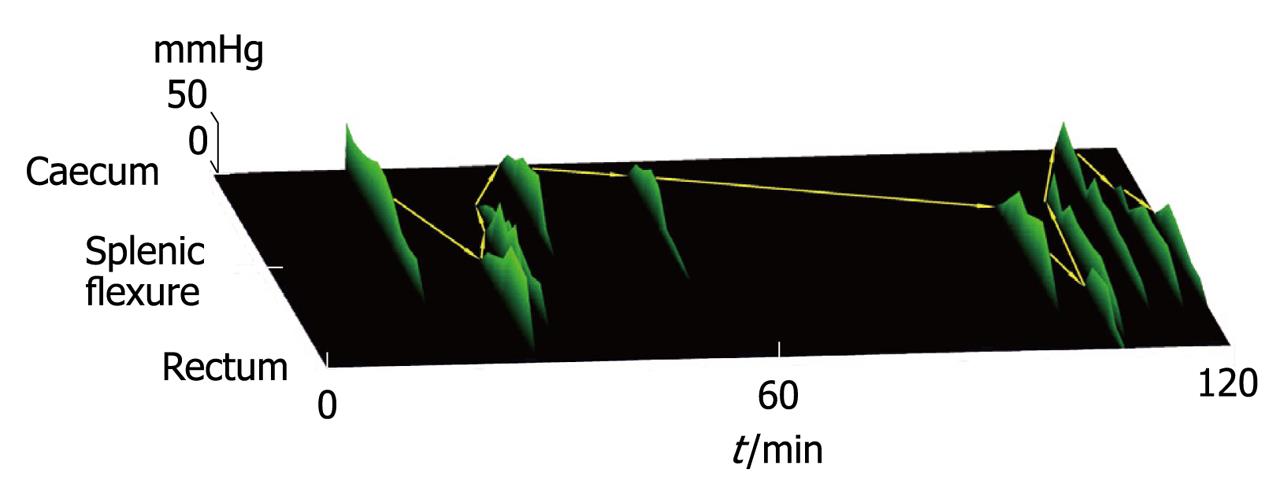
Figure 3 Two hour spatiotemporal maps of colonic propagating sequences in a female healthy control.
In this map each individual ridge represents an antegrade propagating sequence. The start of each ridge indicates the site of origin and the time of day the propagating sequence occurred. The length of the ridge indicates the extent of propagation. The heights of the ridge indicate the amplitude of the component pressure waves. The yellow arrows link the site of origin of sequential propagating sequences. While no single propagating sequence spans the entire colon collectively, a linked series of propagating sequences can do so[76].
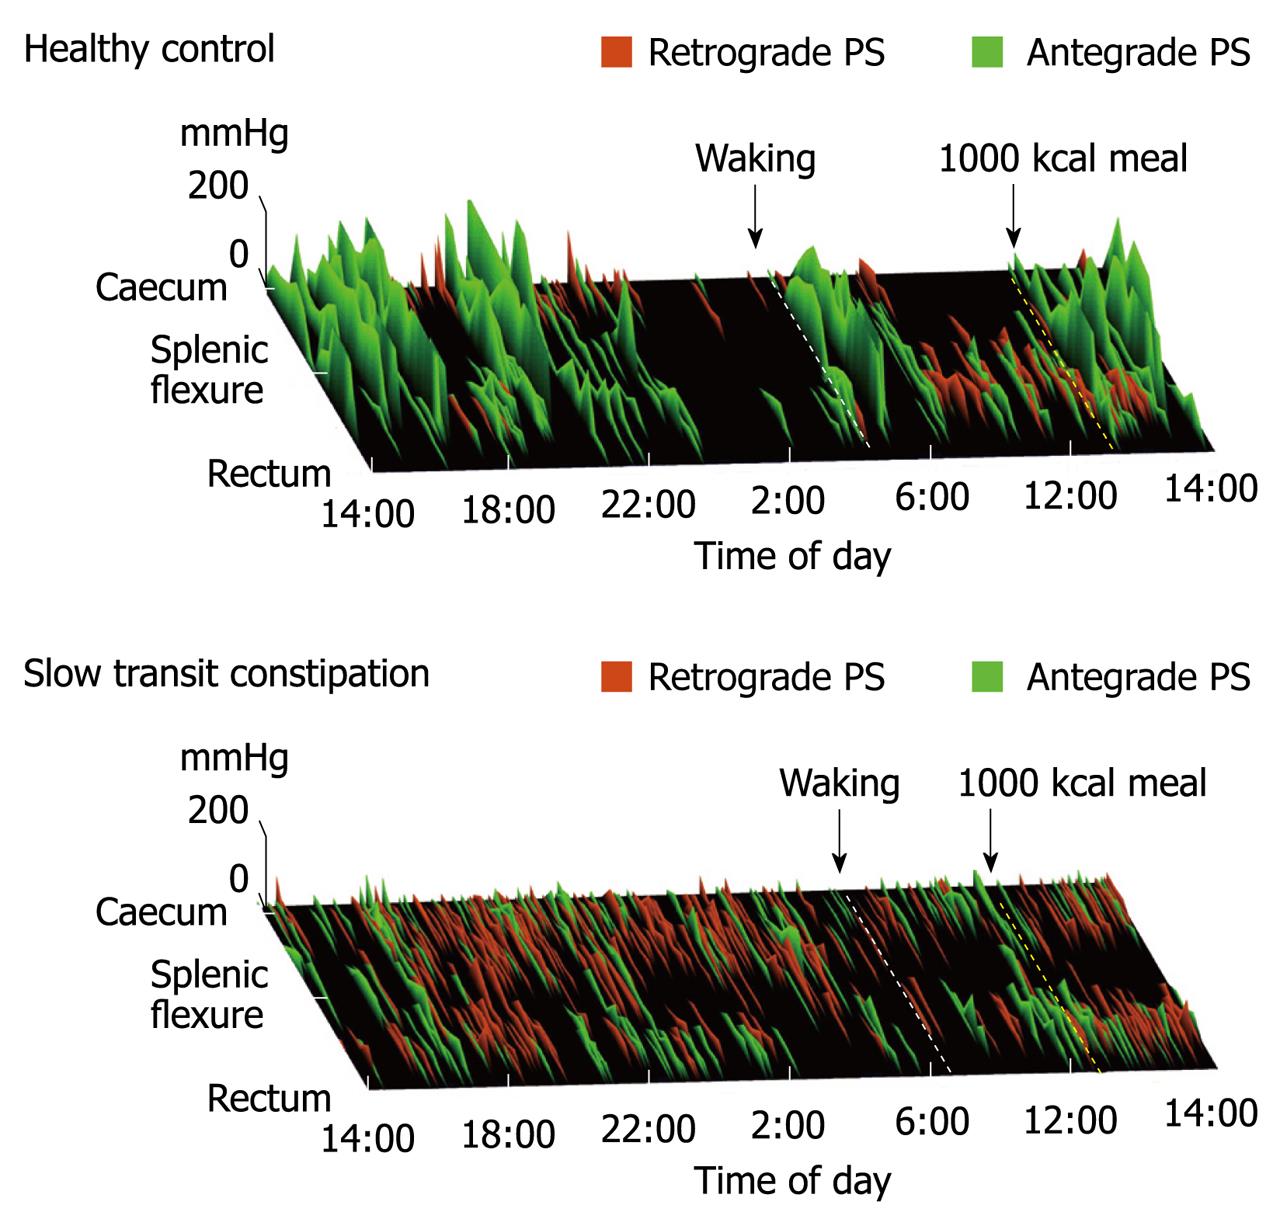
Figure 4 Twenty-four hour spatiotemporal maps[80] of colonic propagating sequences in a female healthy control and a female patient with slow transit constipation.
Within each map the ridges represent antegrade (green) and retrograde (red) propagating sequences (PS). The antegrade PSs originate at the orad end of the green ridge and retrograde PSs originate at the anal end of the red ridges. The start of each antegrade and retrograde ridge indicates the site of origin and the time of day the PS occurred. The length of the ridge indicates the extent of propagation. The height of the ridge indicates the amplitude of the component pressure waves. The yellow-hatched line indicates when the 1000 kcal lunch was given, the white-hatched line indicates the time of morning waking. In health the frequency of propagating sequences are reduced during sleep and increase upon morning waking and in response to a high calorie meal. The map in the STC patients is characterized by an increased frequency of short extent PSs and a lack of high amplitude propagating sequences. There is an absent meal response (no increase in PSs) and an absent nocturnal suppression of PSs.
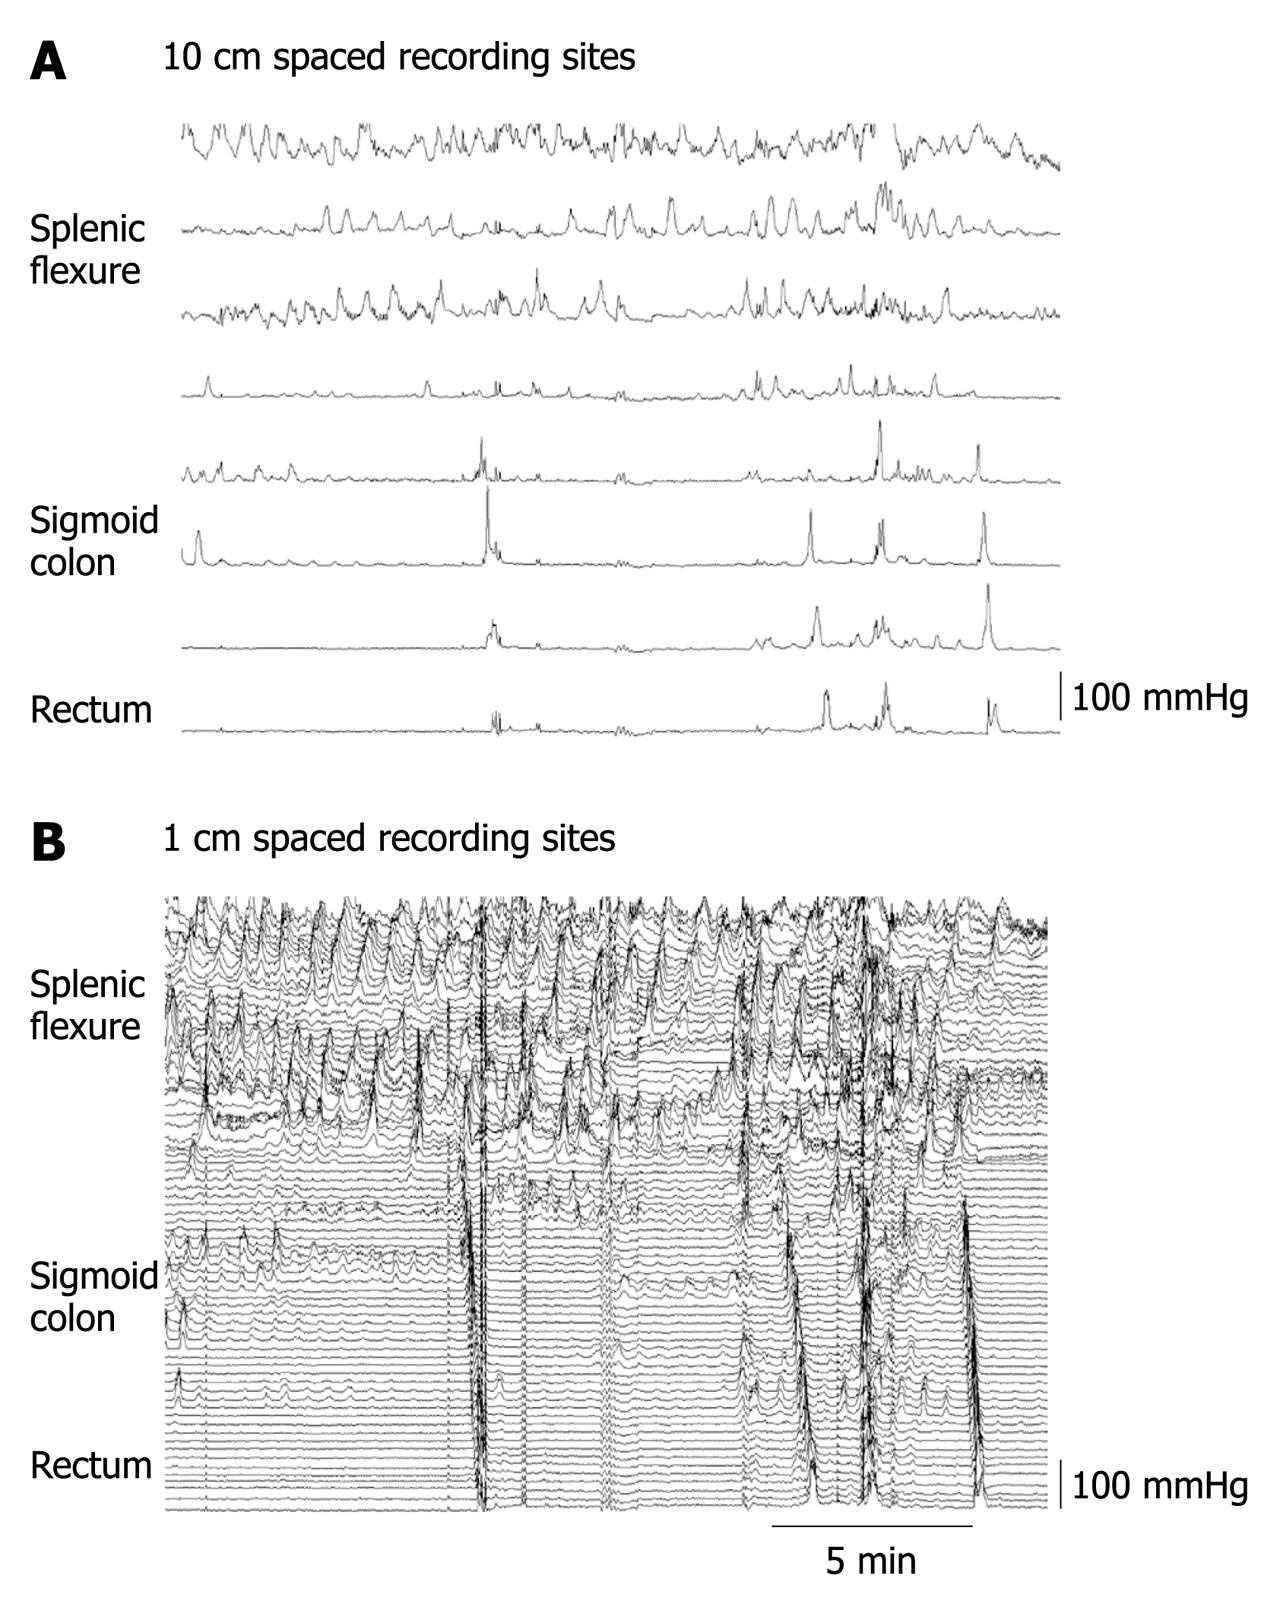
Figure 5 Manometric traces of colonic motor activity recorded by a fibre-optic manometry catheter with 90 sensors spaced at 1 cm intervals.
A: To represent common sensor spacing for current published colonic recordings, the data set, obtained through “high resolution” manometry, is sub-sampled to present every 10th channel (10 cm spacing, top); B: The complete data set, captured at 1 cm intervals, is displayed at the bottom. Note that at 10 cm spacing, the most proximal three channels reveal what appears to be non-propagating pressure waves. However, when the full data set is viewed (B), a series of short-extent retrograde propagating events are detected. These events are missed when spatial resolution is poor. Modified from[41].
- Citation: Dinning PG, Benninga MA, Southwell BR, Scott SM. Paediatric and adult colonic manometry: A tool to help unravel the pathophysiology of constipation. World J Gastroenterol 2010; 16(41): 5162-5172
- URL: https://www.wjgnet.com/1007-9327/full/v16/i41/5162.htm
- DOI: https://dx.doi.org/10.3748/wjg.v16.i41.5162


