Copyright
©2010 Baishideng Publishing Group Co.
World J Gastroenterol. Oct 14, 2010; 16(38): 4838-4845
Published online Oct 14, 2010. doi: 10.3748/wjg.v16.i38.4838
Published online Oct 14, 2010. doi: 10.3748/wjg.v16.i38.4838
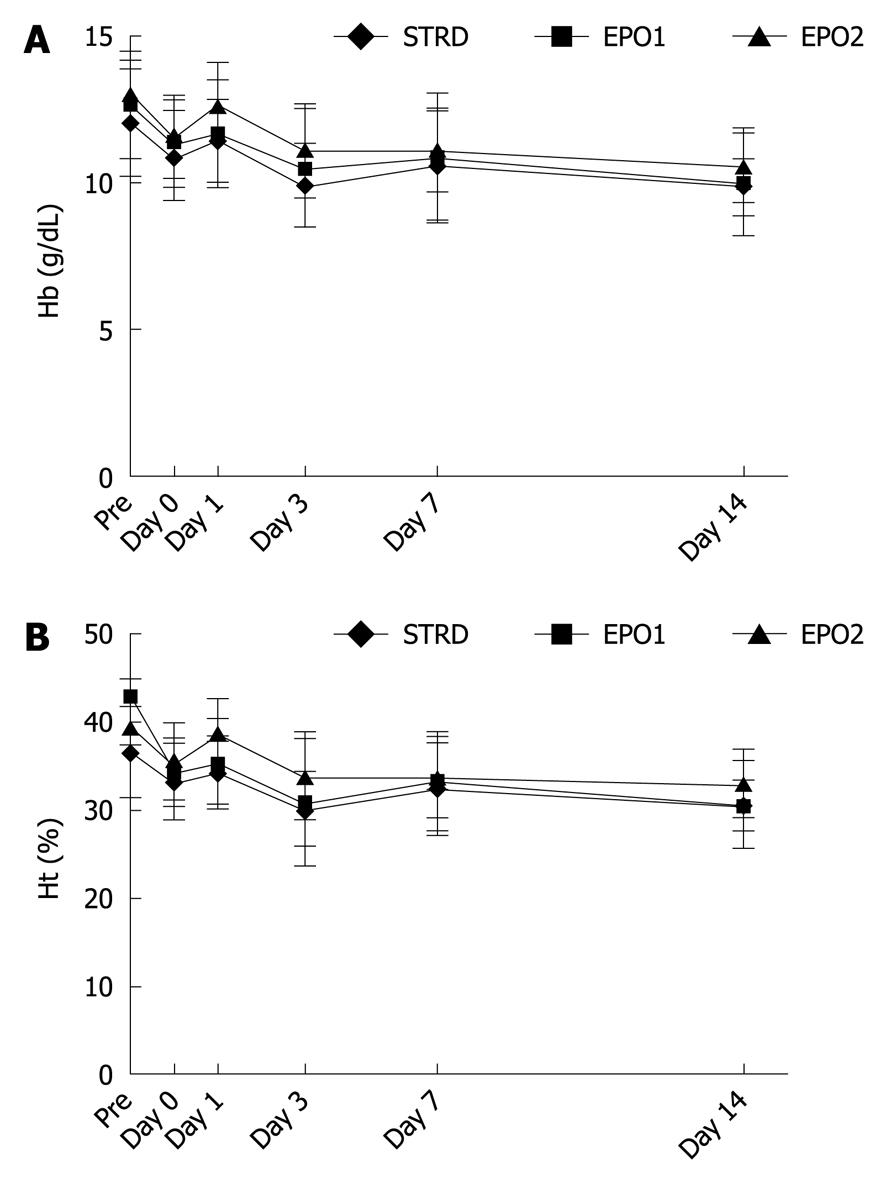
Figure 1 Changes in hemoglobin and hematocrit.
Hemoglobin (Hb) (A) and hematocrit (Ht) (B) did not differ between the three groups until Day 14 (P > 0.05 for Hb and Ht, Kruskal-Wallis test). STRD: Steroid group; EPO: Erythropoietin.
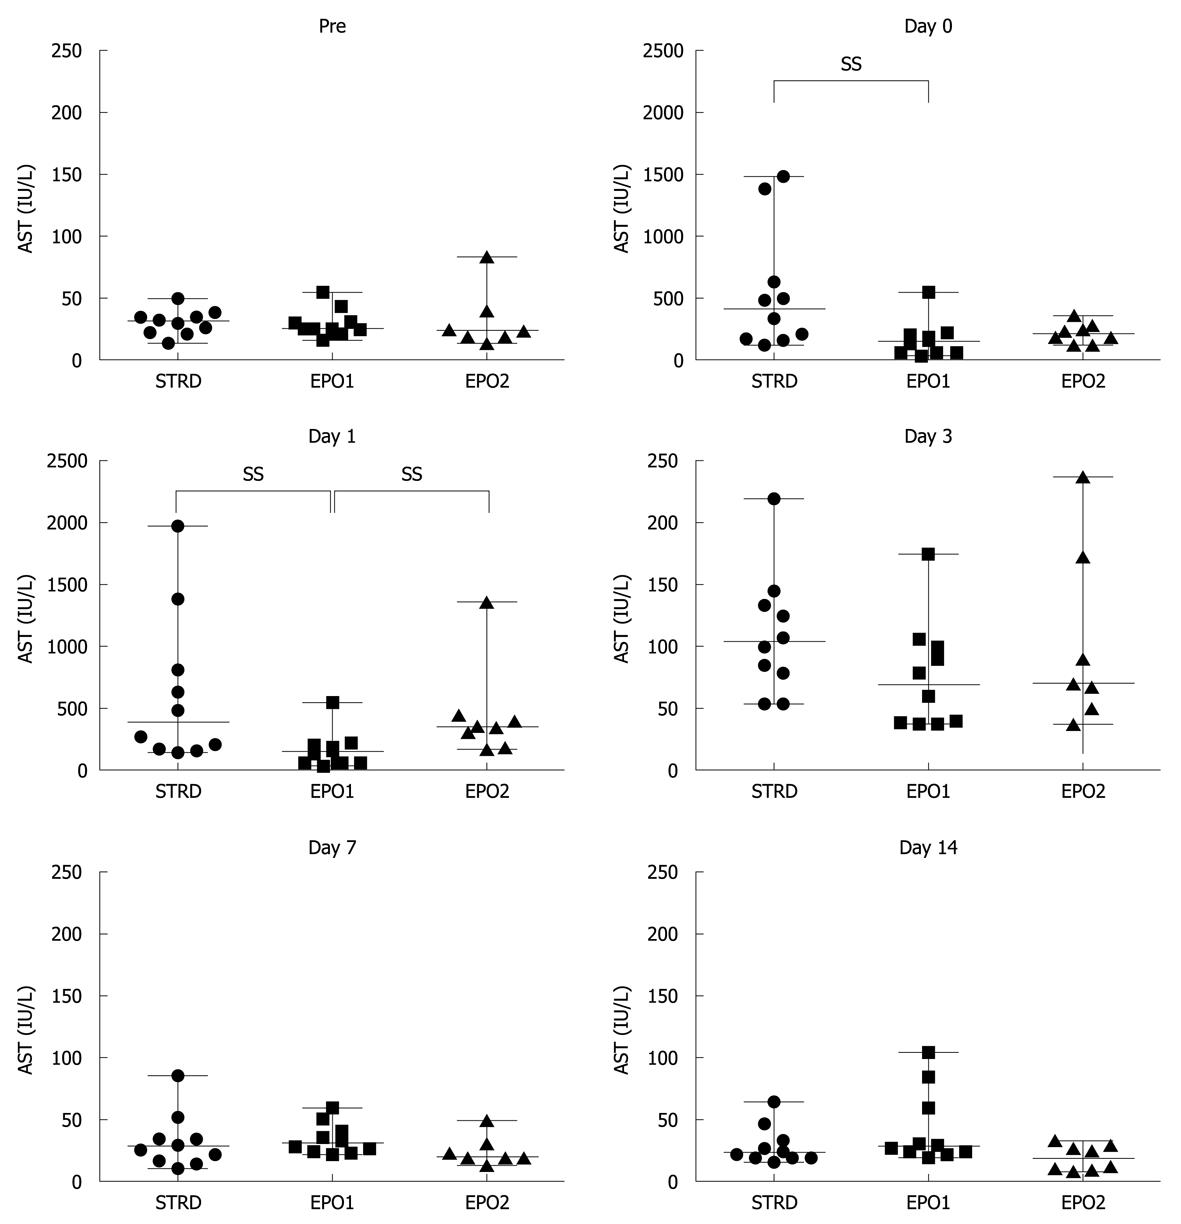
Figure 2 Changes in aspartate aminotransferase.
The aspartate aminotransferase (AST) level in the erythropoietin (EPO)1 group was significantly lower than that in the steroid (STRD) group on Day 0 (P = 0.041, Kruskal-Wallis test), and also significantly lower than that in the STRD and EPO2 groups on Day 1 (P = 0.018, Kruskal-Wallis test). There were no significant differences in the AST level after Day 3. Note that the scale of the Y-axis differs in each graph. SS: Statistically significant.
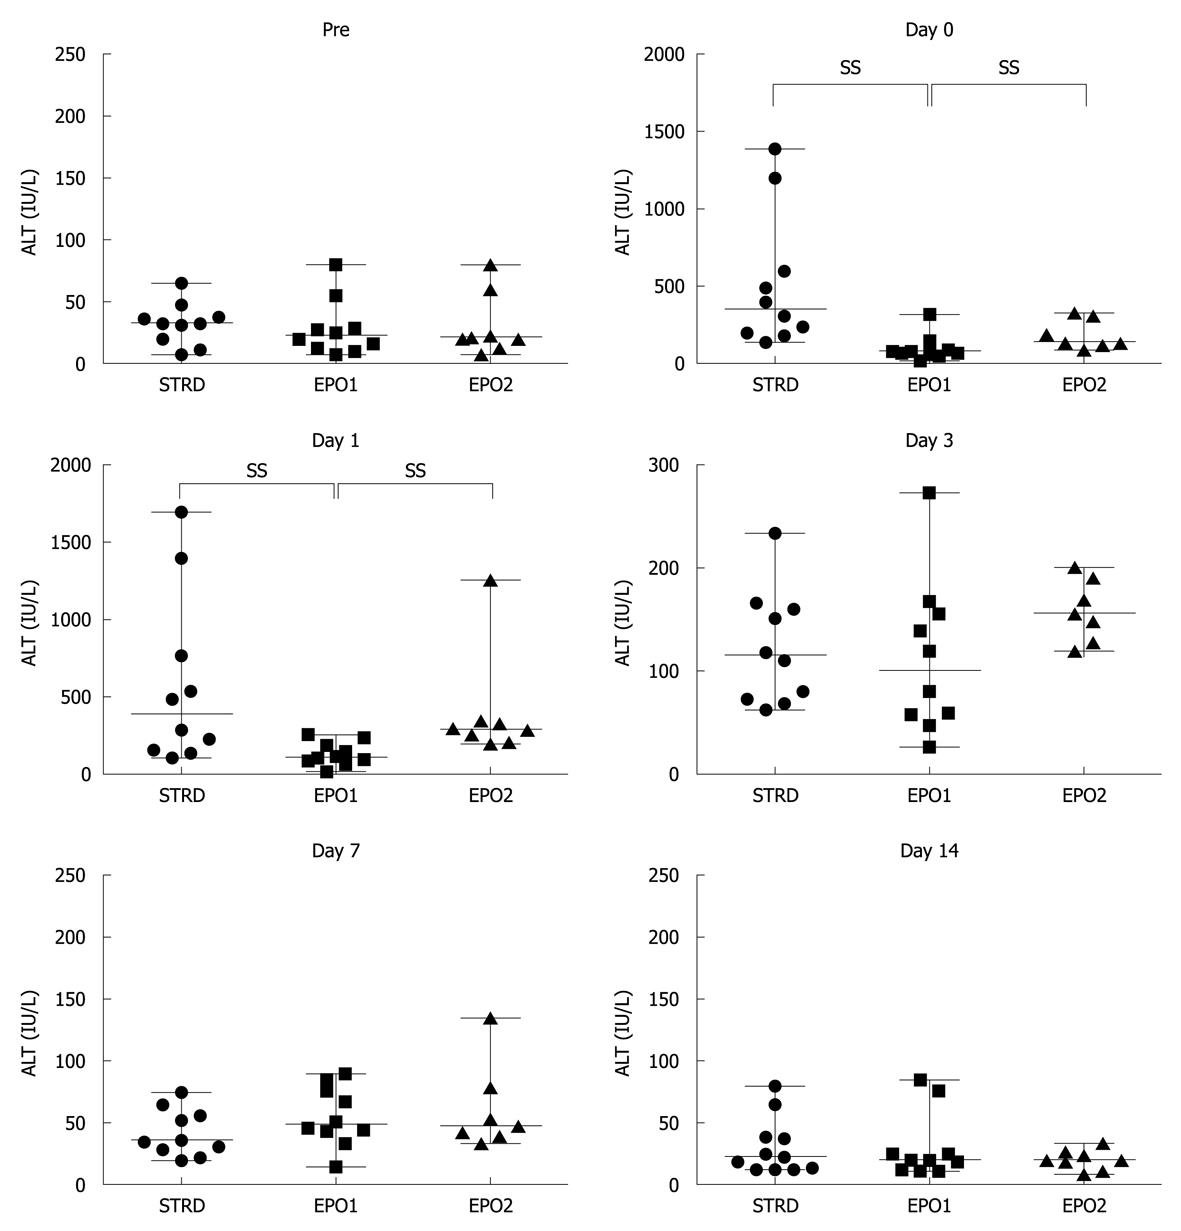
Figure 3 Changes in alanine transaminase.
The alanine transaminase (ALT) level in the erythropoietin (EPO)1 group was significantly lower than that in the steroid (STRD) and EPO2 groups on Day 0 (P = 0.020, Kruskal-Wallis test) and Day 1 (P = 0.004, Kruskal-Wallis test). There were no significant differences in the ALT level after Day 3. Note that the scale of the Y-axis differs in each graph. SS: Statistically significant.
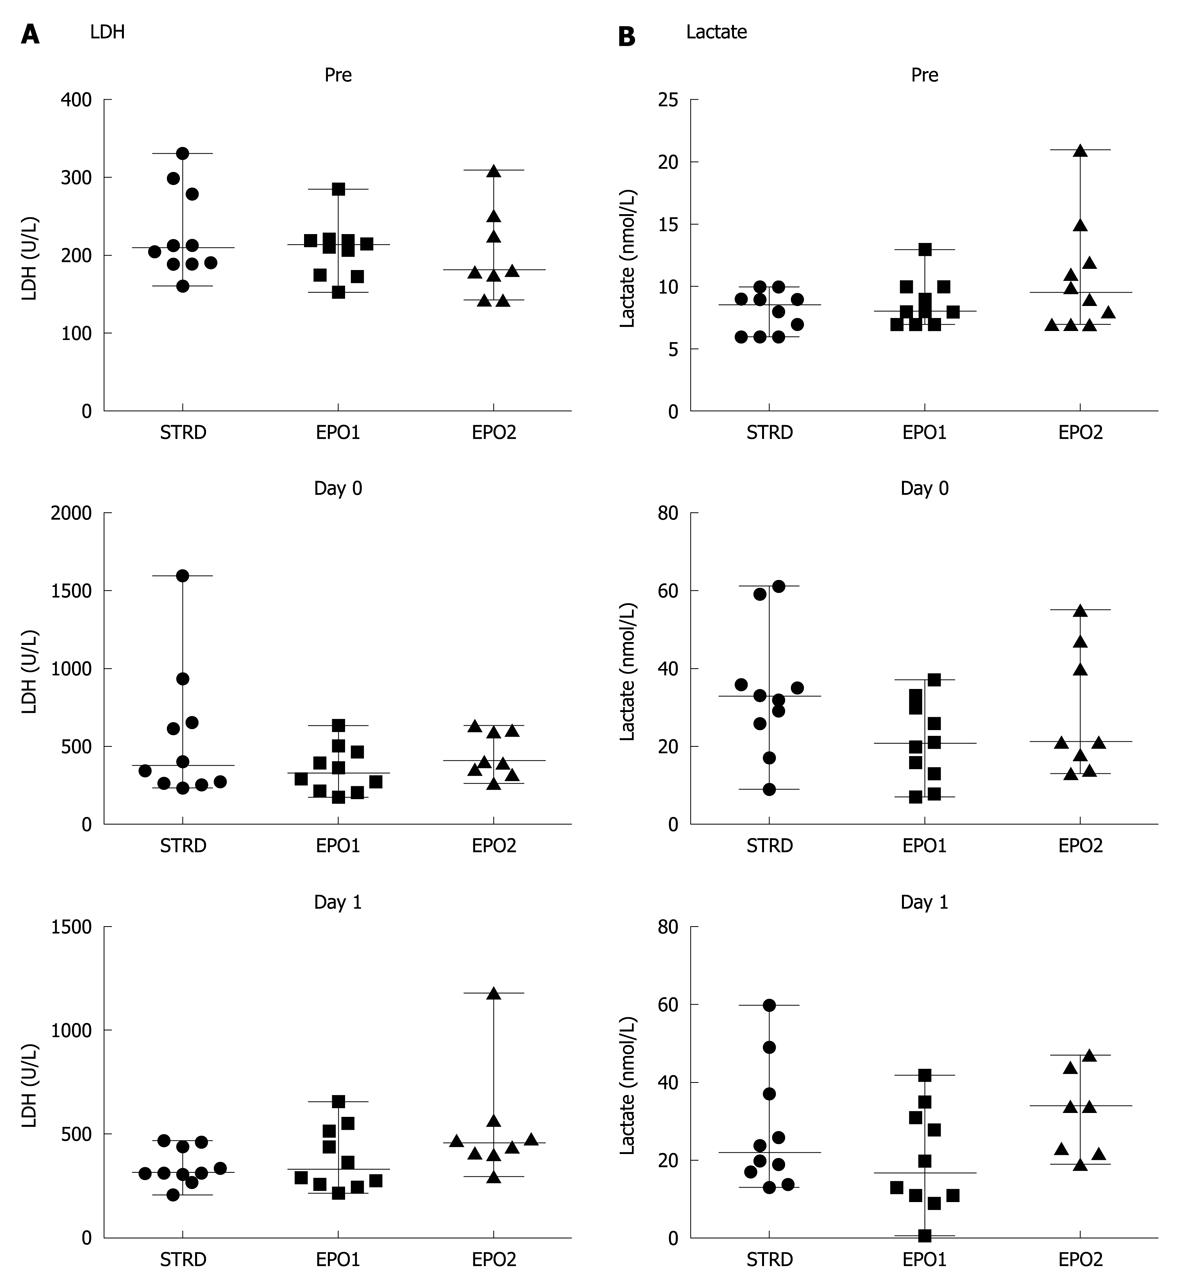
Figure 4 Lactate dehydrogenase (A) and lactate (B) levels at Pre, and on Day 0 and Day 1.
There were no significant differences between the three groups in both lactate dehydrogenase (LDH) and lactate levels. Note that the scale of the Y-axis differs in each graph (P > 0.05 for hemoglobin and hematocrit, Kruskal-Wallis test). STRD: Steroid group; EPO: Erythropoietin.
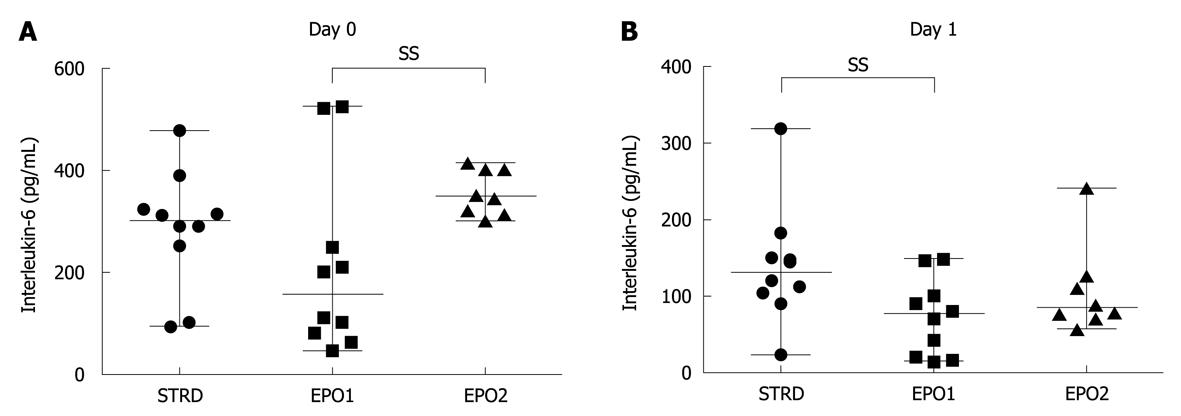
Figure 5 Interleukin-6 level on Day 0 (A) and Day 1 (B).
The interleukin-6 level in the erythropoietin (EPO)1 group was significantly lower than that in the EPO2 group and the steroid (STRD) group on Day 0 (P = 0.0036, Kruskal-Wallis test). Note that the scale of the Y-axis differs in each graph. SS: Statistically significant.
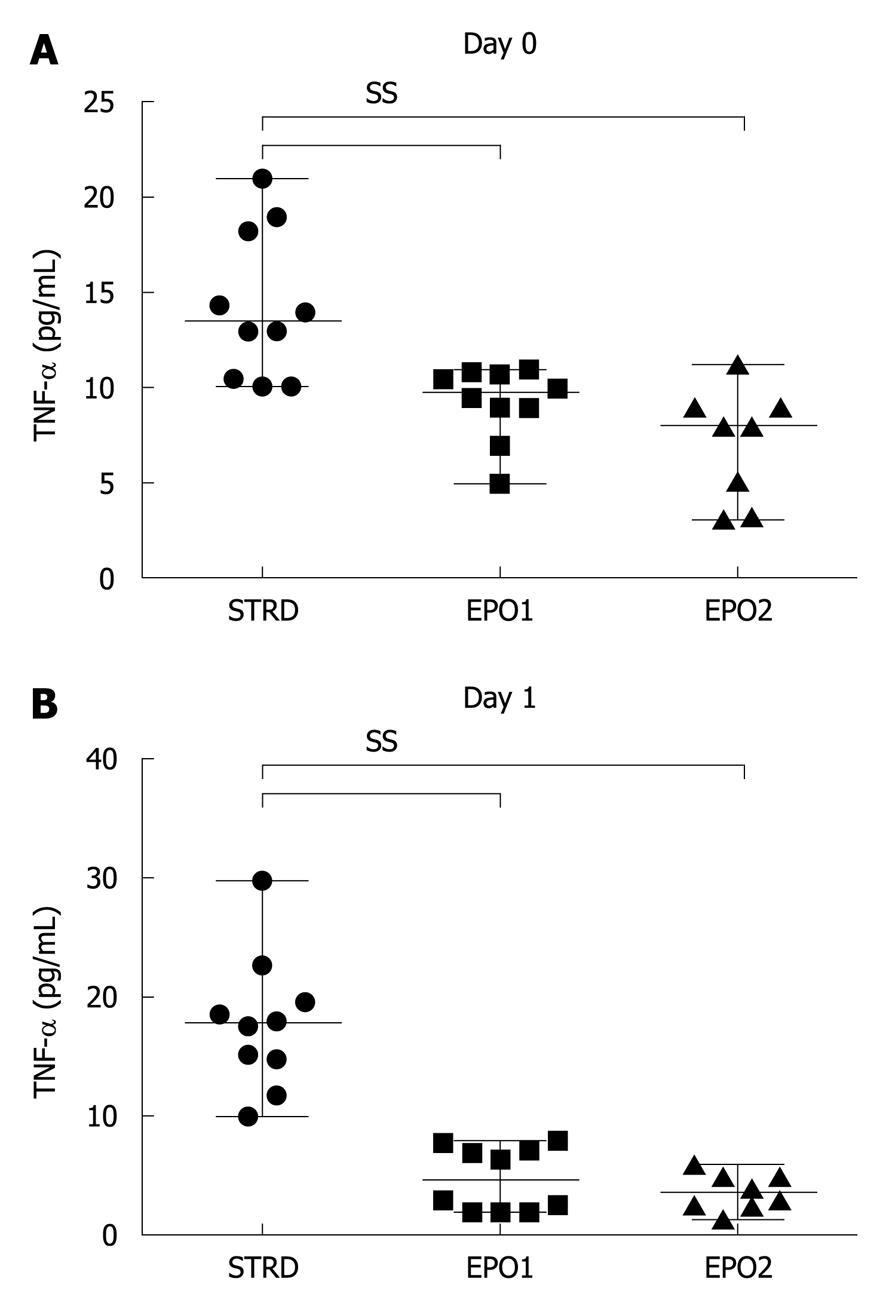
Figure 6 Tumor necrosis factor-α level on Day 0 (A) and Day 1 (B).
Levels of tumor necrosis factor (TNF)-α in the erythropoietin (EPO)1 and EPO2 groups were significantly lower than that in the steroid (STRD) group on both Day 0 (P = 0.0006, Kruskal-Wallis test) and Day 1 (P < 0.0001, Kruskal-Wallis test). Note that the scale of the Y-axis differs in each graph. SS: Statistically significant.
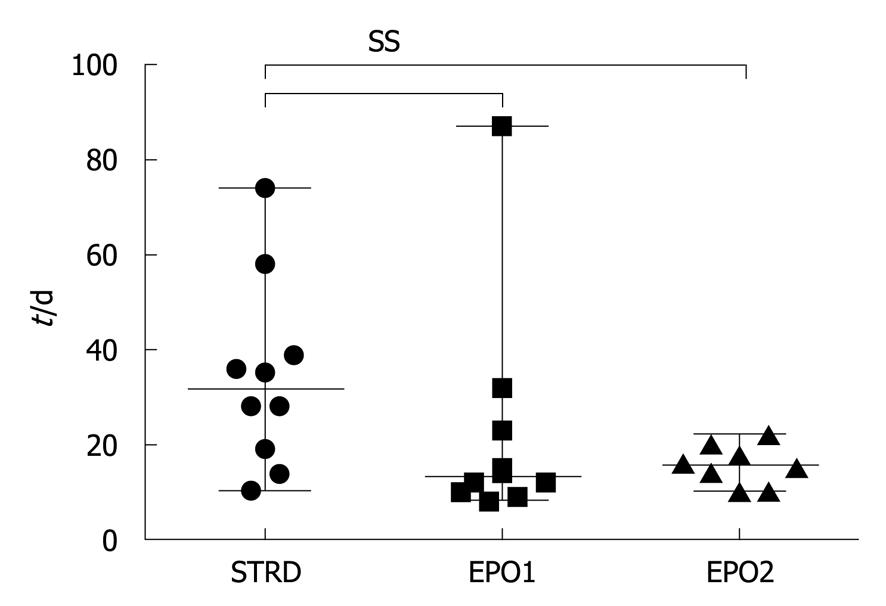
Figure 7 Length of hospitalization.
Hospitalization in the steroid (STRD) group was significantly longer than that in the erythropoietin (EPO)1 and EPO2 groups (P = 0.0463, Kruskal-Wallis test). SS: Statistically significant.
- Citation: Kato M, Sawada T, Kita J, Shimoda M, Kubota K. Erythropoietin ameliorates early ischemia-reperfusion injury following the Pringle maneuver. World J Gastroenterol 2010; 16(38): 4838-4845
- URL: https://www.wjgnet.com/1007-9327/full/v16/i38/4838.htm
- DOI: https://dx.doi.org/10.3748/wjg.v16.i38.4838


