Copyright
©2010 Baishideng.
World J Gastroenterol. Jul 28, 2010; 16(28): 3592-3596
Published online Jul 28, 2010. doi: 10.3748/wjg.v16.i28.3592
Published online Jul 28, 2010. doi: 10.3748/wjg.v16.i28.3592
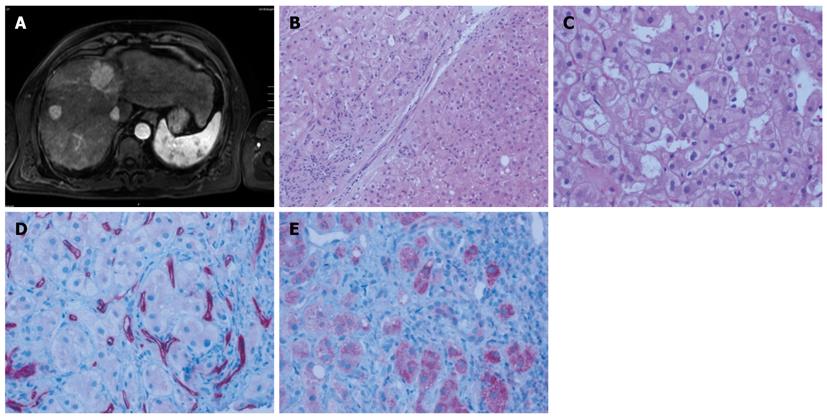
Figure 1 Baseline radiologic and pathologic assessment of the patient in late 2006 before initiation of therapy.
A: Initial magnetic resonance imaging (MRI) scan revealing multiple hepatocellular carcinoma (HCC) nodules; B: Regenerative nodule (lower right) juxtaposed to well circumscribed HCC (upper left) separated by a fibrous septum with a sparse lymphocytic infiltrate (magnification, × 100); C: Representative high power magnification of the HCC showed large tumor cells with occasional vacuoles and microvesicular fatty degeneration of hepatocytes (magnification, × 200); D: Abnormally increased microvessel density within the HCC as demonstrated by CD34 immunohistochemistry (magnification, × 200); E: Tumor cells express VEGFR1 at the tumor front (right) contrasting with weak expression towards to the tumor centre (left; magnification, × 200).
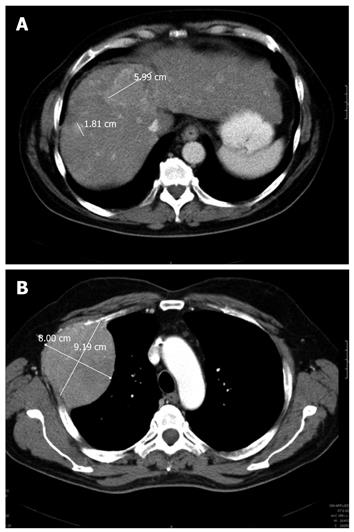
Figure 2 Radiologic assessment of the primary liver tumors and the thoracic metastasis before initiation of sorafenib therapy in September 2007.
A: Multiple hepatocellular carcinoma lesions (maximum diameter 6 cm) in computed tomography scan of the liver; B: Thoracic metastasis of the 2nd rib (maximum diameter 8.00 cm × 9.19 cm).
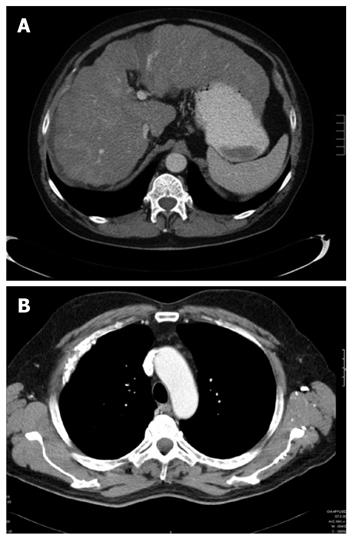
Figure 3 Computed tomography scans of liver (A) and thorax (B) taken in September 2008, 12 mo after initiation of sorafenib therapy showing a dramatic regression of previously described tumor lesions.
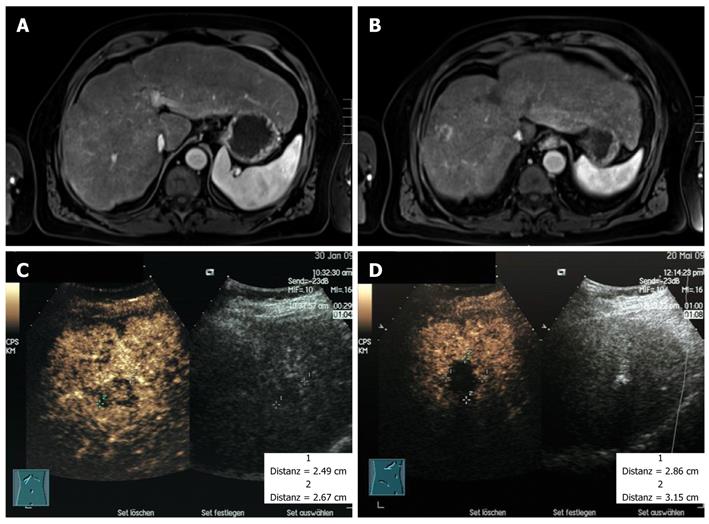
Figure 4 Magnetic resonance imaging scans of the liver in spring 2009, 18 mo after initiation of sorafenib therapy (A, B) and the contrast-enhanced ultrasound investigation of a single calcifying lesion of segment IVa before (C) and after (D) ablation by ultrasound controlled high frequency thermotherapy in spring 2009.
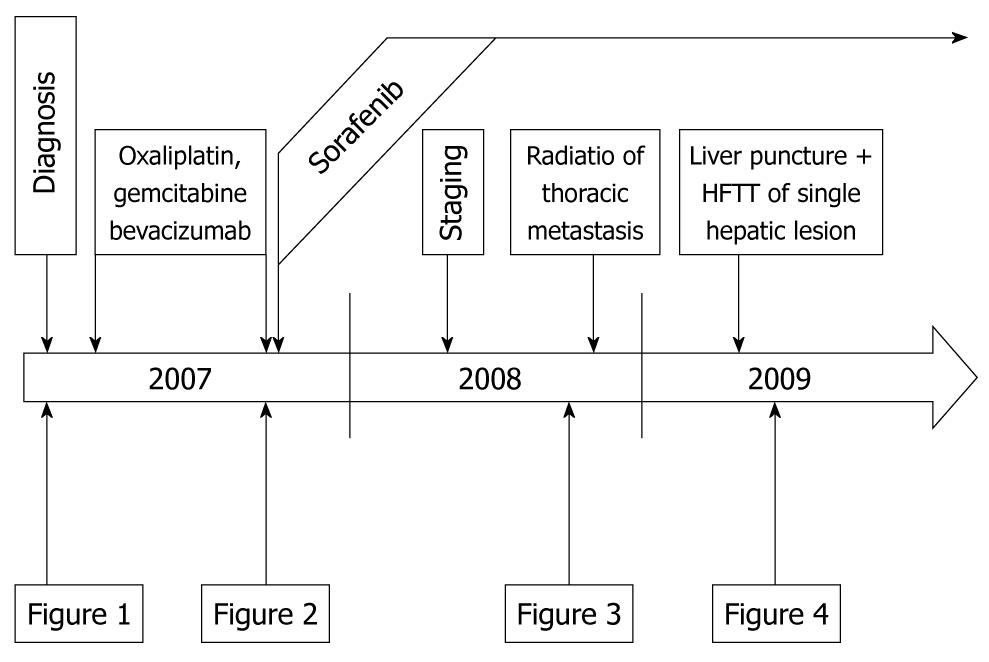
Figure 5 Schematic course of the disease from diagnosis in early 2007 until late 2009 indicating the time points of therapy and staging examinations.
Representative examples are shown in Figures 1 to 4 as indicated here. HFTT: High frequency thermotherapy.
- Citation: Wich C, Agaimy A, Strobel D, Wissniowski TT, Hartmann A, Ocker M. Sustained treatment response of metastatic hepatocellular carcinoma with bevacizumab and sorafenib. World J Gastroenterol 2010; 16(28): 3592-3596
- URL: https://www.wjgnet.com/1007-9327/full/v16/i28/3592.htm
- DOI: https://dx.doi.org/10.3748/wjg.v16.i28.3592


