Copyright
©2010 Baishideng.
World J Gastroenterol. Jul 28, 2010; 16(28): 3521-3528
Published online Jul 28, 2010. doi: 10.3748/wjg.v16.i28.3521
Published online Jul 28, 2010. doi: 10.3748/wjg.v16.i28.3521
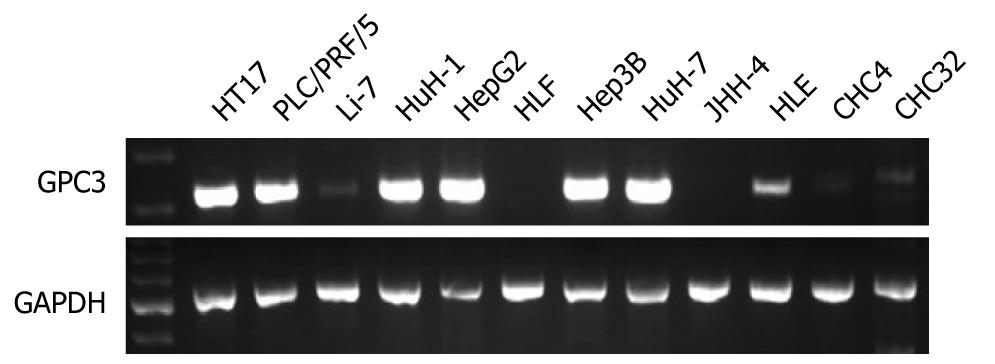
Figure 1 Semiquantitative reverse transcription-polymerase chain reaction analysis of glypican-3 in hepatocellular carcinoma cell lines.
Expression of glypican-3 (GPC3) mRNA was analyzed in hepatocellular carcinoma cell lines by semiquantitative reverse transcription-polymerase chain reaction. GAPDH served as a control.
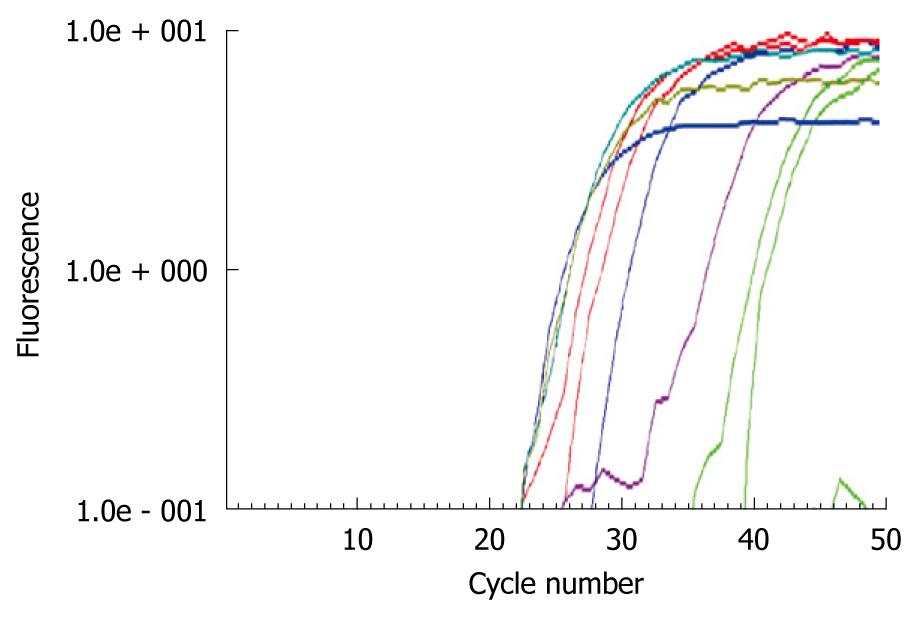
Figure 2 Real time reverse transcription-polymerase chain reaction analysis of glypican-3 in hepatocellular carcinoma cell lines.
cDNA was used for quantitative polymerase chain reaction (PCR). The amount of PCR products was determined by reading the midpoint of the linear portion of the S-shaped real-time curves, called the Ct point or threshold cycle. The Ct refers to the number of cycles it takes a sample to reach a specific fluorescence threshold.
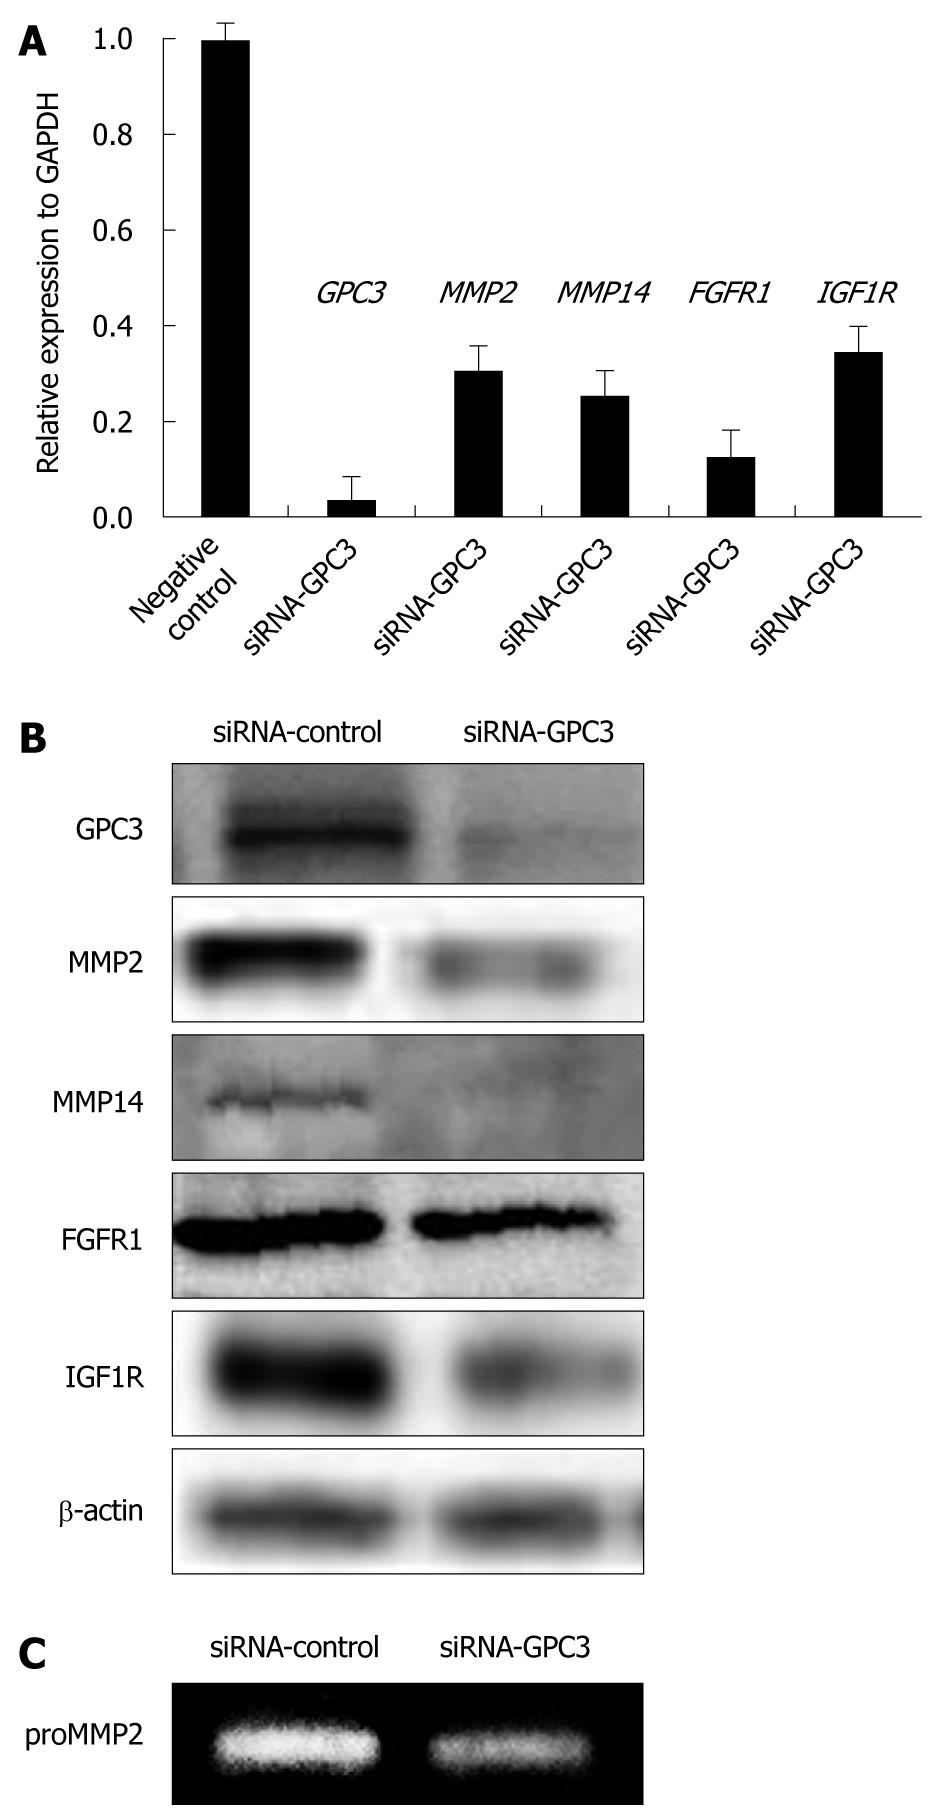
Figure 3 Down-expression of various molecules in glypican-3 siRNA-transfected hepatocellular carcinoma cell line.
A: mRNA levels analyzed by real-time reverse transcription-polymerase chain reaction. The mRNA expressions of matrix metalloproteinase (MMP)2, MMP14, fibroblast growth factor receptor 1 (FGFR1), and insulin-like growth factor 1 receptor (IGF1R) were significantly down-regulated in HepG2 cells treated with glypican-3 (GPC3) specific siRNA (P < 0.05). Bar: SE; B: Protein levels analyzed by immunoblotting. The protein expressions of MMP2, MMP14, FGFR1, and IGF1R were significantly down-regulated in HepG2 cells treated with GPC3 specific siRNA; C: MMP2 activity analyzed by gelatin zymography. Conditioned media of siRNA-transfected HepG2 were used for gelatin zymography.
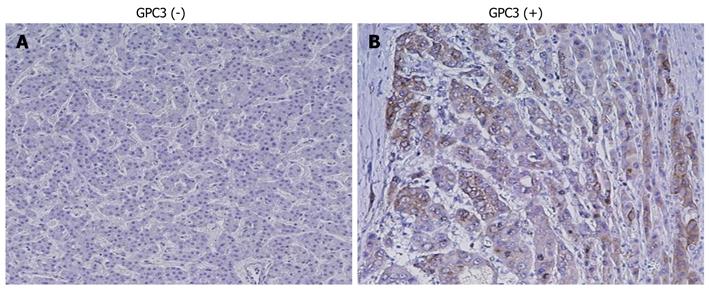
Figure 4 Immunohistochemistry for glypican-3 in liver tissue.
A: Normal liver negative for glypican-3 (GPC3); B: Hepatocellular carcinoma positive for GPC3. Original magnification, × 200. Expression of GPC3 was immunohistochemically analyzed with an anti-human GPC3 mouse monoclonal antibody. GPC3 protein was expressed in the cytoplasm and/or membrane of carcinoma cells.
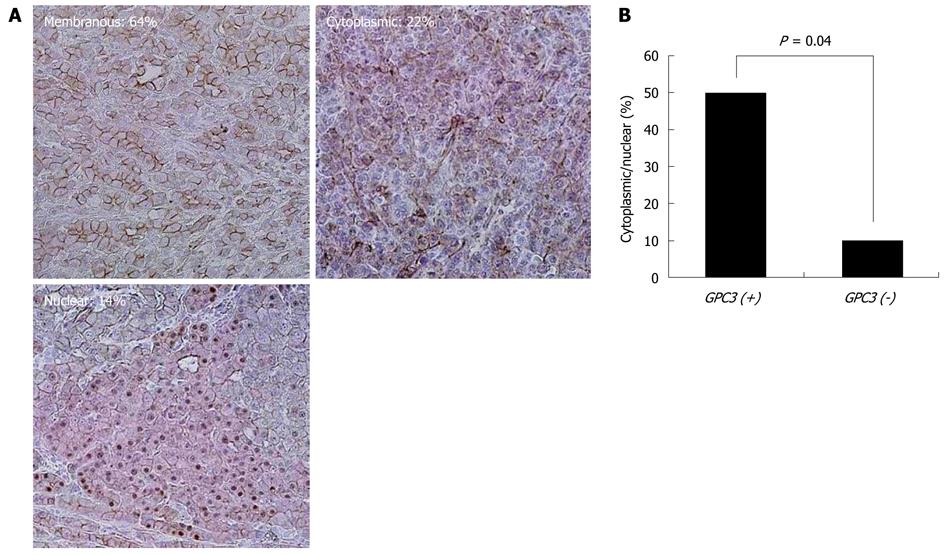
Figure 5 Immunohistochemistry for β-catenin in hepatocellular carcinoma tissue.
A: Membrane staining, cytoplasmic staining, nuclear staining of β-catenin. Expression of β-catenin was immunohistochemically analyzed with an anti-human β-catenin monoclonal antibody. Original magnification, × 200; B: Association of nuclear/cytoplasmic localization of β-catenin with glypican-3 (GPC3) expression.
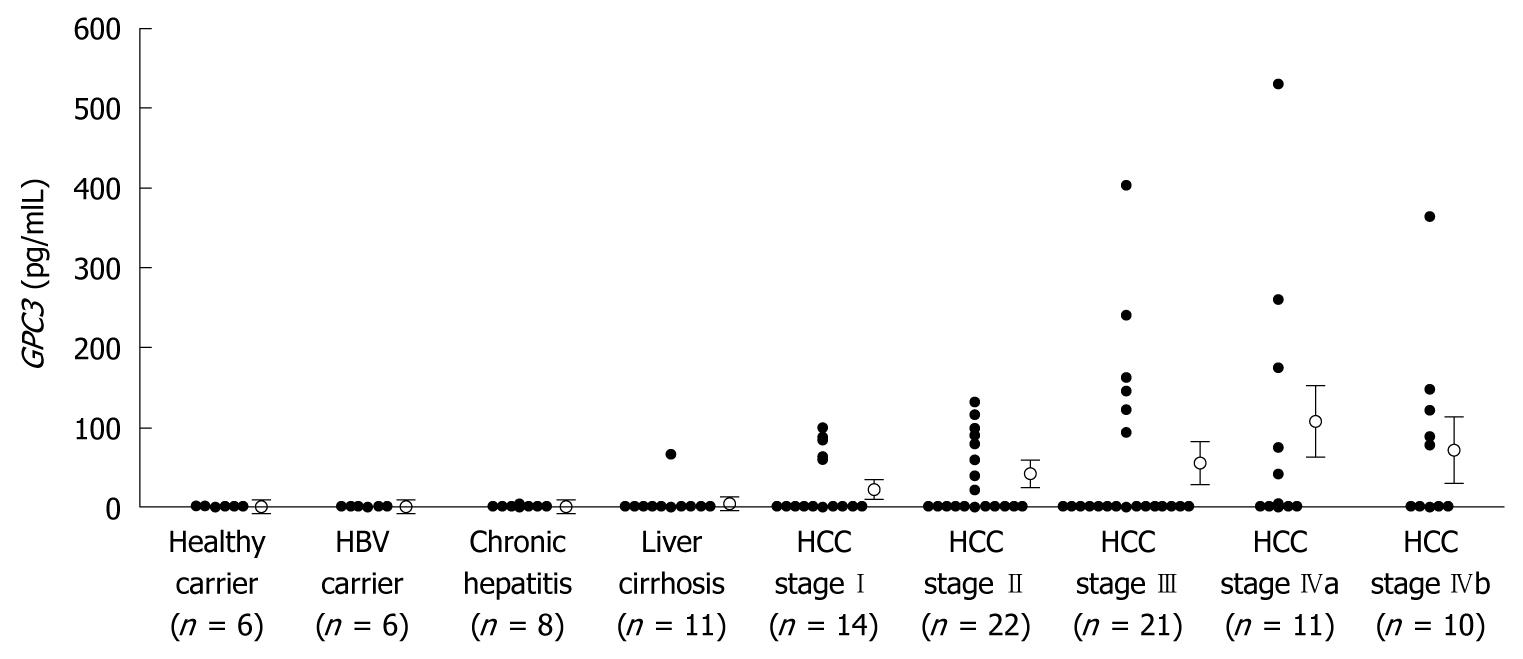
Figure 6 Serum glypican-3 levels.
Serum glypican-3 (GPC3) levels were measured using a commercially available sandwich ELISA kit. Bar: Standard error. Serum GPC3 levels were significantly higher in patients with hepatocellular carcinoma (HCC) than in non-HCC subjects (P < 0.05). HBV: Hepatitis B virus.
Figure 7 Associations of glypican-3 expression with matrix metalloproteinases and growth signaling molecules in hepatocellular carcinoma.
A summary diagram is shown. MMPs: Matrix metalloproteinases; SULF2: Sulfatase 2; GPC3: Glypican-3; FGF: Fibroblast growth factor; IGF: Insulin-like growth factor.
- Citation: Akutsu N, Yamamoto H, Sasaki S, Taniguchi H, Arimura Y, Imai K, Shinomura Y. Association of glypican-3 expression with growth signaling molecules in hepatocellular carcinoma. World J Gastroenterol 2010; 16(28): 3521-3528
- URL: https://www.wjgnet.com/1007-9327/full/v16/i28/3521.htm
- DOI: https://dx.doi.org/10.3748/wjg.v16.i28.3521


