Copyright
©2010 Baishideng.
World J Gastroenterol. Jun 28, 2010; 16(24): 3002-3010
Published online Jun 28, 2010. doi: 10.3748/wjg.v16.i24.3002
Published online Jun 28, 2010. doi: 10.3748/wjg.v16.i24.3002
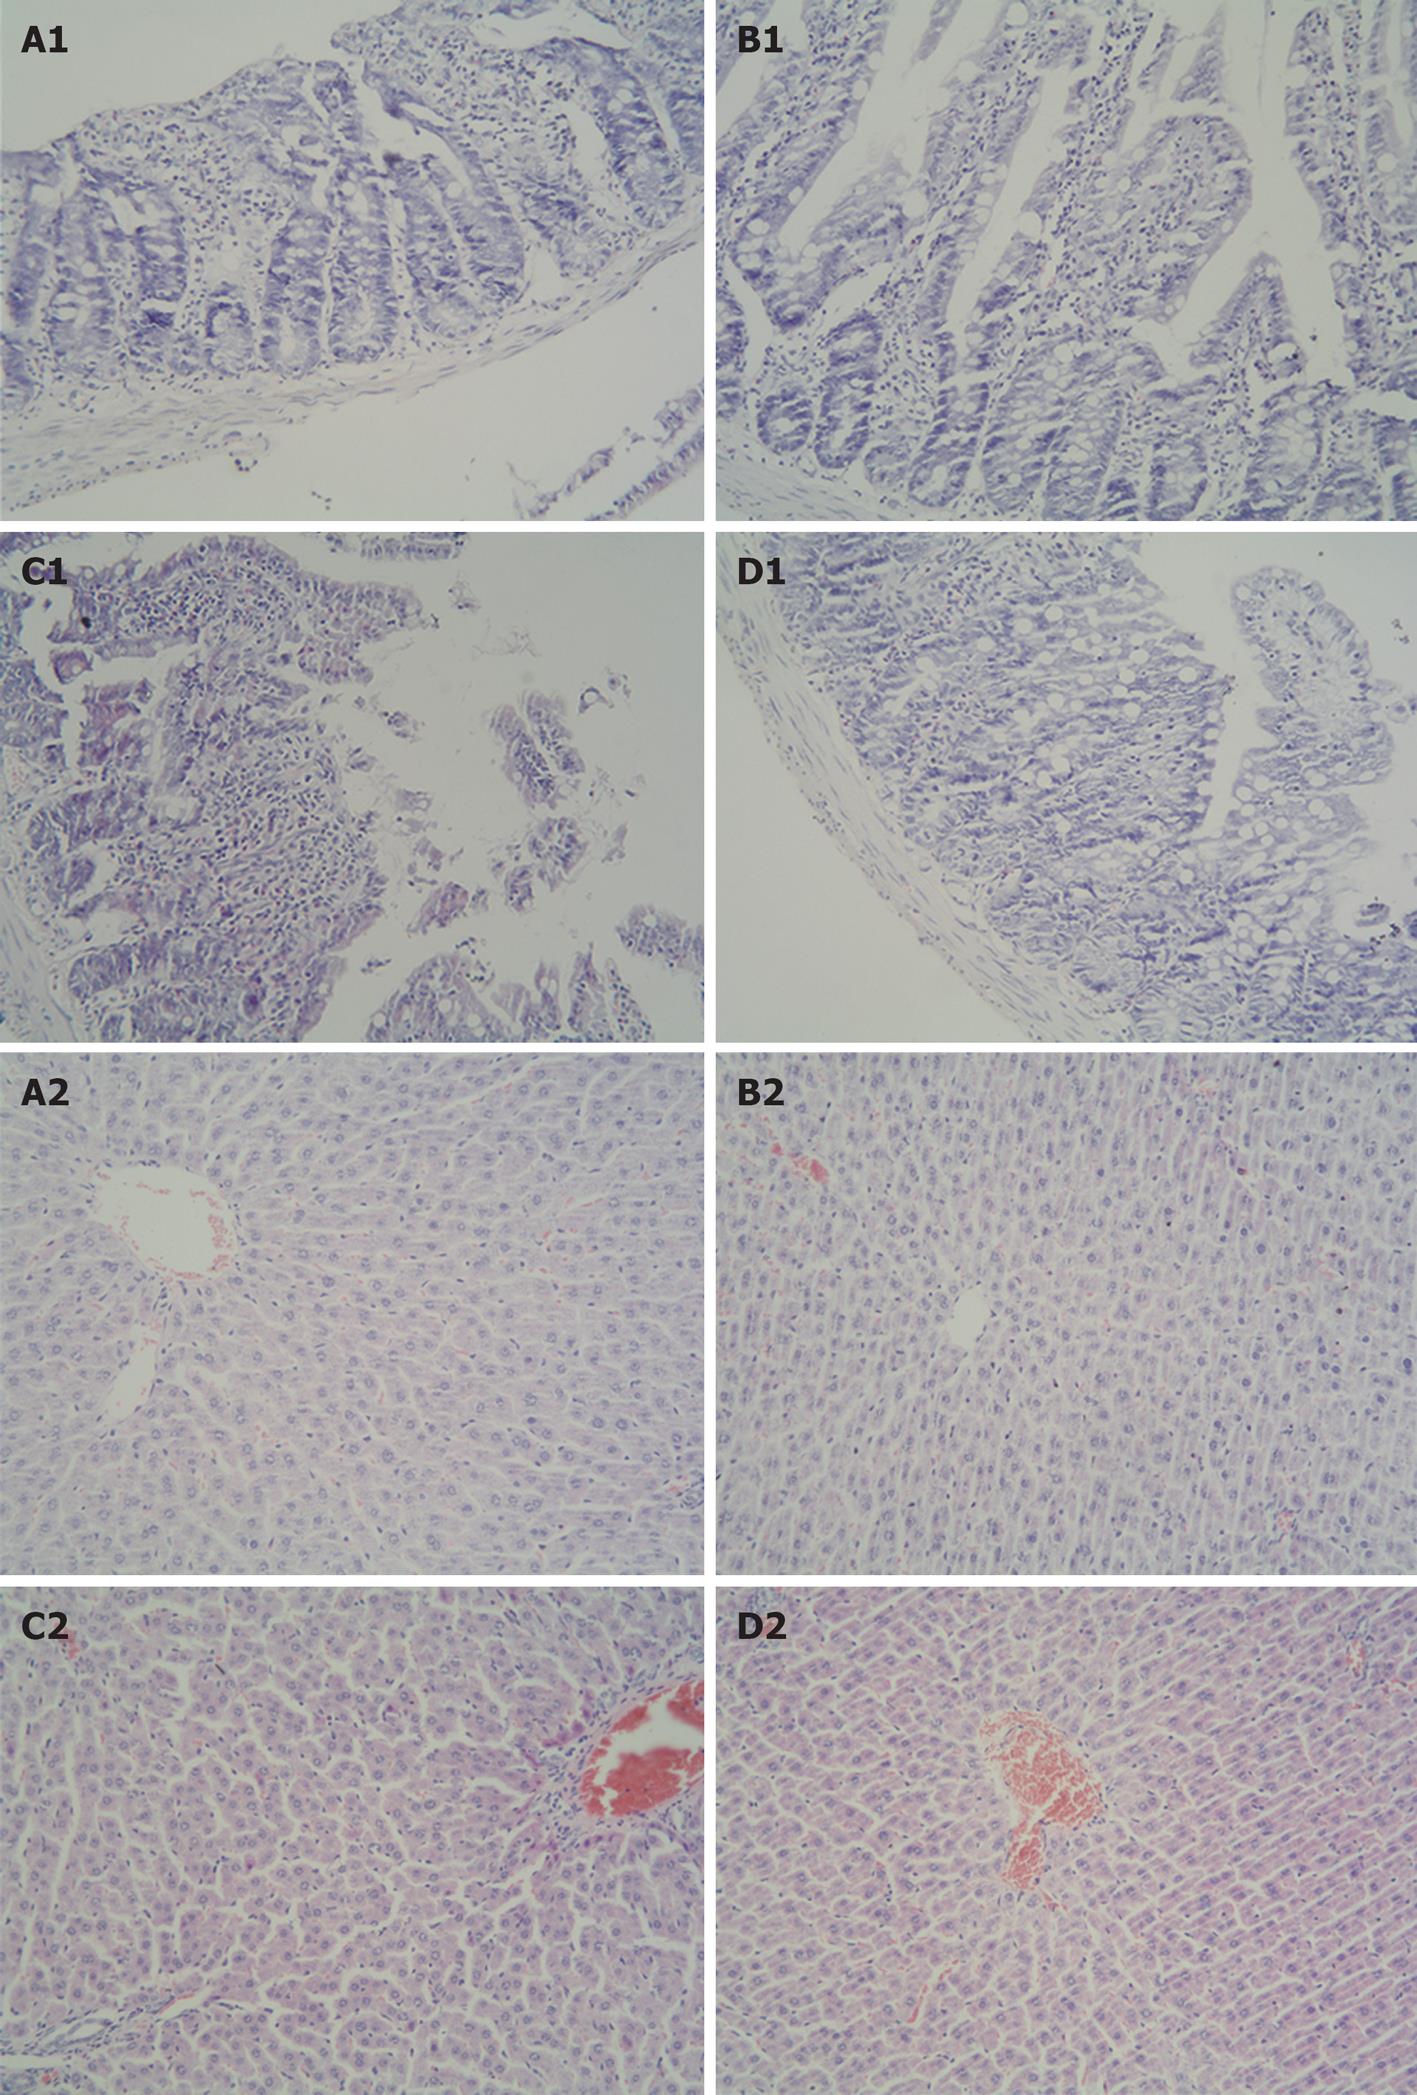
Figure 1 Changes in histology of intestine (A1-D1) and liver (A2-D2) tissues (HE stain, × 200) in the control (A), sulforaphane (SFN) control (B), intestinal ischemia/reperfusion (I/R) (C) (1 h ischemia and 2 h reperfusion) and SFN pretreatment (D) groups.
A, B: Normal structure of intestine and liver; C: Edema, hemorrhage and neutrophil infiltration were observed in intestinal mucosa and liver tissue; D: Relatively normal histology of intestine and liver with less inflammatory cell infiltration.
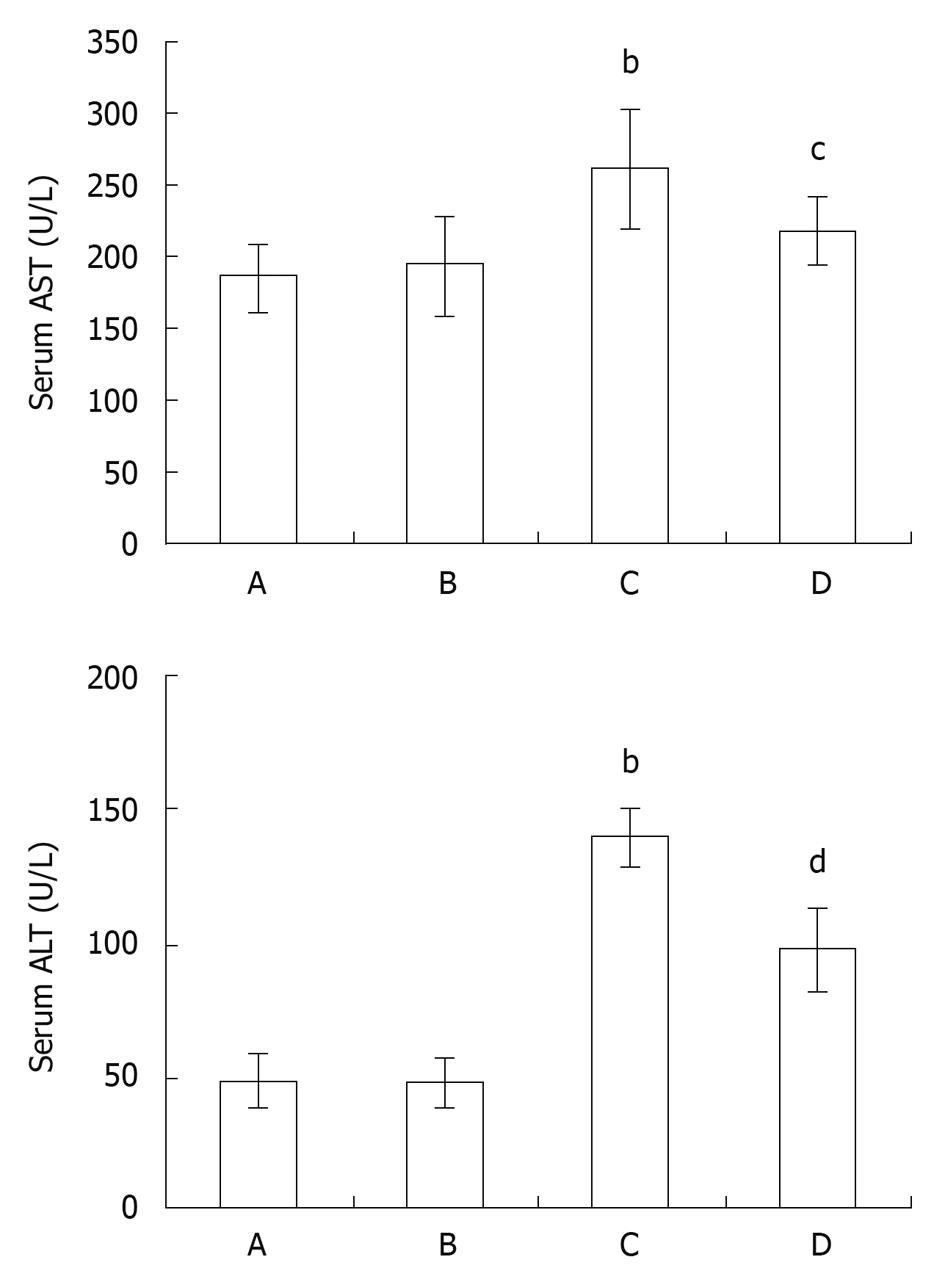
Figure 2 Serum aspartate aminotransferase (AST) and alanine aminotransferase (ALT) (mean ± SD, U/L) levels in the control (A), SFN control (B), intestinal I/R (C) (1 h ischemia and 2 h reperfusion) and SFN pretreatment (D) groups.
bP < 0.01 vs control group; cP < 0.05, dP < 0.01 vs intestinal I/R group.
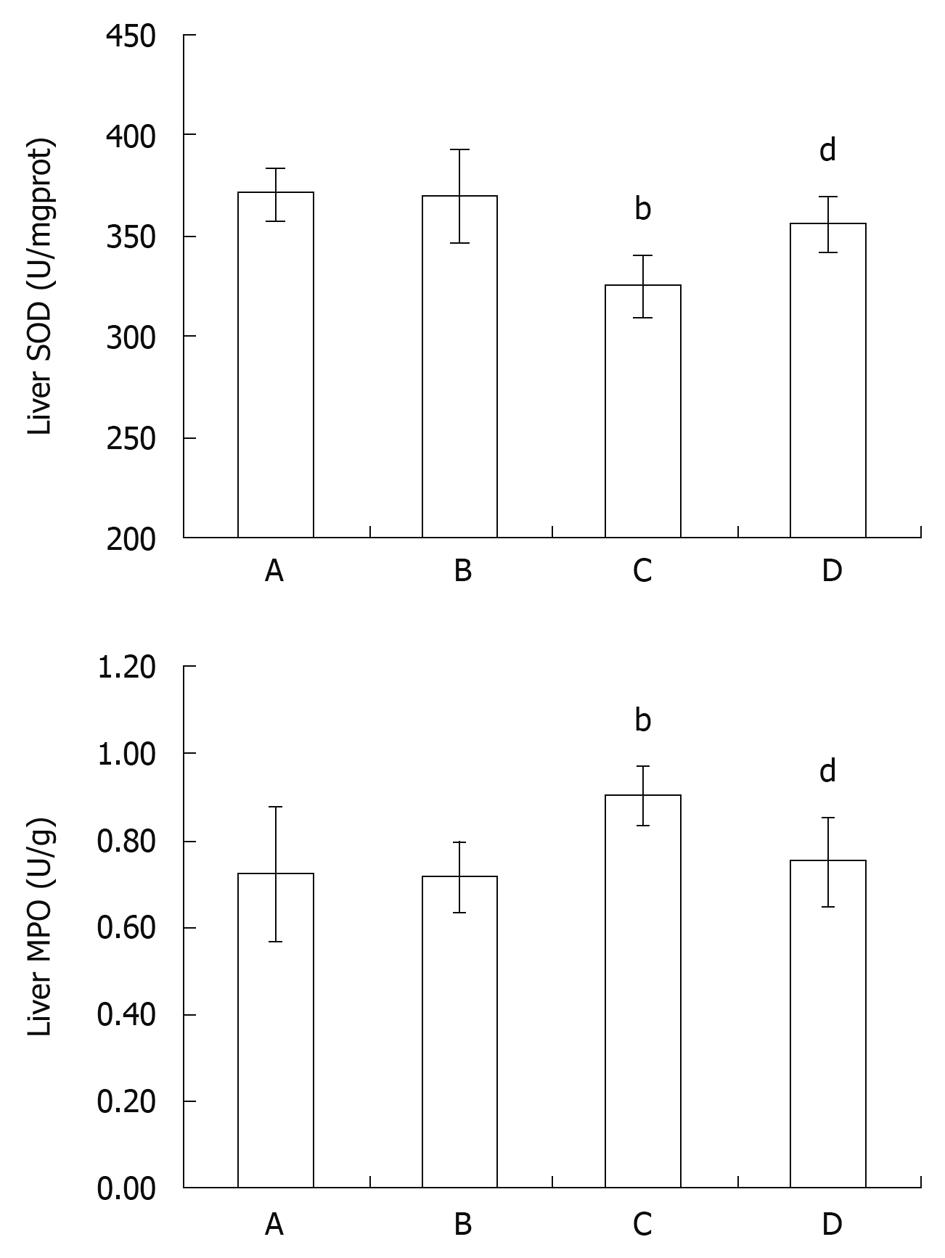
Figure 3 Liver tissue superoxide dismutase (SOD) (mean ± SD, U/mgprot) and myeloperoxidase (MPO) (mean ± SD, U/g) level in the control (A), SFN control (B), intestinal I/R (C) (1 h ischemia and 2 h reperfusion) and SFN pretreatment (D) groups.
bP < 0.01 vs control group; dP < 0.01 vs intestinal I/R group.
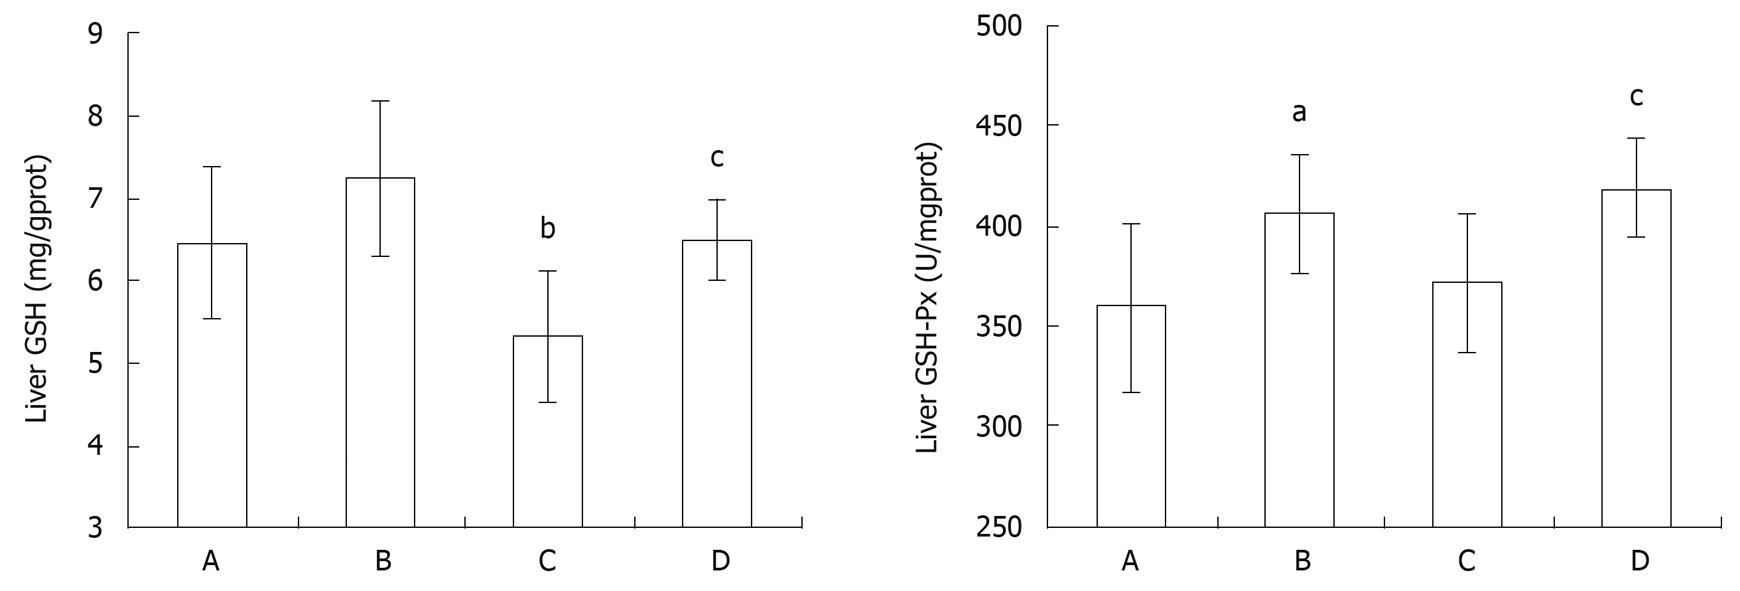
Figure 4 Liver tissue glutathione (GSH) and glutathione peroxidase (GSH-Px) (mean ± SD, U/gprot) level in the control (A), SFN control (B), intestinal I/R (C) (1 h ischemia and 2 h reperfusion) and SFN pretreatment (D) groups.
aP < 0.05, bP < 0.01 vs control group; cP < 0.05 vs intestinal I/R group.
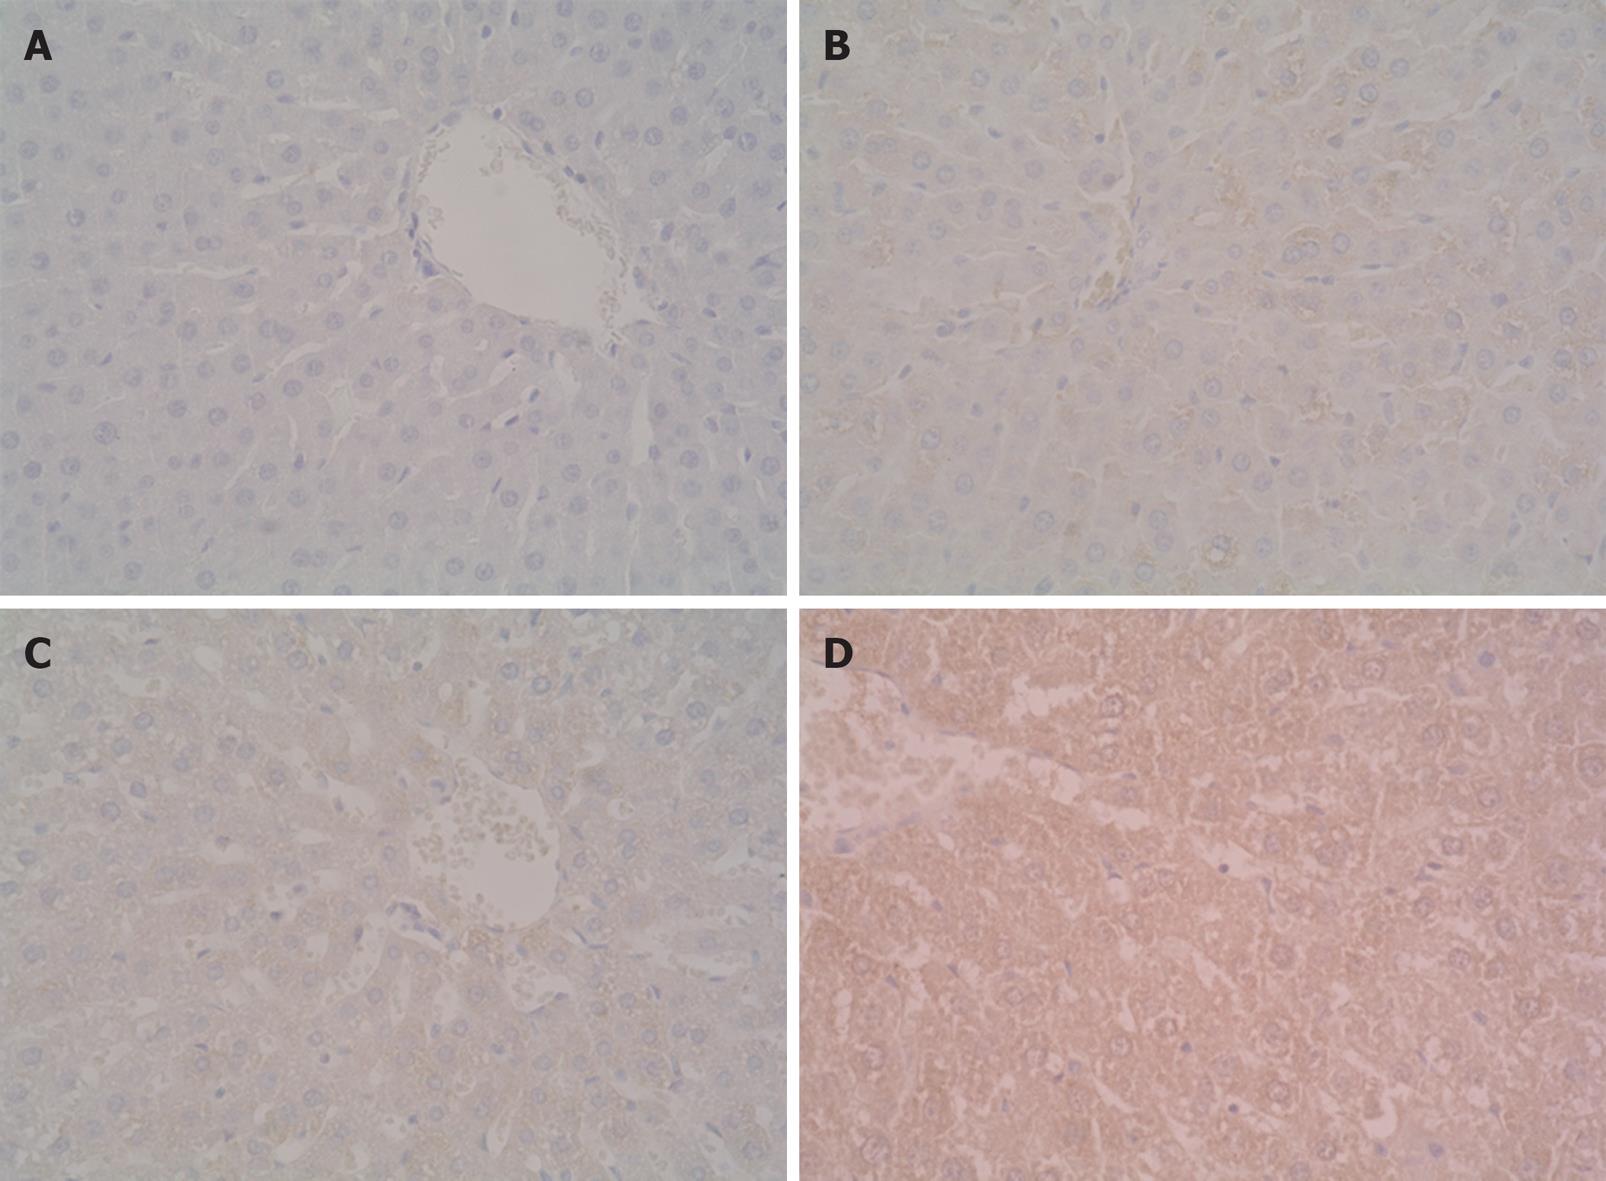
Figure 5 Immunohistochemical staining of liver NF-E2-related factor-2 (Nrf2) expression (original magnification × 400) in the control (A), SFN control (B), intestinal I/R (C) (1 h ischemia and 2 h reperfusion) and SFN pretreatment (D) groups.
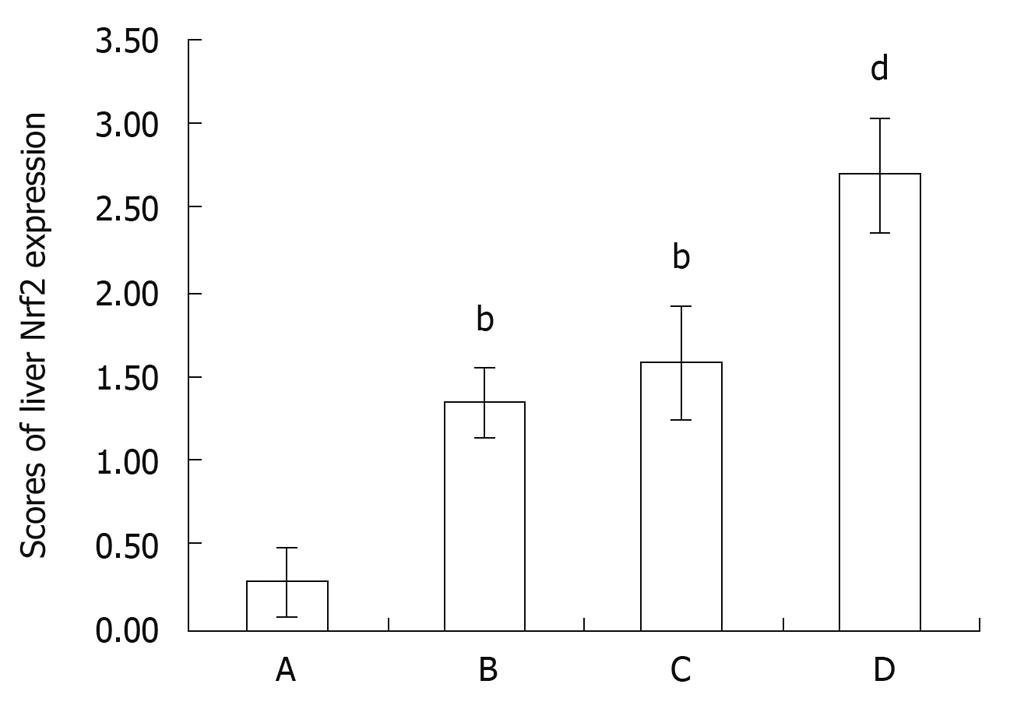
Figure 6 Immunohistochemical results (semi-quantitative analysis) of liver Nrf2 expression in the control (A), SFN control (B), intestinal I/R (C) (1 h ischemia and 2 h reperfusion) and SFN pretreatment (D) groups.
Data are presented as mean ± SD of eight animals. bP < 0.01 vs control group; dP < 0.01 vs intestinal I/R group.
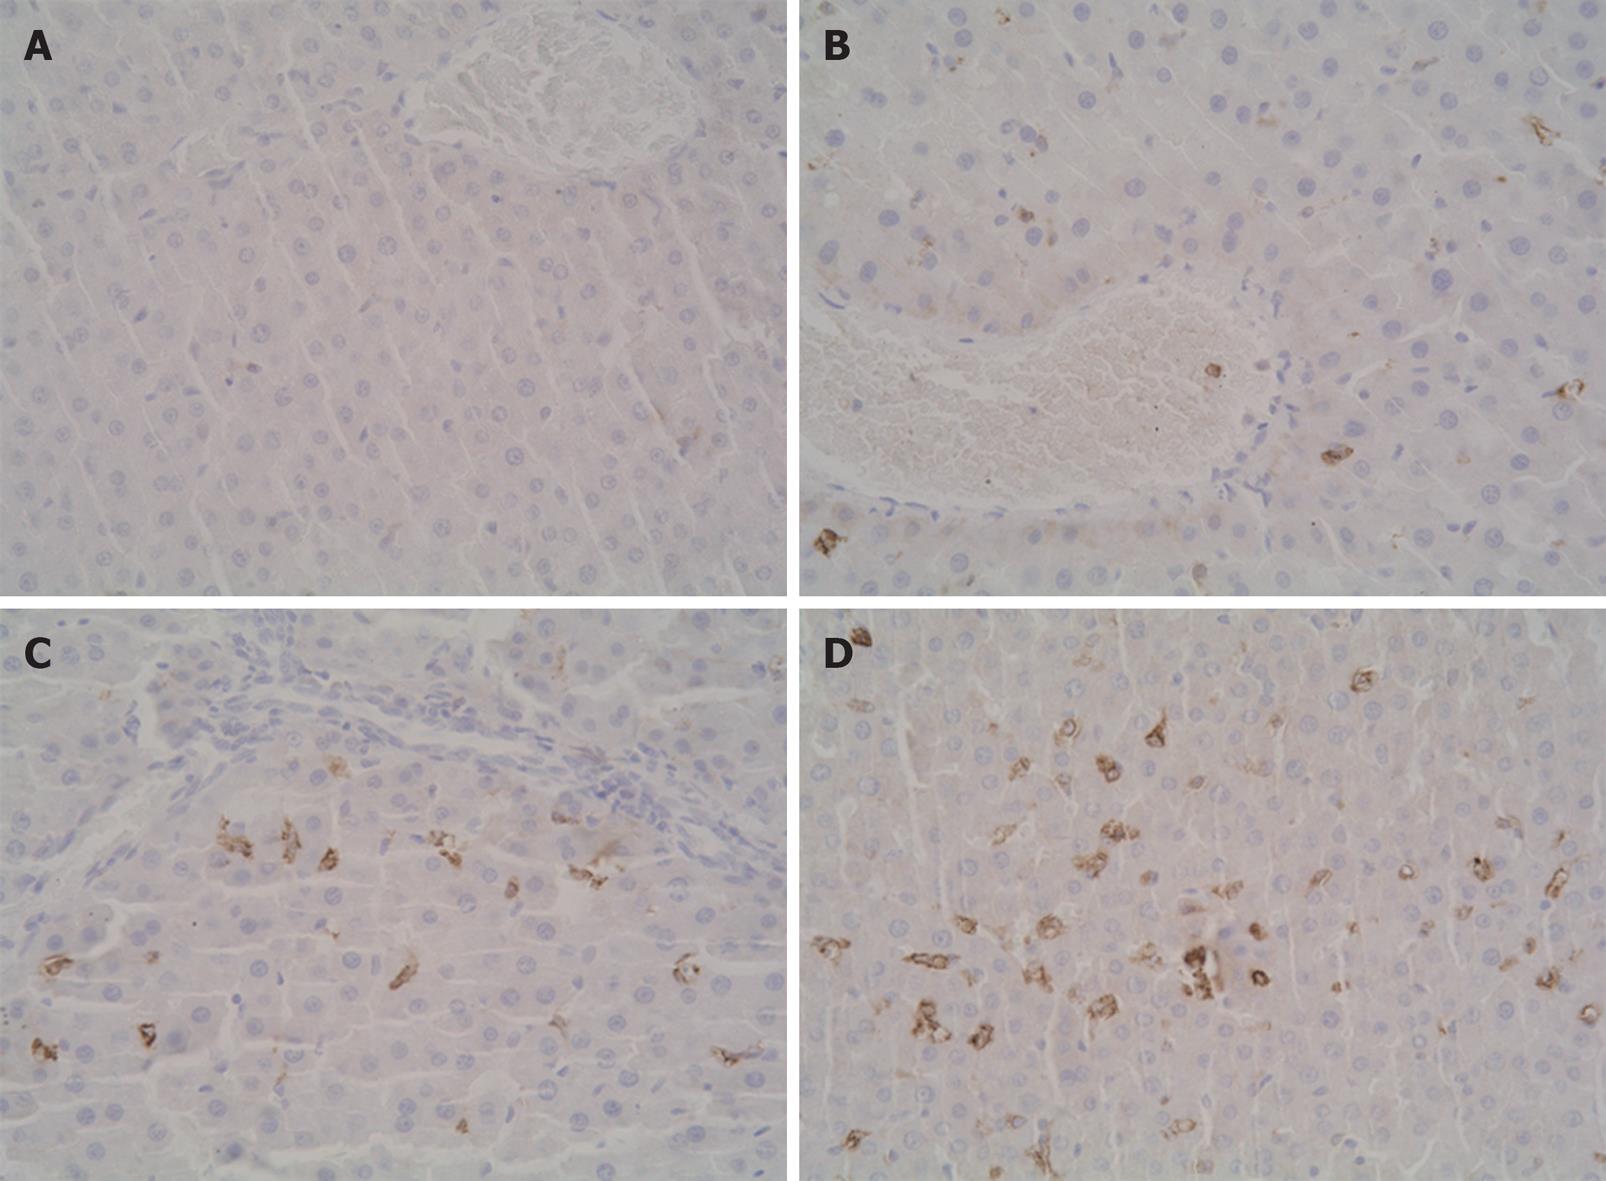
Figure 7 Immunohistochemical staining of liver heme oxygenase-1 (HO-1) expression (original magnification × 400) in the control (A), SFN control (B), intestinal I/R (C) (1 h ischemia and 2 h reperfusion) and SFN pretreatment (D) groups.
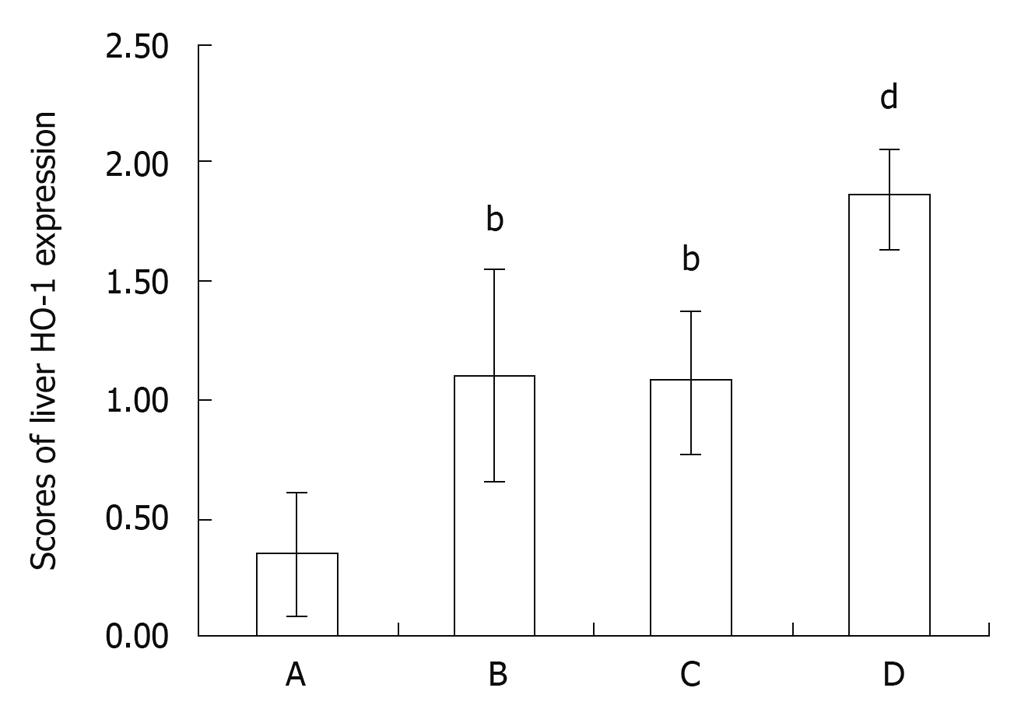
Figure 8 Immunohistochemical results (semi-quantitative analysis) of liver HO-1 expression in the control (A), SFN control (B), intestinal I/R (C) (1 h ischemia and 2 h reperfusion) and SFN pretreatment (D) groups.
Data are presented as mean ± SD of eight animals. bP < 0.01 vs control group; dP < 0.01 vs intestinal I/R group.
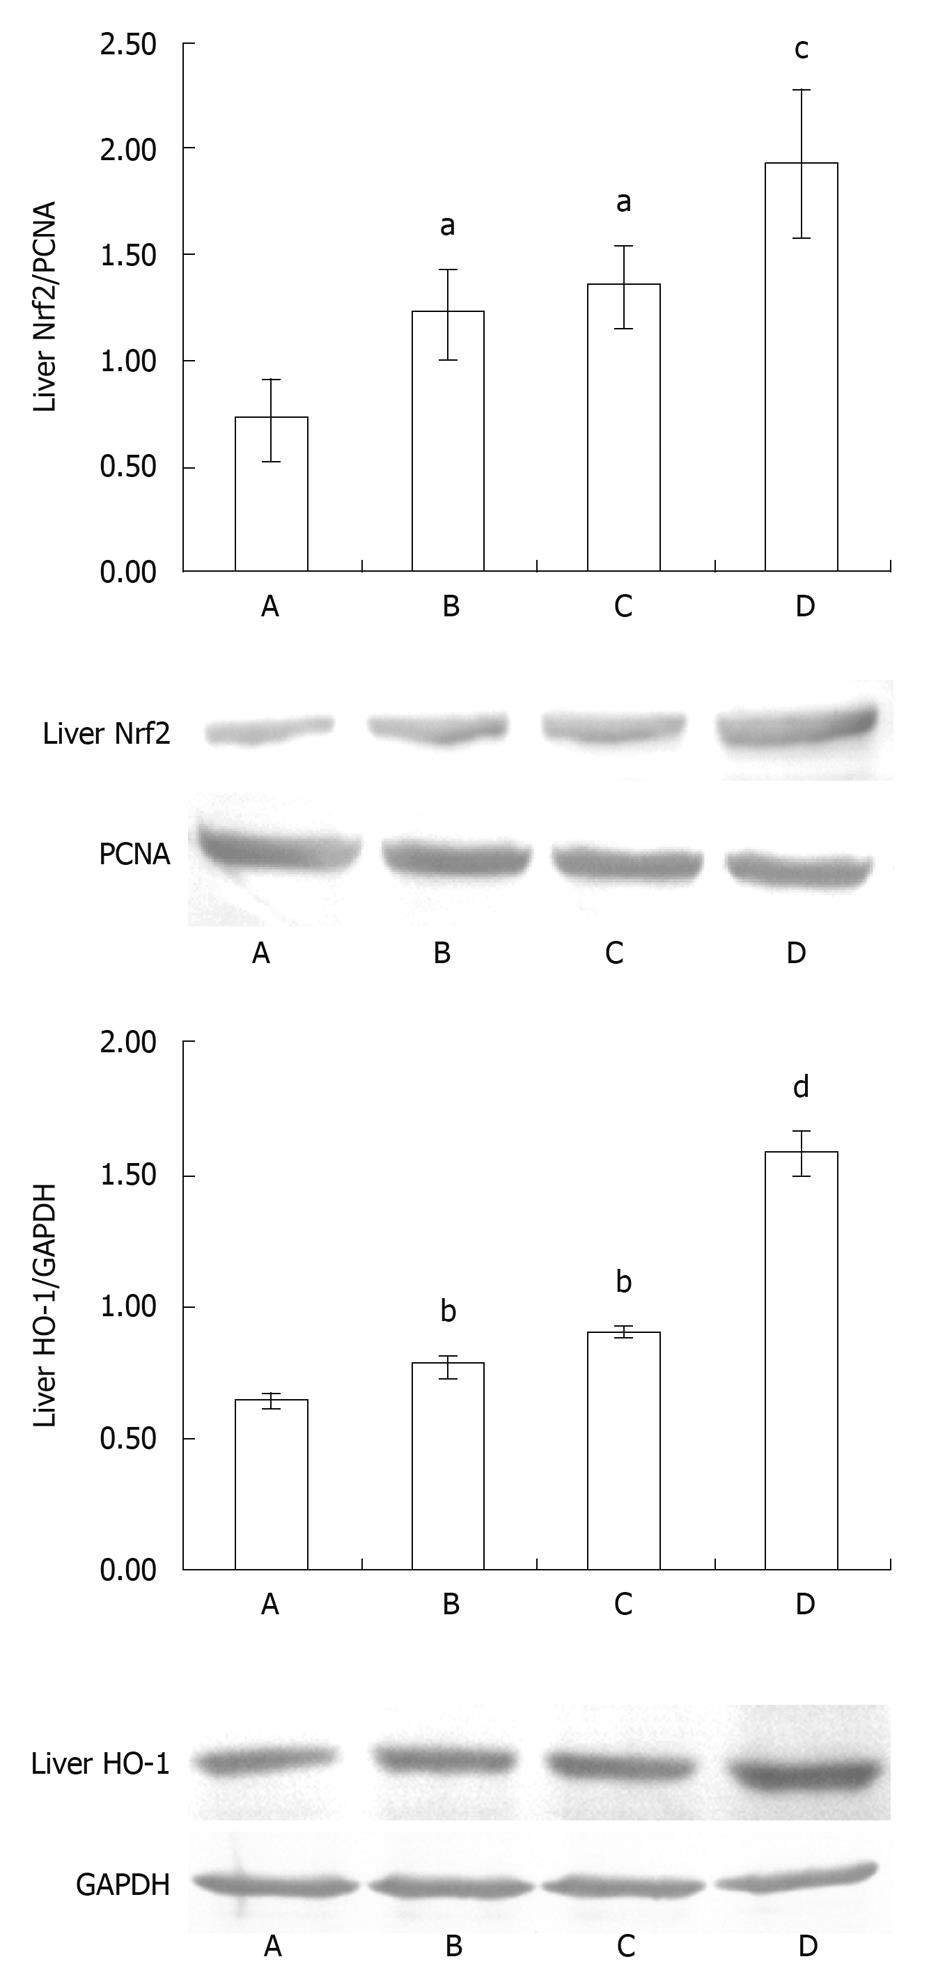
Figure 9 Western blotting analysis of expression of liver Nrf2 and HO-1 in the control (A), SFN control (B), intestinal I/R (C) (1 h ischemia and 2 h reperfusion) and SFN pretreatment (D) groups.
PCNA and GAPDH were as the internal control respectively. aP < 0.05, bP < 0.01 vs control group; cP < 0.05, dP < 0.01 vs intestinal I/R group.
- Citation: Zhao HD, Zhang F, Shen G, Li YB, Li YH, Jing HR, Ma LF, Yao JH, Tian XF. Sulforaphane protects liver injury induced by intestinal ischemia reperfusion through Nrf2-ARE pathway. World J Gastroenterol 2010; 16(24): 3002-3010
- URL: https://www.wjgnet.com/1007-9327/full/v16/i24/3002.htm
- DOI: https://dx.doi.org/10.3748/wjg.v16.i24.3002


