Copyright
©2010 Baishideng.
World J Gastroenterol. Jun 21, 2010; 16(23): 2949-2953
Published online Jun 21, 2010. doi: 10.3748/wjg.v16.i23.2949
Published online Jun 21, 2010. doi: 10.3748/wjg.v16.i23.2949
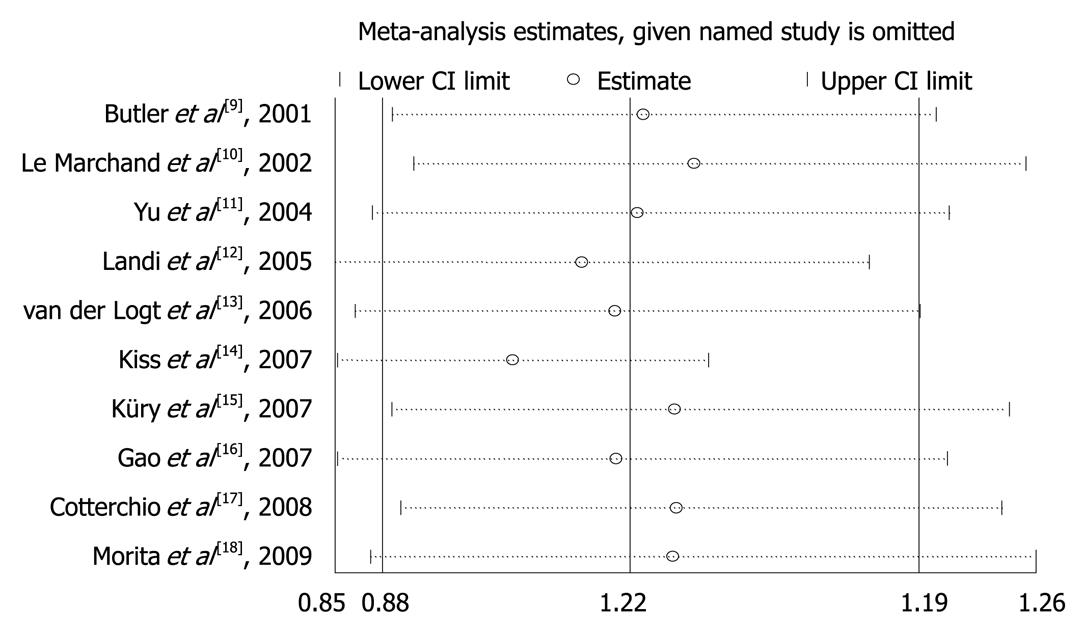
Figure 1 Influence analysis for c1c2 + c2c2 vs c1c1 in the overall meta-analysis.
It shows the influence of individual studies on the summary OR. The middle vertical axis indicates the overall OR and the two vertical axes indicate its 95% CI. Each hollow round indicates the pooled OR when the left study is omitted in this meta-analysis. The two ends of each broken line represent the 95% CI.
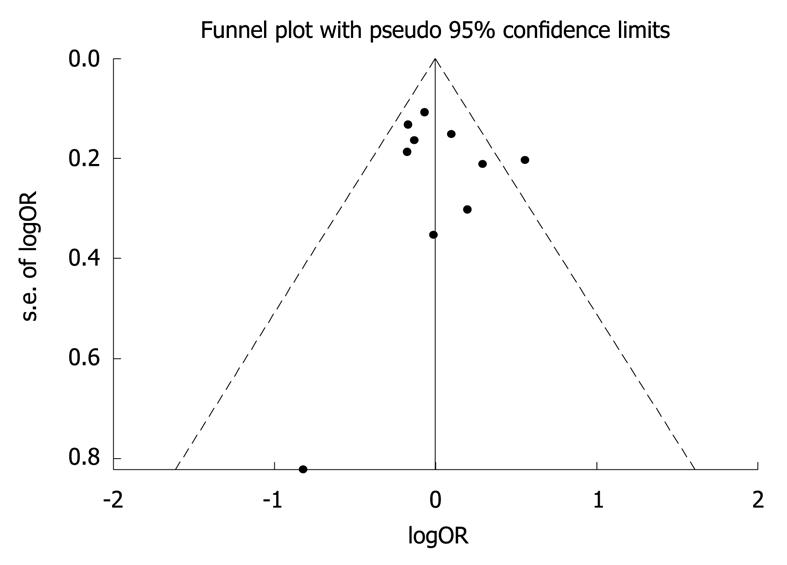
Figure 2 Funnel plot of CYP2E1 PstI/RsaI polymorphism and colorectal cancer risk for publication bias.
-
Citation: Zhou GW, Hu J, Li Q.
CYP2E1 PstI/RsaI polymorphism and colorectal cancer risk: A meta-analysis. World J Gastroenterol 2010; 16(23): 2949-2953 - URL: https://www.wjgnet.com/1007-9327/full/v16/i23/2949.htm
- DOI: https://dx.doi.org/10.3748/wjg.v16.i23.2949


