Copyright
©2010 Baishideng.
World J Gastroenterol. Jun 21, 2010; 16(23): 2851-2866
Published online Jun 21, 2010. doi: 10.3748/wjg.v16.i23.2851
Published online Jun 21, 2010. doi: 10.3748/wjg.v16.i23.2851
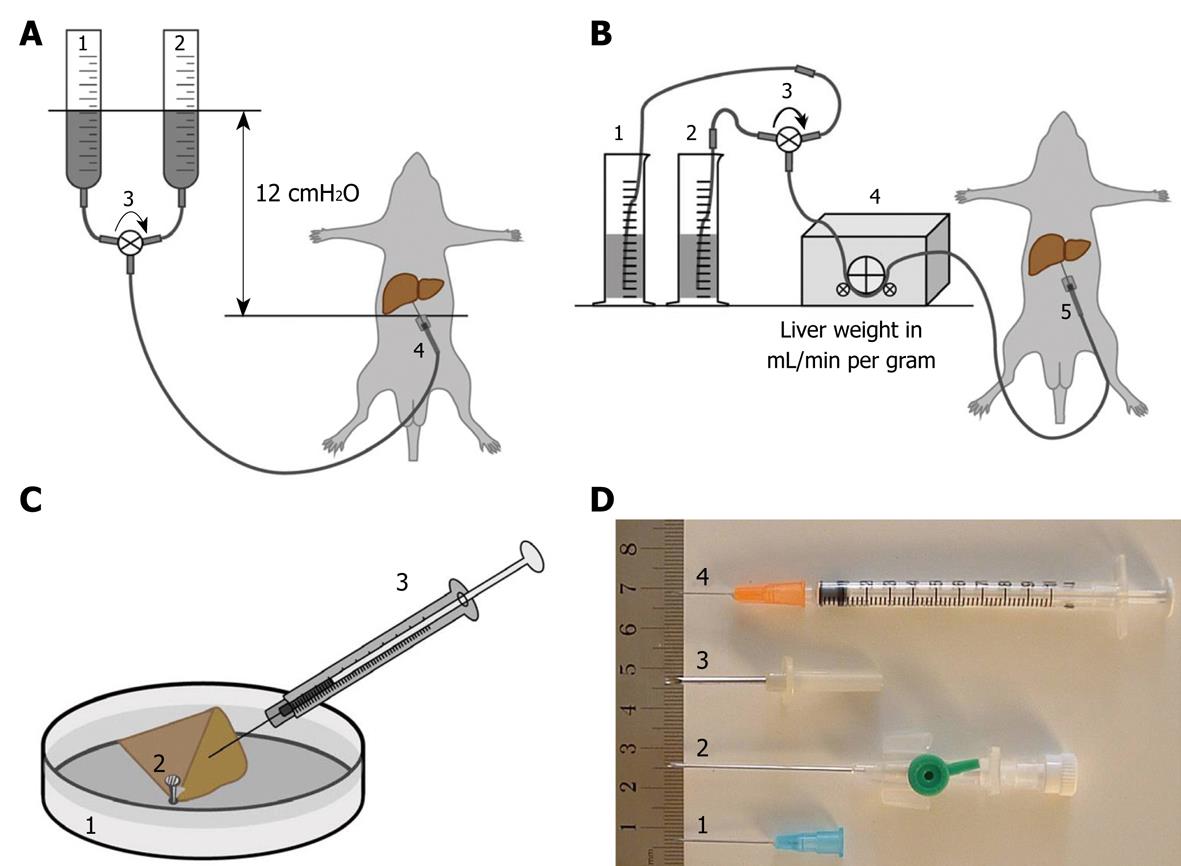
Figure 1 Diagram schematically depicting the different and most frequently used perfusion-fixation methods, including perfusion-fixation needles, to fix hepatic tissue.
A: Gravity-mediated perfusion fixation using 12 cm water pressure: (1) pre-perfusion buffer; (2) fixative solution; (3) tri-valve system (e.g. Discofix® C, B. Braun, Switzerland) that facilitates the change-over between both solutions; and (4) cannulation of the portal vein; B: Roller pump-mediated perfusion fixation at a flow of 1 mL/g liver tissue: (1) pre-perfusion buffer; (2) fixative solution; (3) tri-valve system; (4) low-flow peristaltic pump; and (5) cannulation of the portal vein; C: Injection or puncture perfusion fixation, using a needle to inject fixative into a wedge biopsy of about 1 cm × 1 cm × 1 cm dimensions. Injection to approach a rate of 1 mL/min: (1) Petri dish filled with 37°C physiological saline solution; (2) liver tissue wedge fixed by the tip of a forceps; and (3) syringe containing fixative solution; D: Different types of needles and their variants commonly used for portal vein insertion: (1) 18-23 G needle typically used for gravity-mediated perfusion for rat and mouse livers; (2) 18 G needle catheters are recommended for peristaltic-pump-mediated perfusion; (3) 12-13 G needles are typically used for larger animals such as rabbits; and (4) 25 G syringes are ideal for the injection of fixative solution in hepatic tissue. In case of accidental failure of procedure A or B, method C (injection perfusion) can be used to save the preparation.
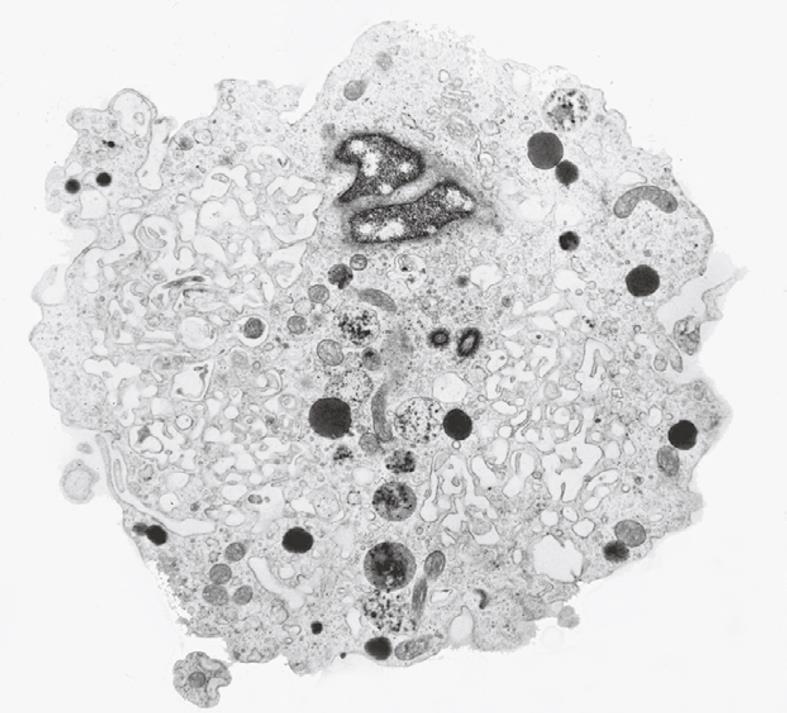
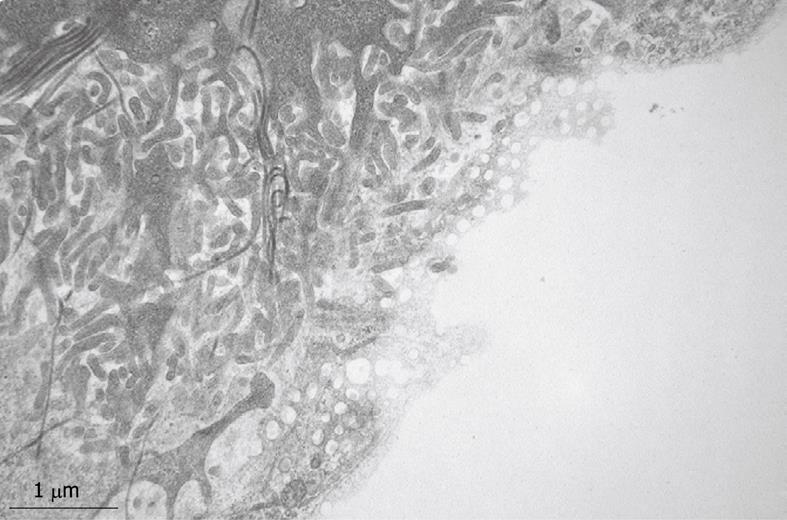
Figure 2 Transmission electron microscopy (TEM) image of an ultrathin section of a plastic-embedded liver sinusoidal endothelial cell after isolation.
In the upper part of the picture is a small portion of the nucleus. The labyrinth-like structures in the cytoplasm represent fenestrae that are internalized during the isolation procedure. Electron-dense granules represent lysosomes that reflect the high digestive capacity of these cells. Magnification 6300 ×.
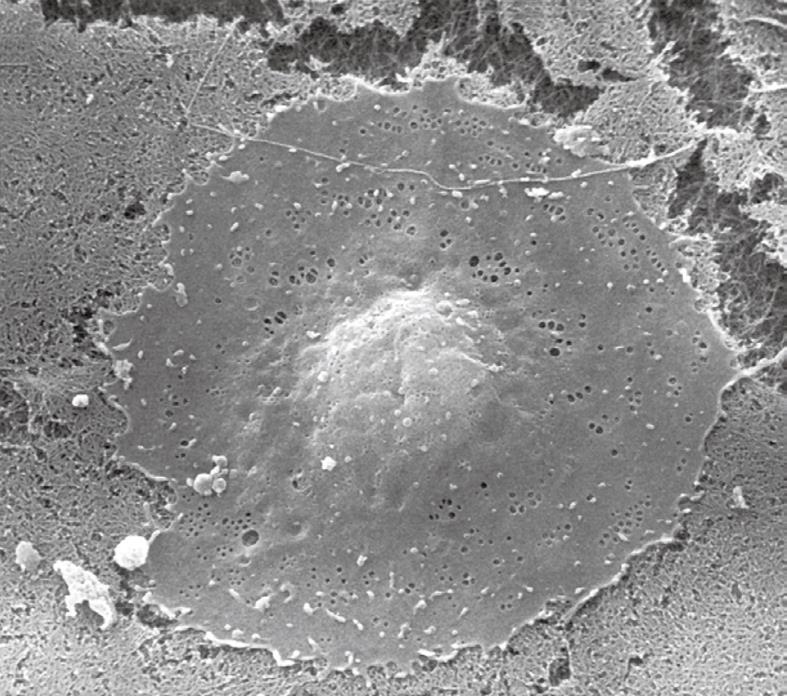
Figure 3 Scanning electron microscopy (SEM) image of a critical-point-dried liver sinusoidal endothelial cell in culture, 2500 ×.
After isolation and purification, cells were seeded on a layer of collagen. Besides the centrally located, bulging nucleus, fenestrae can be easily observed in the surrounding thin, flat cytoplasm.
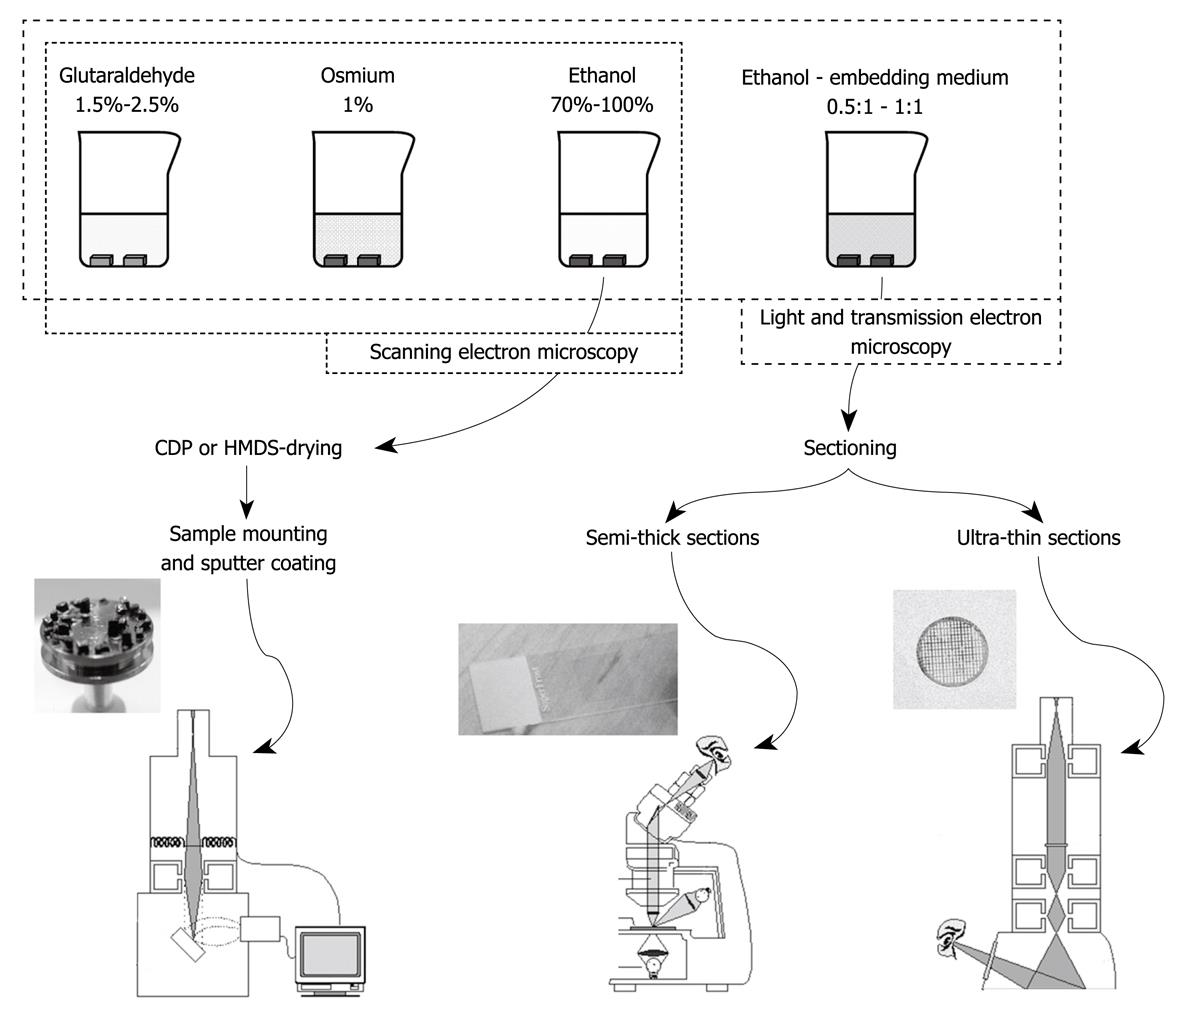
Figure 4 Summary of the different steps in the preparation of liver tissue after aldehyde fixation (top figure) and the subsequent tissue sample preparation steps for the different modes of microscopy (bottom figure).
Good laboratory practice should involve all three visualization modes in order to collect fine structural and topological data, together with insights into the interior of the sample. Left: SEM; Middle: Light microscopy (LM); Right: TEM.
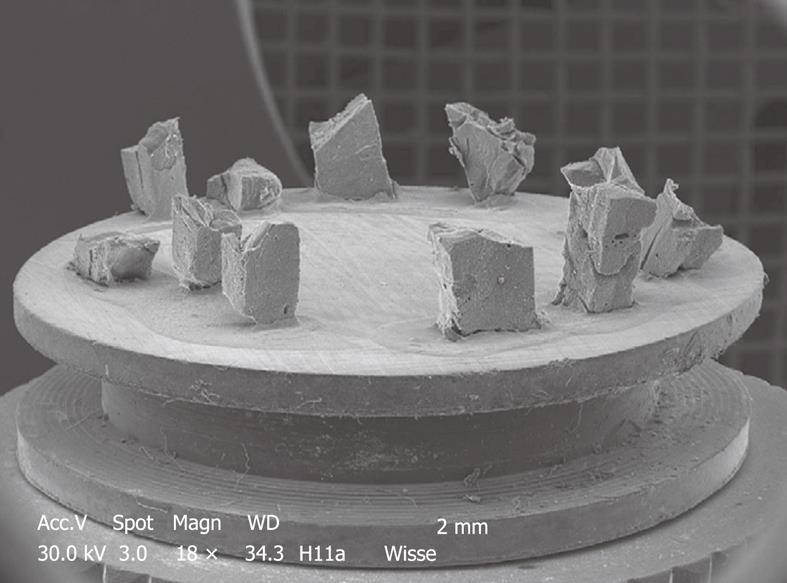
Figure 5 Typical stub of aluminum (diameter 1 cm) bearing 11 pieces of liver tissue of an injection-fixed human liver wedge biopsy observed by SEM at low magnification.
Strips of tissue in 100% ethanol are frozen at -196°C, fractured, critical point dried, sputter coated and glued to this carrier. The top surface of the specimens is observed, and imaging is achieved with secondary electrons. This picture is taken by a small CCD camera fitted to the microscope to observe specimens directly.
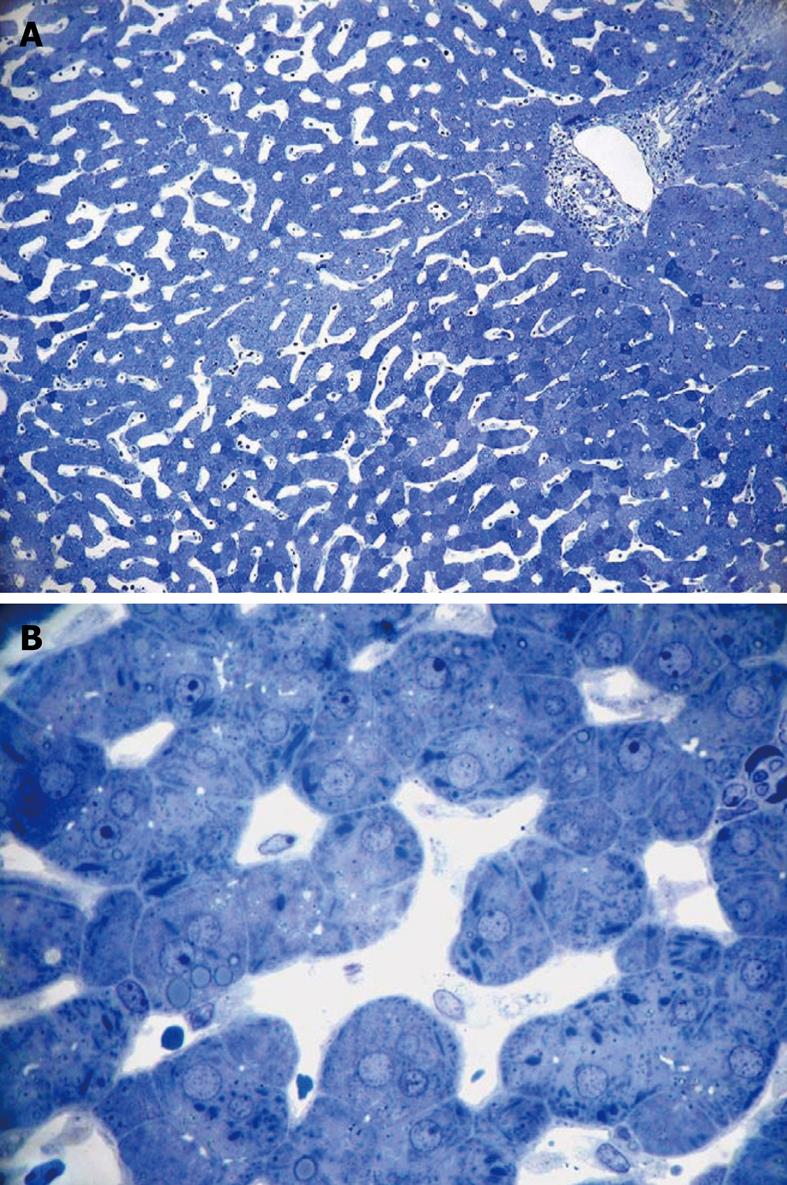
Figure 6 Light micrograph of a wedge biopsy of human liver, injected with glutaraldehyde, plastic section stained with Toluidine Blue.
A: Original magnification 10 × objective lens. Note that, as a result of successful perfusion, sinusoids are open, and only a few red blood cells are present. A portal tract is present in the upper right corner; B: Original magnification 63 × oil-immersion lens. Details such as giant mitochondria are visible in the parenchymal cells, amongst others such as small mitochondria, lipid inclusions and bile canaliculi. Sinusoids are patent and show the presence of sinusoidal cells.
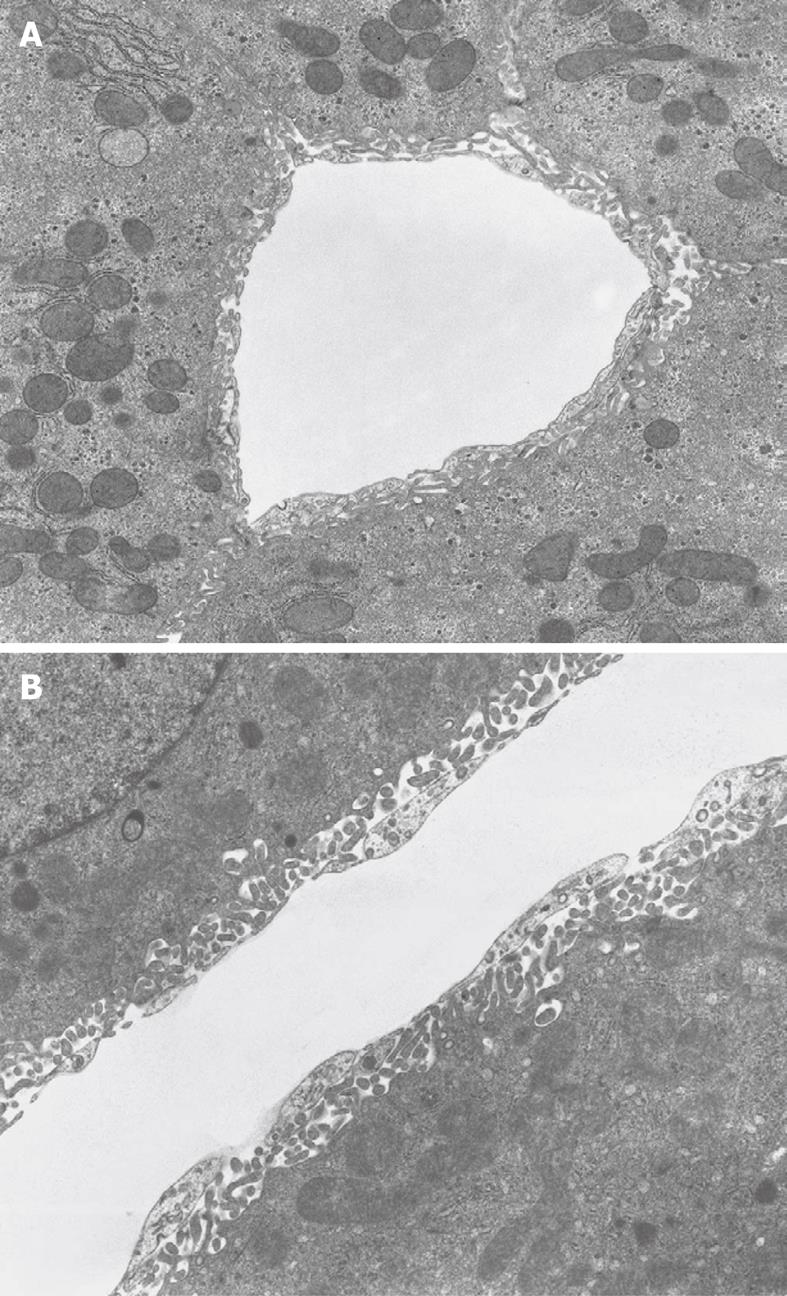
Figure 7 TEM micrograph of a transversely cut sinusoid of rabbit liver (A) and longitudinally cut sinusoid of mouse liver (B), fixed by perfusion through the portal vein.
A: The Space of Disse shows the presence of microvilli extending from the parenchymal cells. Within the cytoplasm of the parenchymal cells, mitochondria, rough endoplasmic reticulum and glycogen are recognizable. Original magnification 6600 ×; B: Underneath the thin layer of fenestrated endothelium, bordering the sinusoidal lumen, the Space of Disse shows the presence of microvilli extending from the parenchymal cell surface. Within the cytoplasm of the parenchymal cells, mitochondria are recognizable. Original magnification 8900 ×.
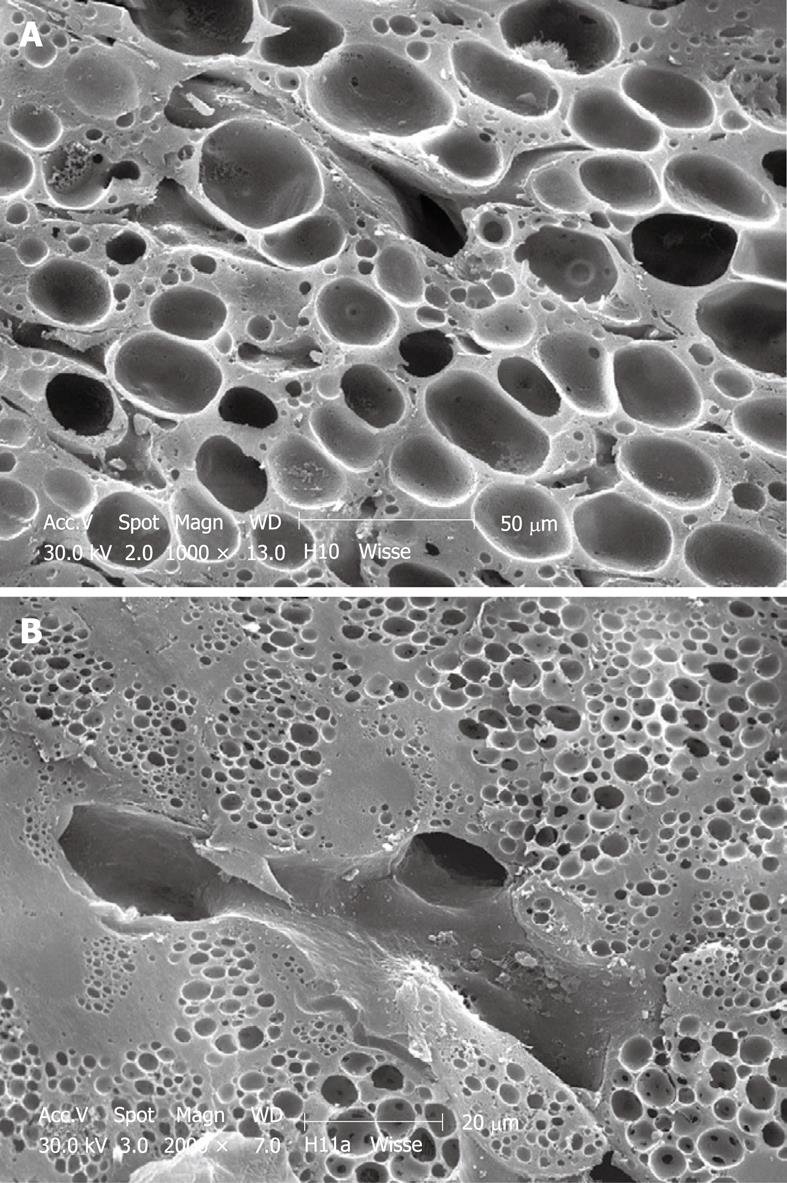
Figure 8 SEM micrograph of an injection-fixed human wedge biopsy showing macrovesicular steatosis (A) and microvesicular steatosis (B).
A: Fat droplets are of such dimensions that one appears to fill the cytoplasm of an entire parenchymal cell; B: Fat droplets are smaller than those in Figure 8A and are spread within the cytoplasm of parenchymal cells.
Figure 9 TEM micrograph of the tangentially cut endothelium of a human liver sinusoid, fixed by injection of glutaraldehyde fixative into a wedge biopsy.
Underneath the thin layer of fenestrated endothelium, the Space of Disse shows the presence of microvilli, thin fibers of reticulin, and processes of fat-storing cells. Fenestrae in such preparations have an average diameter of about 105 nm. Original magnification 19 000 ×.
Figure 10 TEM micrograph of tangentially cut sinusoidal endothelium of a rabbit liver, fixed by perfusion through the portal vein.
The fenestrae are grouped in sieve plates, but are intermingled with elements of the cytoskeleton, i.e. microtubules and microfilaments. Within the electron-dense sieve plate cytoplasm, saccular interconnecting cisternae are seen. These structures are fixation dependent and are only found in rabbit liver. Original magnification 21 000 ×.
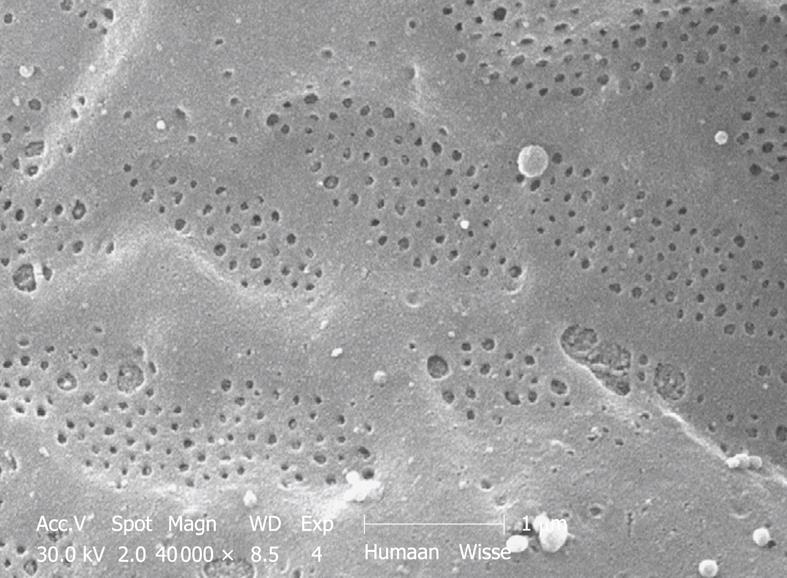
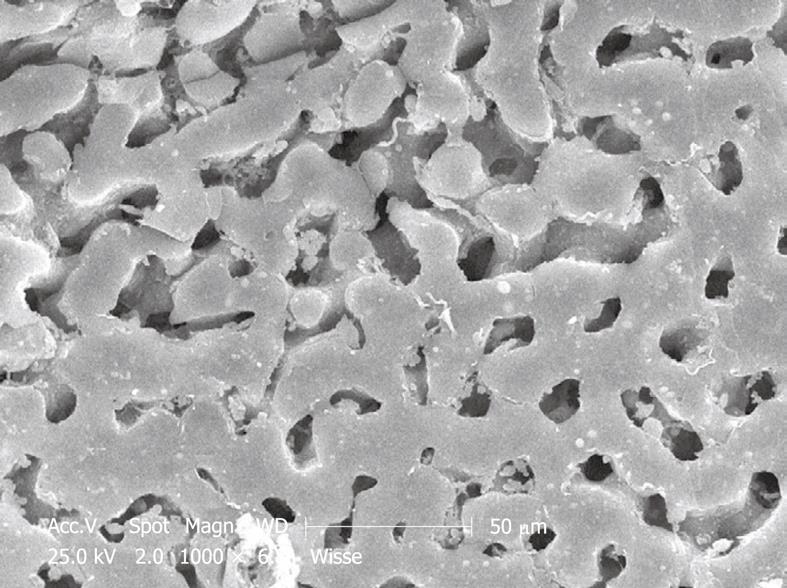
Figure 11 SEM micrograph of the fenestrated endothelial lining of a human injection-fixed wedge biopsy.
Note the grouping of fenestrae in sieve plates. Compare this figure with Figure 12, which shows an SEM micrograph of a mouse sinusoid at the same magnification. Fenestrae are apparently sensitive to fixation and are lost during immersion fixation. Their presence can therefore be used as a criterion of good fixation.
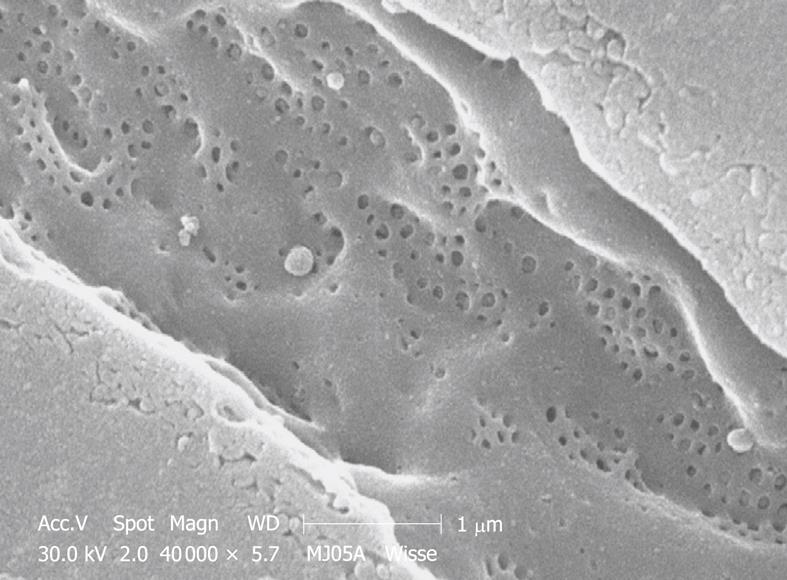
Figure 12 SEM micrograph of the fenestrated endothelial lining of a mouse portal-vein-perfused liver.
Compare this figure with Figure 11, taken under exactly the same conditions. Comparison with TEM of plastic sections shows that mouse (and rat) fenestrae are bigger (140 nm) than human (and rabbit) fenestrae (105 nm). Measurements on this type of SEM preparation should be avoided, because the drying procedure results in about 30% shrinkage and incorrect measurement of all components in the tissue.
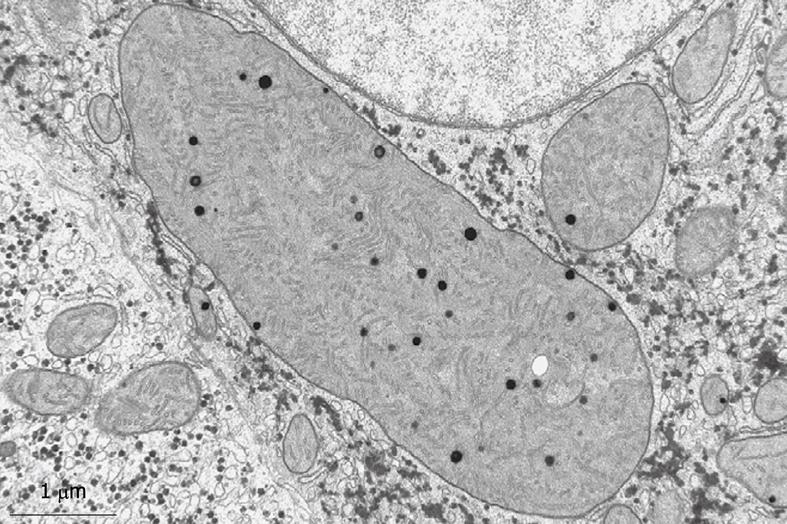
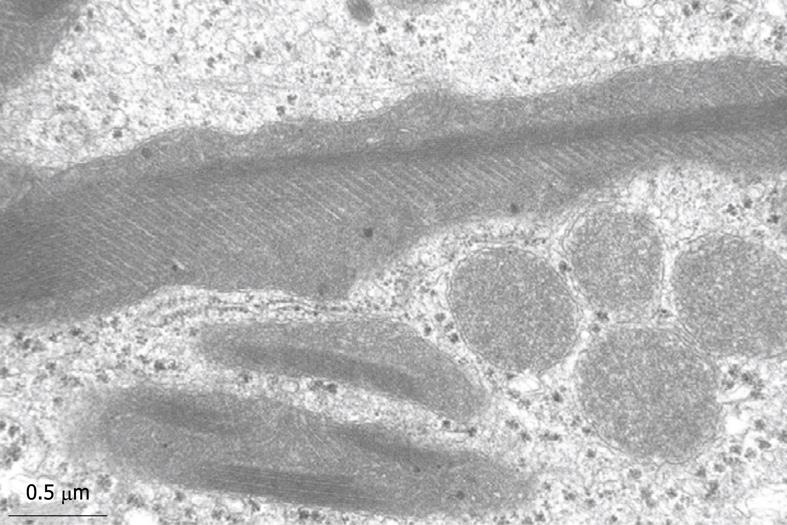
Figure 13 Typical structures that are often encountered in human liver parenchymal cells are the giant mitochondria.
This wedge biopsy was fixed by injection, but during the osmium postfixation, ferrocyanide has been added. This compound enhances the contrast of membranes, including the cristae. Giant mitochondria also contain electron-dense granules, as normally seen in small mitochondria (compare Figure 14). Giant mitochondria can also be recognized in plastic sections observed by LM (see Figure 6B). Magnification 19 000 ×.
Figure 14 Giant mitochondria in a wedge biopsy fixed by injection.
No ferrocyanide has been added during the osmium postfixation, therefore, membrane contrast is low. Within the giant mitochondria, the occurrence of typical crystals can be observed, together with a highly rhythmical pattern of the cristae. Magnification 34 000 ×.
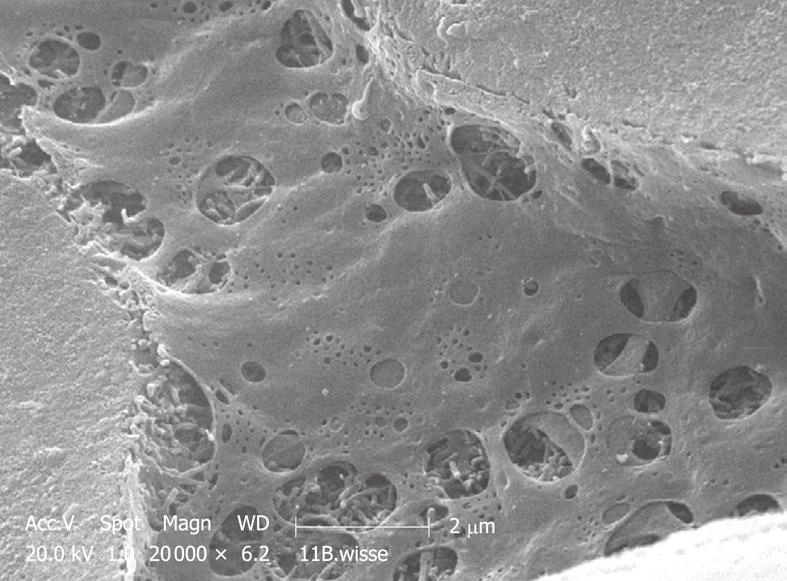
Figure 15 A major problem in EM preparations of liver tissue is the occurrence of gaps in the endothelial lining.
It is assumed that they appear during fixation due to instability of the cytoskeleton, which allows the fusion of fenestrae or the de novo formation of gaps. This SEM picture is from a rabbit liver fixed by portal perfusion.
Figure 16 SEM micrograph of another portal-vein-perfused rabbit liver, which shows a complete intact sinusoid, and apparently no gaps have been formed.
Fenestrae occur in sieve plates (groups), the space of Disse seems to be filled by microvilli of the parenchymal cells.
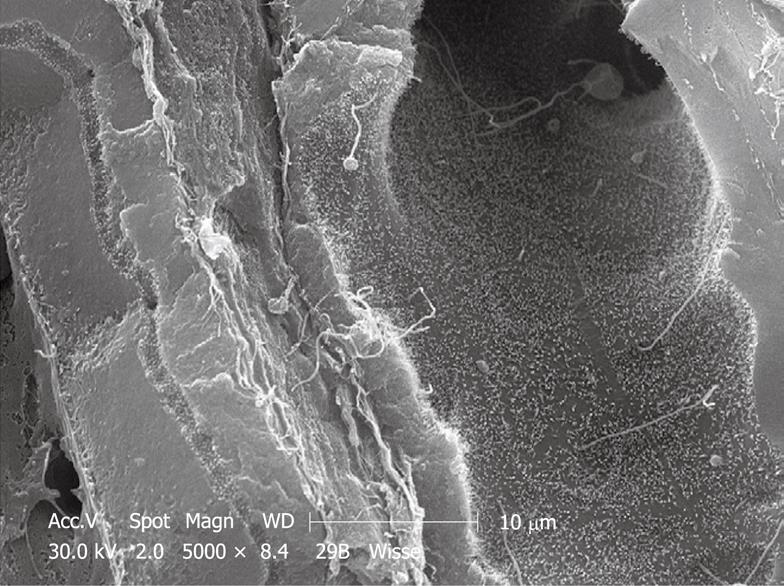
Figure 17 SEM micrograph of rabbit liver, fractured after CPD.
In such preparations, the fracture plane separates the intact lateral cell membranes of parenchymal cells, which exposes the bile canaliculi, which are strictly separated from the sinusoids (to the extreme left). The right hand side of the picture shows a bile duct. The luminal surface of the bile duct epithelial cells is covered with numerous small microvilli and single cilia protruding into the lumen of the bile duct.
Figure 18 SEM micrograph of a human injection-fixed wedge biopsy that shows two populations of sinusoids, i.
e. normal size (lower half of the picture), and those in the upper half of the picture show sinusoidal dilatation.
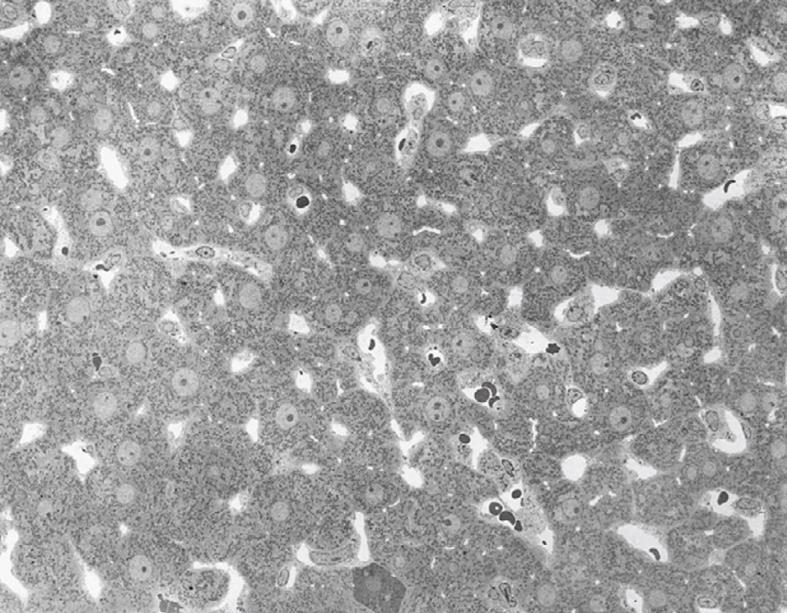
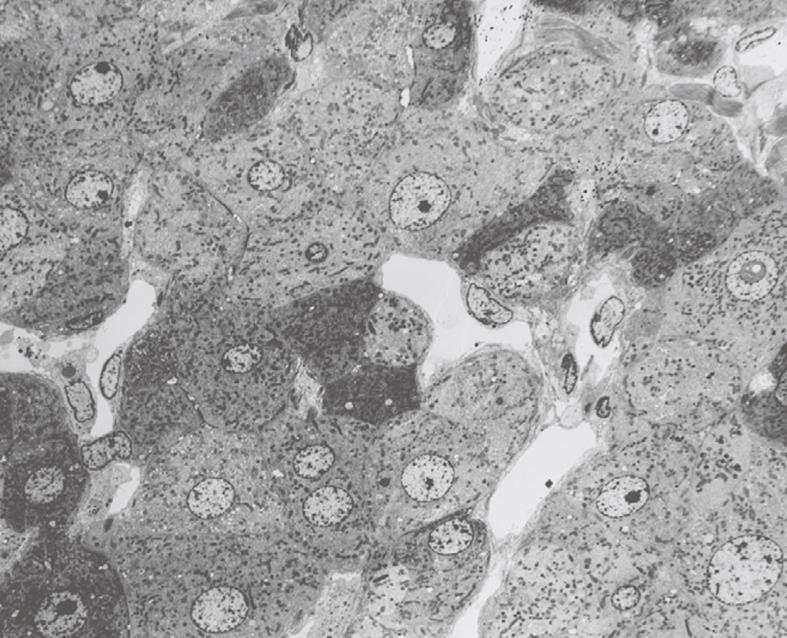
Figure 19 TEM image after perfusion fixation of rat liver through the portal vein, which results in an image of parenchymal cells of equal density (with one exception in the low middle part), open sinusoids and open bile capillaries.
Original magnification 720 ×.
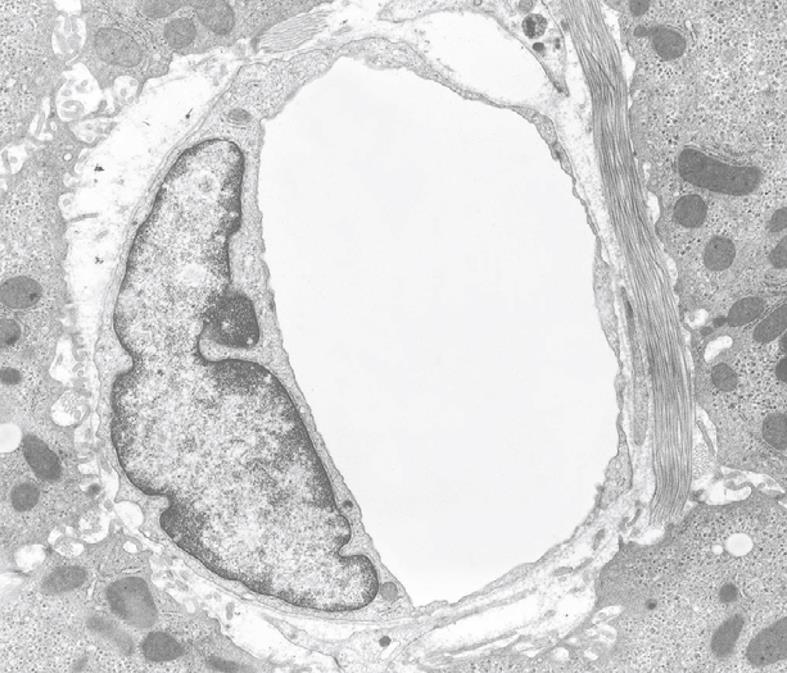
Figure 20 TEM micrograph of a capillary found in diseased human liver, fixed by injection of fixative into a wedge biopsy.
Capillary endothelial cells are different from normal sinusoidal endothelial cells; their vacuolar apparatus (pinocytotic vesicles, endosomes, lysosomes, Golgi apparatus) is not developed. The thin cytoplasm contains fenestrae and the capillary is surrounded by a thin, continuous basal lamina that is not present in normal sinusoids. Magnification 6600 ×.
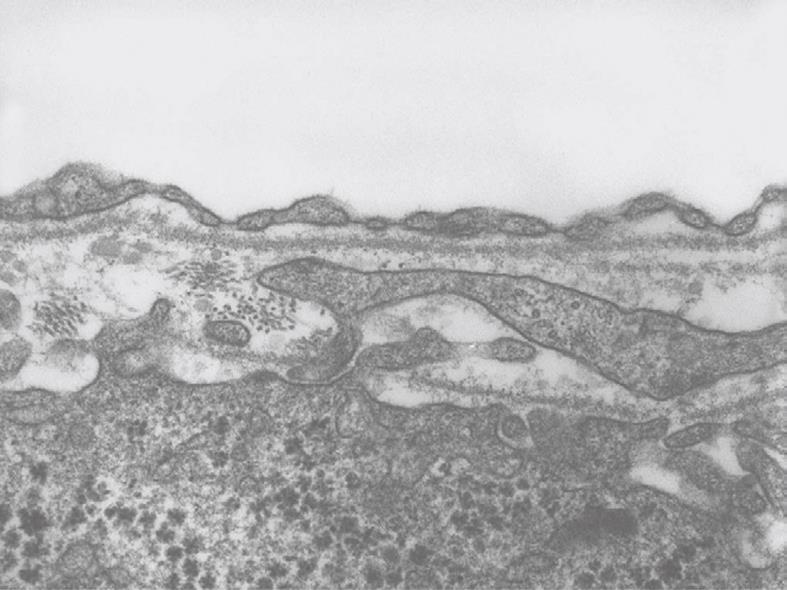
Figure 21 TEM micrograph of a capillary found in diseased human liver, fixed by injection of fixative into a wedge biopsy.
The thin endothelial lining contains fenestrae, closed by a diaphragm. Underneath the endothelium, one can observe a continuous basal lamina. Fenestrae in this type of capillary are about 60 nm in diameter. It is supposed that transport from this capillary to the tissue is hampered by the structures mentioned. Magnification 28 500 ×.
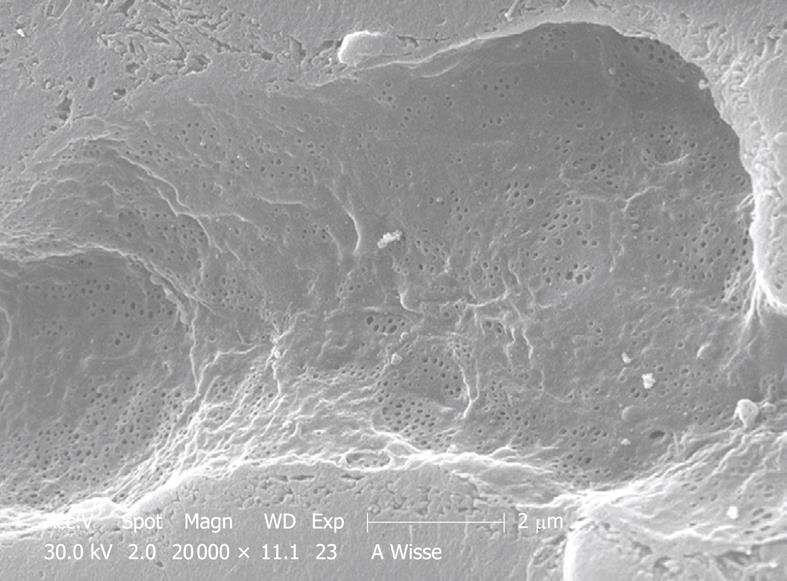
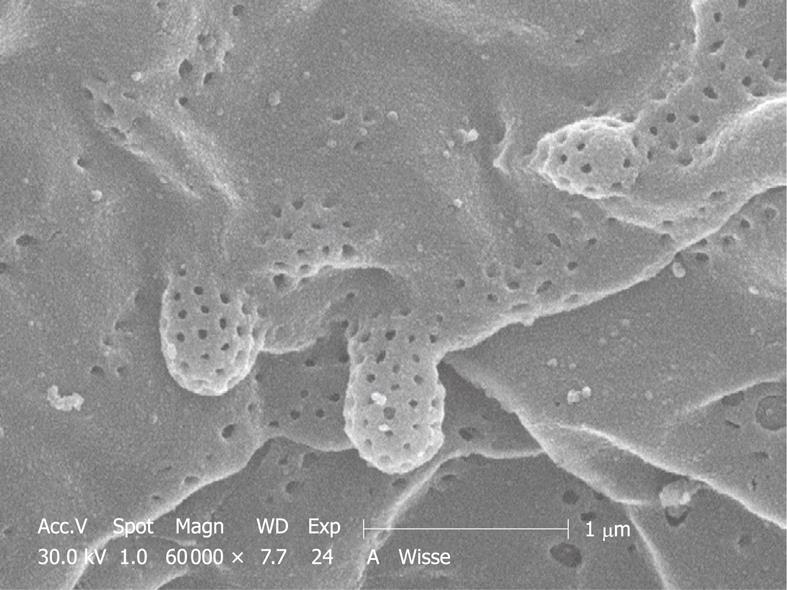
Figure 22 SEM micrograph of a portal-vein-perfused rabbit liver.
Due to the quality of fixation, fenestrae are preserved, including a surprising detail, named pored domes[32], which are probably the in vivo equivalent of the defenestration center observed in endothelial cell cultures[33]. This structure was not seen in human, mouse, rat or pig liver.
Figure 23 TEM micrograph of an injection-fixed human liver wedge biopsy at 700 × magnification, which shows the presence of dark and light cells next to each other.
It is assumed that the differences in density reflect differences in fixation, which often occur in bad fixation.
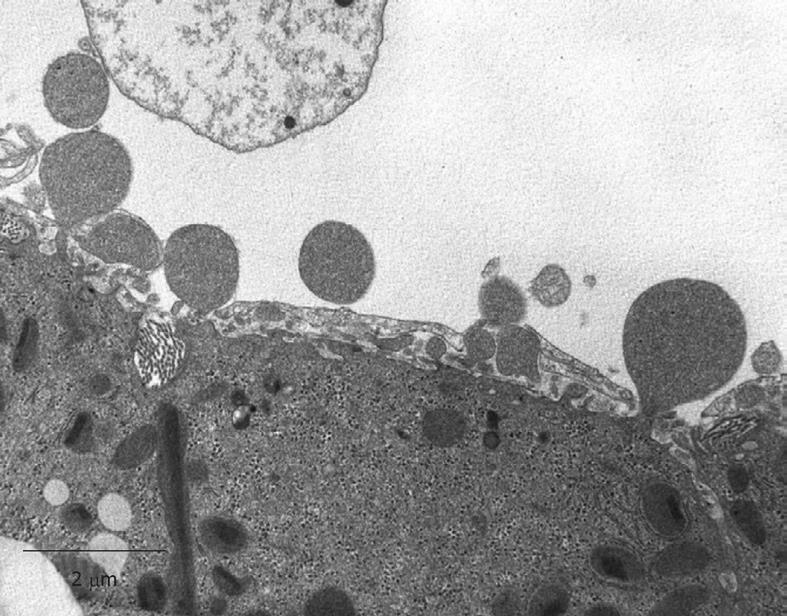
Figure 24 TEM micrograph of an injection-fixed human liver wedge biopsy, which shows the presence of blebbing, which occurs when cells survive in bad conditions.
Incomplete fixation is thought to be the cause. Blebs are either swollen microvilli or originate from the peripheral cytoplasm of parenchymal cells. Original magnification 7900 ×.
- Citation: Wisse E, Braet F, Duimel H, Vreuls C, Koek G, Olde Damink SW, van den Broek MA, De Geest B, Dejong CH, Tateno C, Frederik P. Fixation methods for electron microscopy of human and other liver. World J Gastroenterol 2010; 16(23): 2851-2866
- URL: https://www.wjgnet.com/1007-9327/full/v16/i23/2851.htm
- DOI: https://dx.doi.org/10.3748/wjg.v16.i23.2851


