Copyright
©2010 Baishideng.
World J Gastroenterol. May 28, 2010; 16(20): 2504-2519
Published online May 28, 2010. doi: 10.3748/wjg.v16.i20.2504
Published online May 28, 2010. doi: 10.3748/wjg.v16.i20.2504
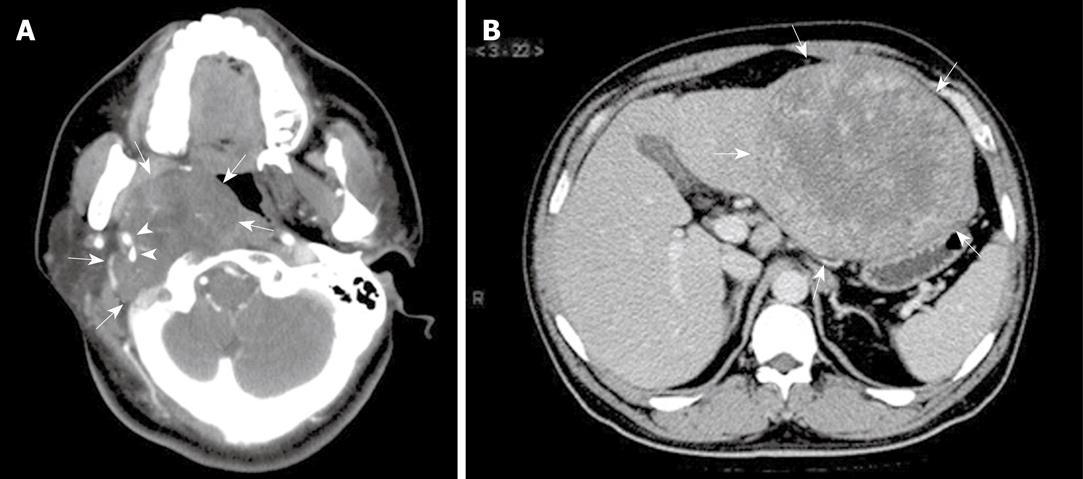
Figure 1 Radiological features of extranodal follicular dendritic cell (FDC) sarcoma shown by computed tomographic scan.
A: Case 8, a tumor (arrows) at the right parapharyngeal space showing soft tissue-like density and an expansive growth pattern, with the internal and external carotid arteries (arrowheads) engulfed; B: Case 6, a well-circumscribed mass (arrows) at the left lobe of liver, showing irregular enhancement at its periphery.
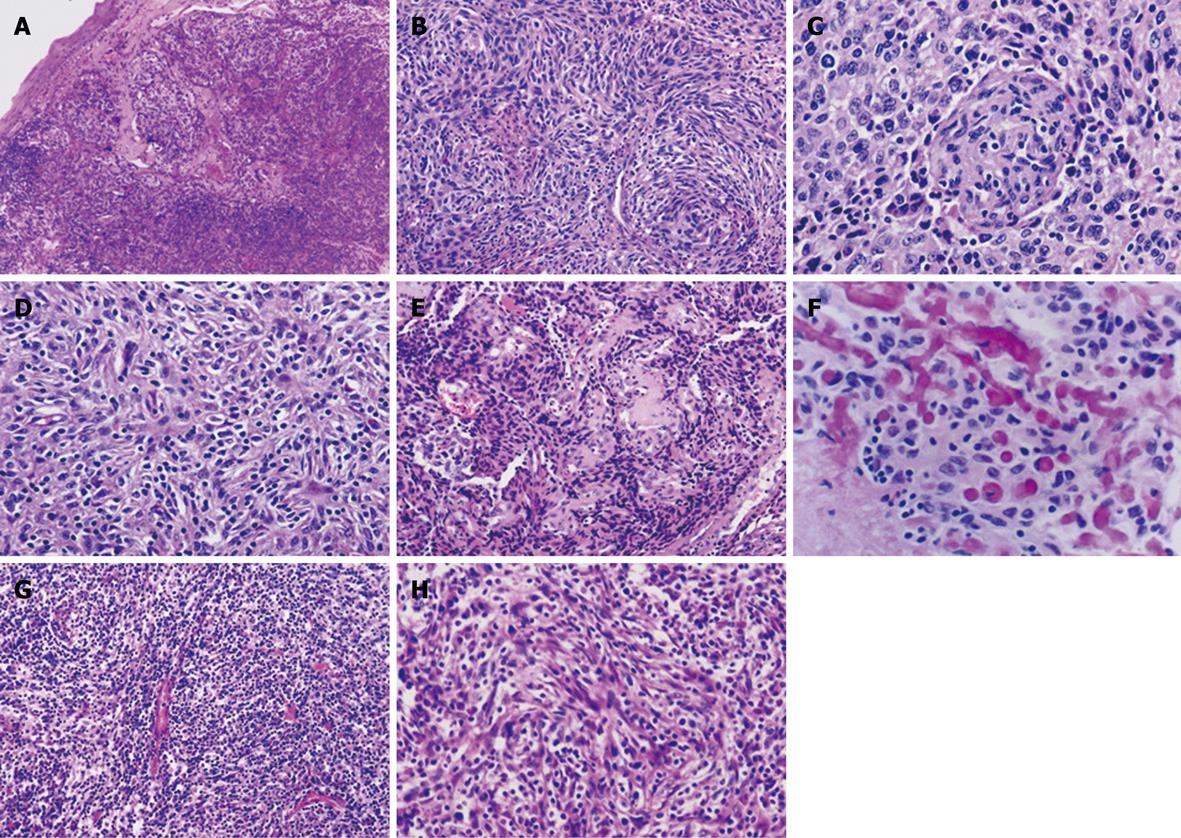
Figure 2 Typical features of follicular dendritic cell sarcoma of the conventional (A-F) and inflammatory pseudotumor-like types (G and H).
Spindle and ovoid tumor cells, frequently growing in nodules as in Case 1 (A), arrange in whorl (Case 3, B and C) and storiform (Case 3, D) and fascicular patterns (Case 6, H), with sprinkling small lymphocytes throughout the former type of lesions and numerous plasma cells and lymphocytes in the latter. Perivascular sclerosis was noted in Case 3 (E), with foci of osteoid matrix deposition resembling osteosarcoma (F). HE: A, × 40; B, E and G, × 100; C, D, F and H, × 200.
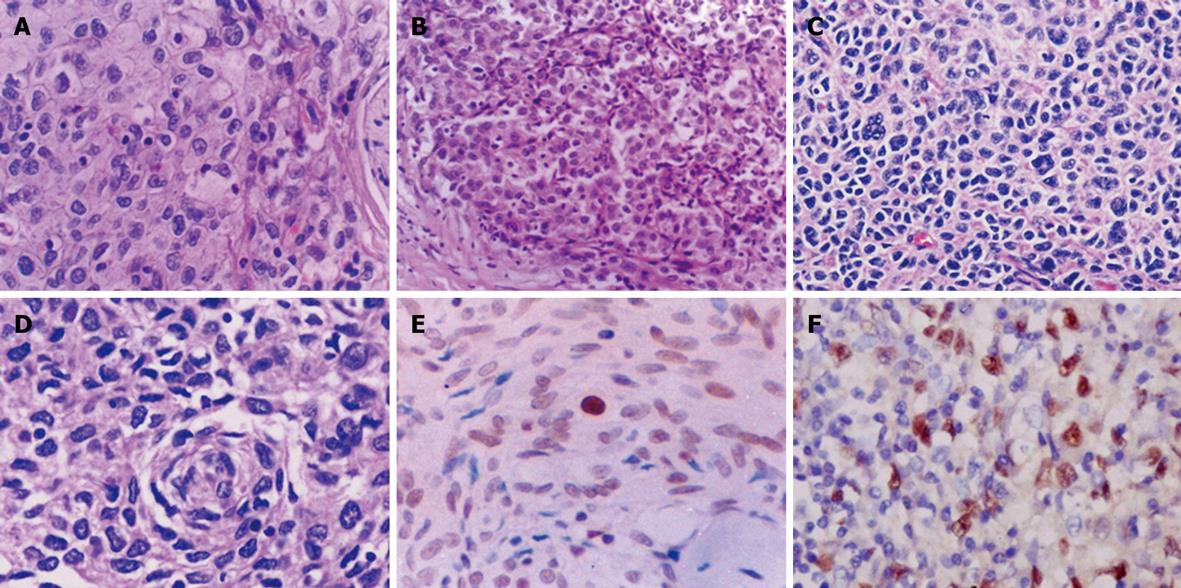
Figure 3 Atypical morphology of FDC sarcoma (A-D) and expression of p53 protein (E) and Epstein-Barr virus-encoded RNA (EBER) (F) in tumor cells.
A-D: Epithelioid (A and B) and pleomorphic tumor cells (C and D) are arranged in a sheet-like or diffuse pattern. Lymphocyte infiltration is less prominent (A and B) or absent (C and D) in these areas. HE: A, C and D, × 400; B, × 200; E: Nuclear immunoreactivity for p53 protein in majority of tumor cells. S-P, × 400; F: In situ hybridization signal for EBER in tumor cells, × 400.
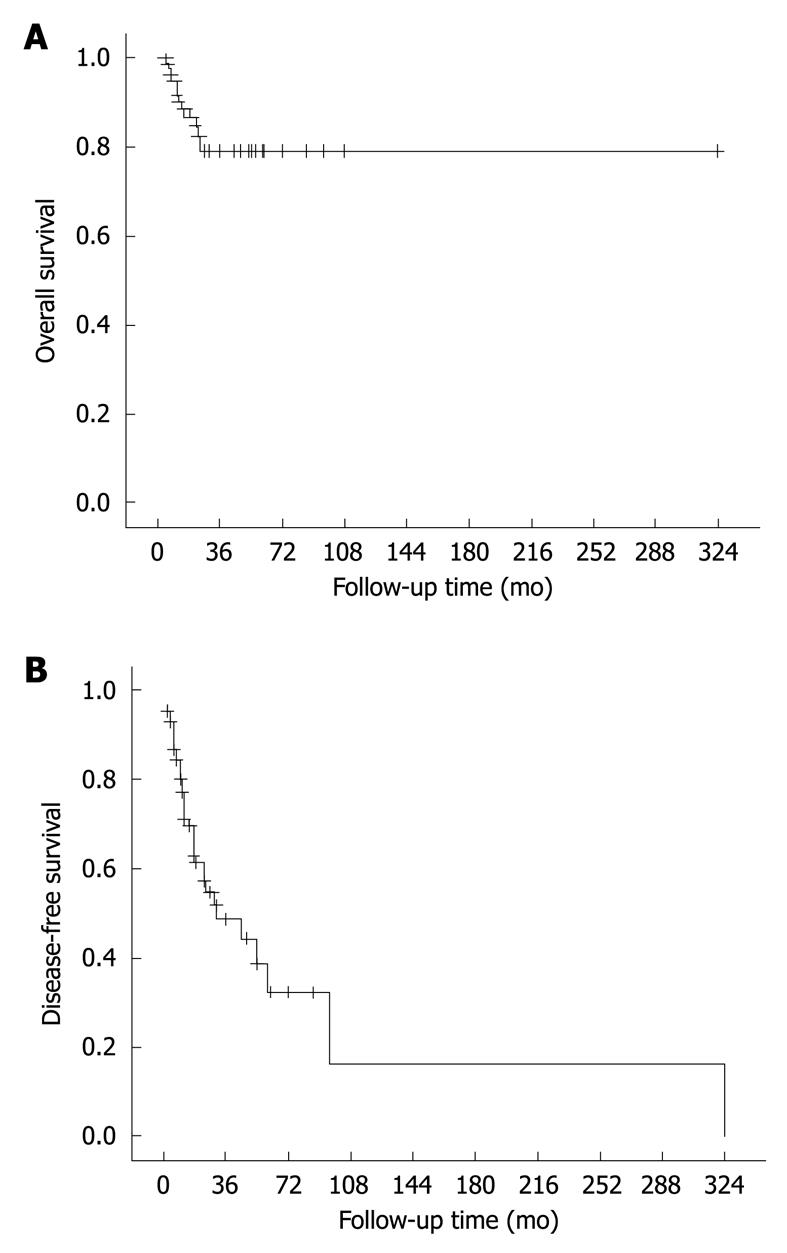
Figure 4 Overall (A) and disease-free survival curves (B) of FDC sarcoma.
The results are based on follow-up data of 91 informative cases.
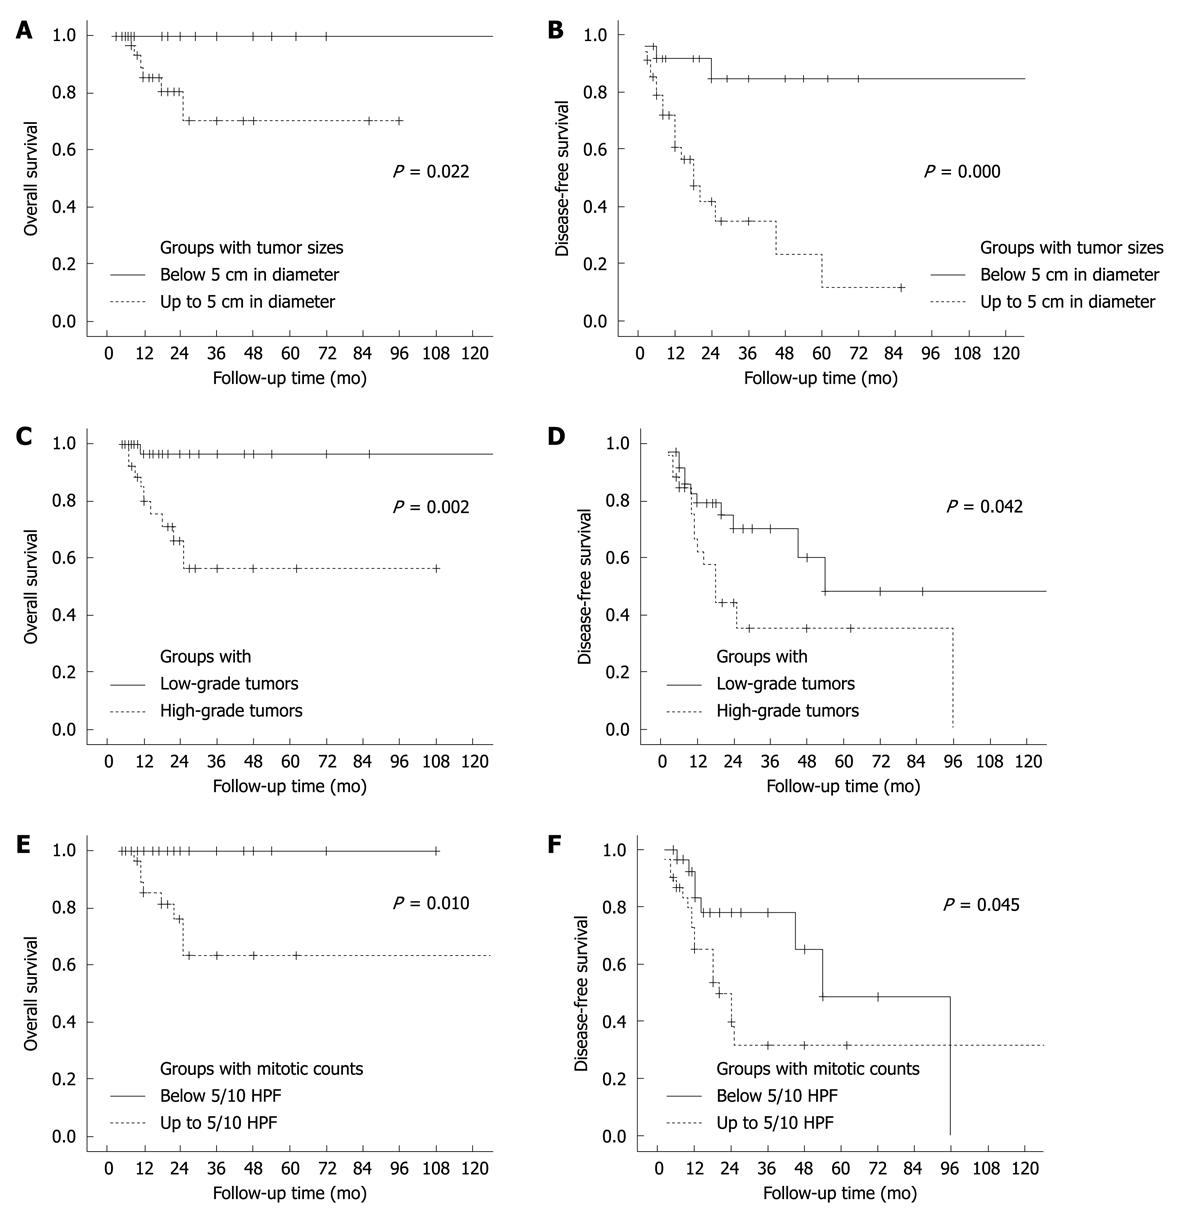
Figure 5 Overall (A, C and E) and disease-free survival curves (B, D and F) of patients with FDC sarcoma, showing data of 120 mo.
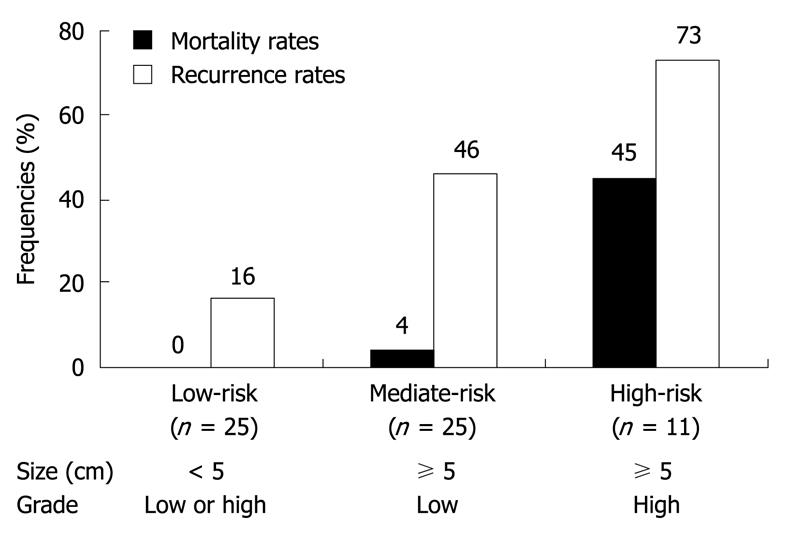
Figure 6 Definitions of low- (low-risk), intermediate- (mediate-risk) and high-risk groups (high-risk) of extranodal FDC sarcomas.
Mortality rates: overall, P = 0.000; low-risk vs mediate-risk, P = 1.000; low-risk vs high-risk, P = 0.001; mediate-risk vs high-risk, P = 0.006; Recurrence rates: overall, P = 0.001; low-risk vs mediate-risk, P = 0.032; low-risk vs high-risk, P = 0.002; mediate-risk vs high-risk, P = 0.167.
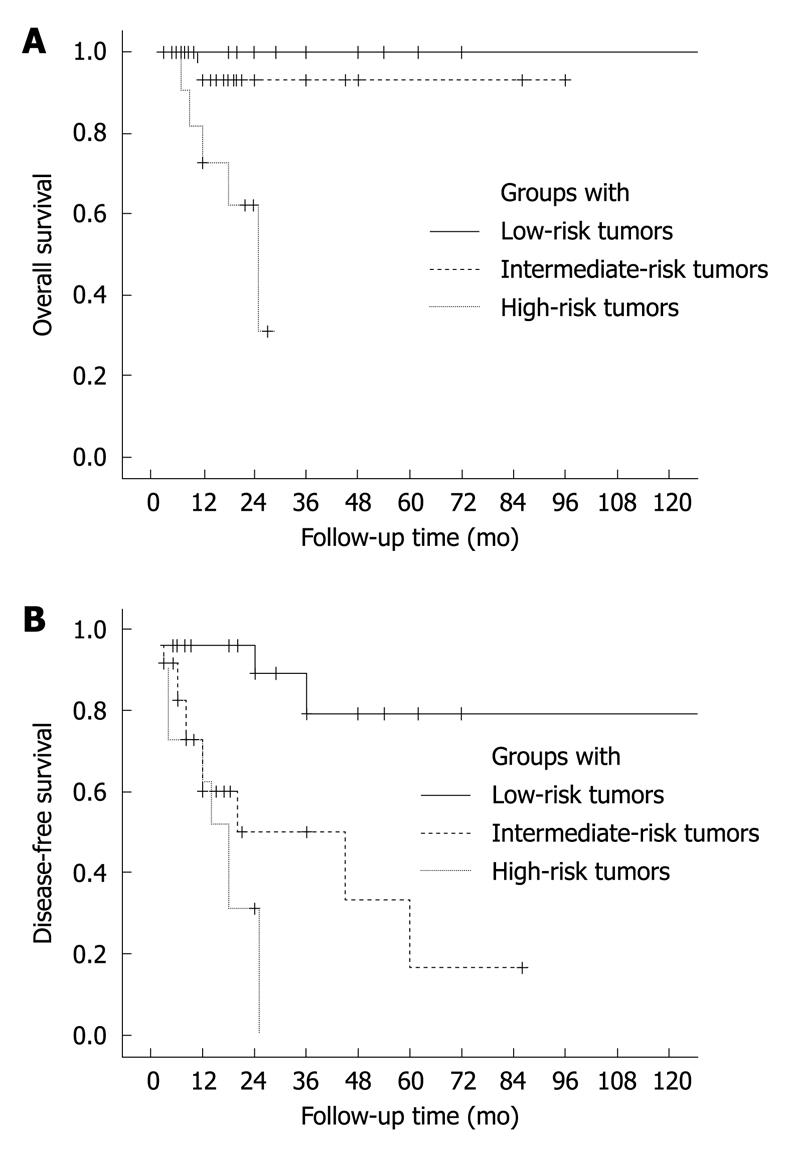
Figure 7 Overall (A) and disease-free survival curves (B) of patients with FDC sarcoma, estimated in groups with low-, intermediate- and high-risk tumors, showing data of 120 mo.
A: Overall, P = 0.000; low-risk vs mediate-risk, P = 0.273; low-risk vs high-risk, P = 0.000; mediate-risk vs high-risk, P = 0.017; B: Overall, P = 0.000; low-risk vs mediate-risk, P = 0.003; low-risk vs high-risk, P = 0.000; mediate-risk vs high-risk, P = 0.207.
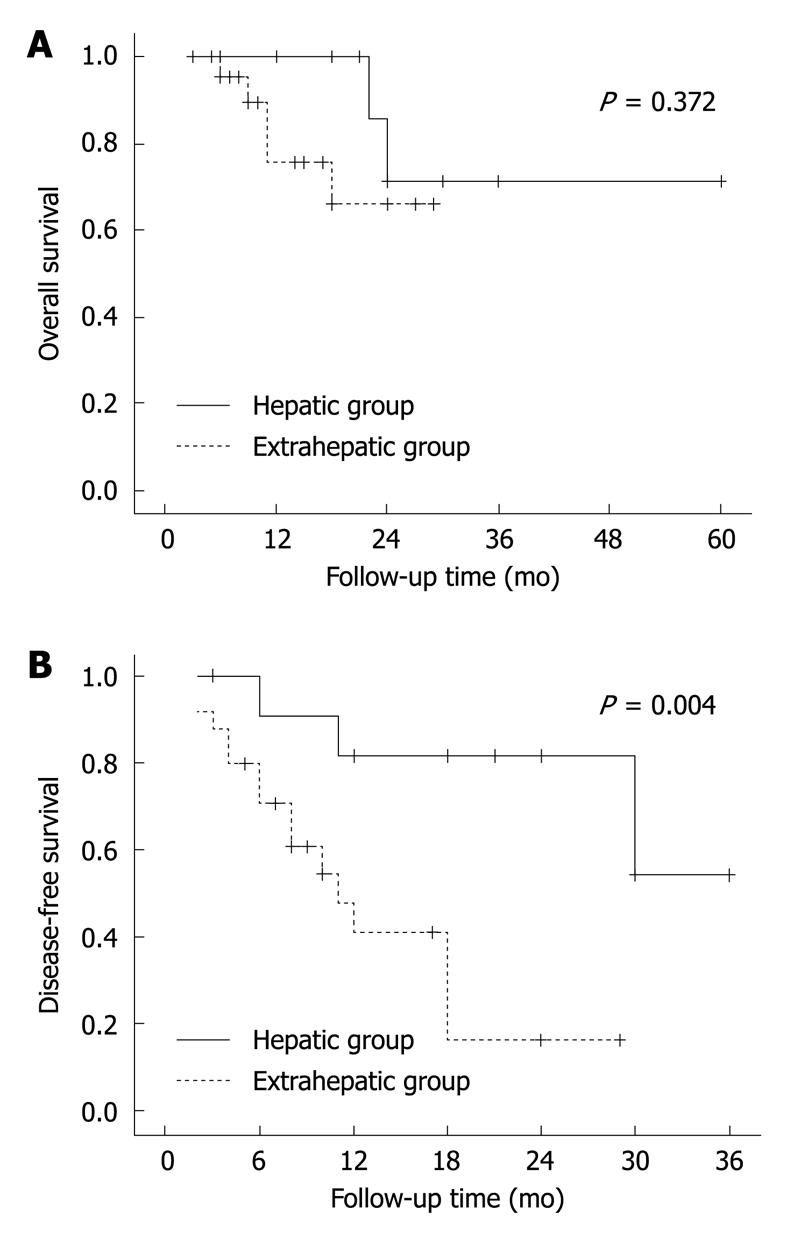
Figure 8 Overall (A) and disease-free survival curves (B) of abdominal/pelvic FDC sarcomas.
The lesions are divided into hepatic and extrahepatic groups.
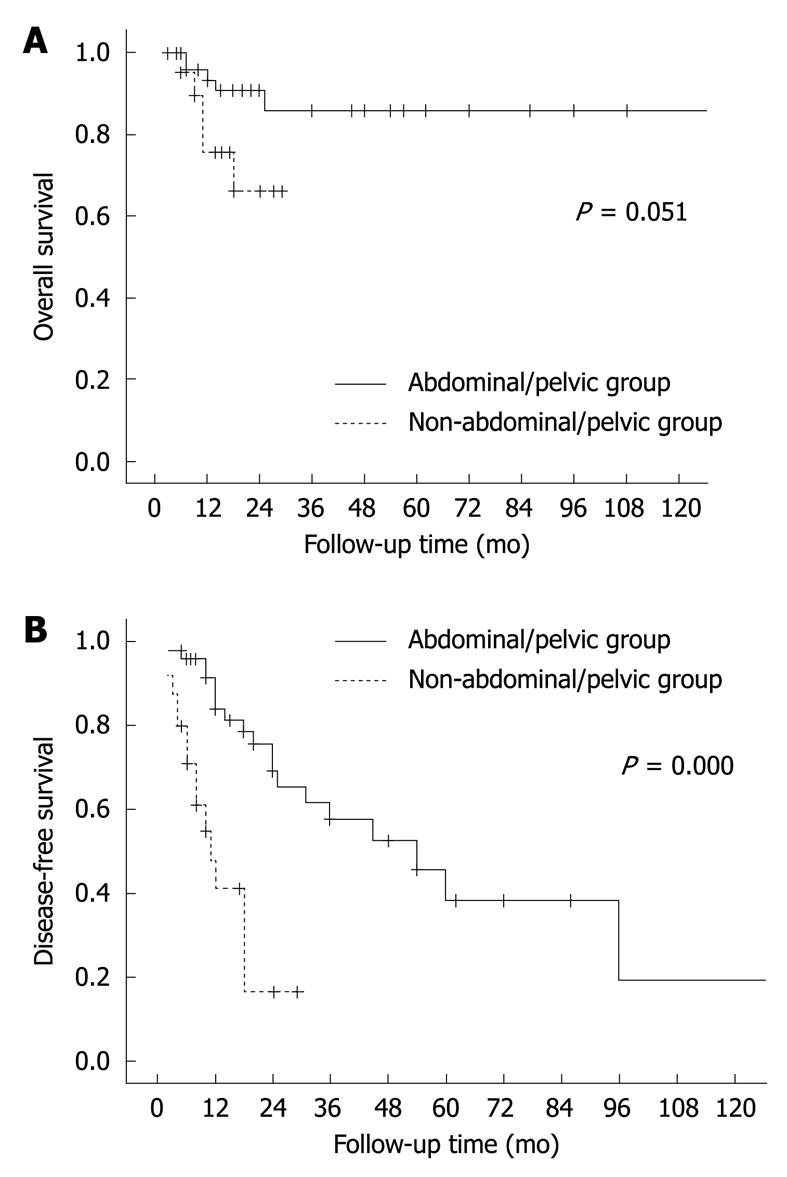
Figure 9 Overall (A) and disease-free survival curves (B) of patients with extrahepatic FDC sarcomas, showing data of 120 mo.
The lesions are divided into abdominal/pelvic and non-abdominal/pelvic groups.
- Citation: Li L, Shi YH, Guo ZJ, Qiu T, Guo L, Yang HY, Zhang X, Zhao XM, Su Q. Clinicopathological features and prognosis assessment of extranodal follicular dendritic cell sarcoma. World J Gastroenterol 2010; 16(20): 2504-2519
- URL: https://www.wjgnet.com/1007-9327/full/v16/i20/2504.htm
- DOI: https://dx.doi.org/10.3748/wjg.v16.i20.2504


